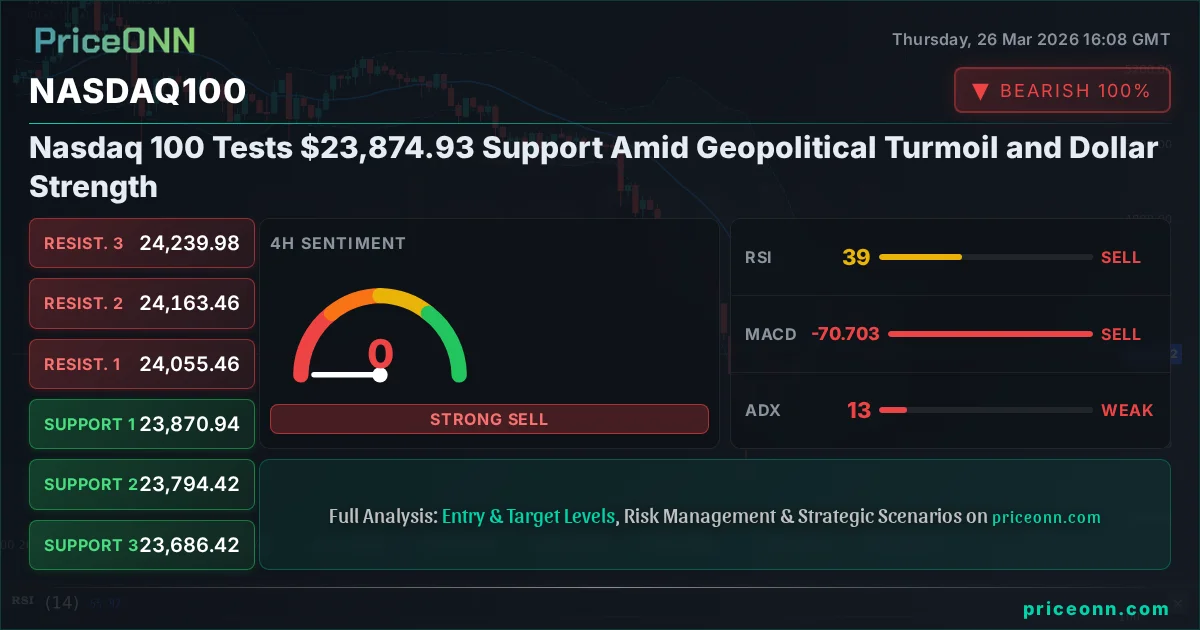
Nasdaq 100 Tests $23,874.93 Support Amid Geopolitical Turmoil and Dollar Strength
Nasdaq 100 hovers at $23,874.93, facing headwinds from a strengthening dollar and escalating geopolitical tensions. Technicals show mixed signals as traders eye key support levels.
The Nasdaq 100 is currently testing critical support around the $23,874.93 mark, caught in a crossfire of geopolitical anxieties and a resurgent US Dollar. This technical juncture is pivotal, as a breakdown could signal further downside, while resilience might offer a reprieve for tech-heavy portfolios. The market sentiment, heavily influenced by global instability and shifting central bank expectations, paints a complex picture for the tech-laden index.
- Nasdaq 100's RSI at 37.17 on the 1H chart signals oversold pressure, but the overall trend remains bearish.
- Critical support for the Nasdaq 100 sits at $23,807.12, a level that has shown resilience in intraday trading but faces significant downside risk.
- The MACD histogram showing negative momentum indicates fading buying interest, suggesting potential for further declines.
- The strengthening DXY, currently at 99.64, is exerting pressure on risk assets like the Nasdaq 100, creating a correlated downward bias.
The tech-heavy Nasdaq 100 is navigating a treacherous landscape, currently hovering precariously near the $23,874.93 level. This is not just another trading day; it's a critical test of underlying strength against a backdrop of escalating geopolitical risks and a firming US Dollar. The market's appetite for risk appears to be waning, a sentiment echoed in the broader equity markets as reflected by the S&P 500 and Dow Jones Industrial Average also trading in the red. This correlation underscores the interconnectedness of major indices and the impact of global events on investor sentiment. Understanding the interplay between these forces is crucial for any trader looking to navigate the current volatility.
The current technical disposition of the Nasdaq 100, particularly on the 1-hour chart, presents a mixed but predominantly cautious outlook. With the Relative Strength Index (RSI) at 37.17, the index is nearing oversold territory, which in isolation might suggest a potential bounce. However, this is tempered by the MACD, which continues to print negative momentum with the MACD line stubbornly below its signal line. This divergence between RSI's oversold reading and MACD's bearish momentum is a classic sign of a weakening trend rather than an immediate reversal. The ADX at 21.13, while not indicating a raging trend, confirms a moderate downward pressure is in play, making any upside attempts fragile. This technical picture suggests that while short-term traders might look for intraday opportunities, the broader trend remains under pressure.
The Bull's Roadmap: Navigating the $24,000 Hurdle
For the bulls to regain control, a decisive push above the $24,010.23 resistance level on the 1-hour chart is paramount. This would not only signify a technical breakout but also suggest a shift in market sentiment, potentially fueled by easing geopolitical tensions or positive economic data. A sustained move above this immediate resistance, ideally with increasing volume, would then target the next significant hurdle at $24,121.81. If this level is cleared with conviction, the psychological barrier of $24,213.34 comes into focus. Such a scenario would likely require a confluence of factors, including a softening DXY (currently at 99.64) and a broader risk-on appetite in global markets. Historically, rallies following such tests of support often gain momentum as short-sellers are squeezed, but confirmation on higher timeframes, like the 4-hour and daily charts, would be essential for a sustained upward move.
The key to a bullish scenario hinges on breaking the immediate psychological and technical resistance points. A move above $24,010.23, followed by consolidation, would be the first sign of renewed buying interest. If the Nasdaq 100 can hold above this level and then decisively clear $24,121.81, the next target becomes the $24,213.34 region. This rally would need to be supported by improving technical indicators; for instance, an RSI moving firmly above 50 and MACD lines crossing positively would reinforce the bullish thesis. Furthermore, a softening Dollar Index (DXY), which is currently showing strength around 99.64, would be a critical tailwind. Investors would also be looking for a positive shift in broader market sentiment, perhaps indicated by a rebound in the S&P 500 (currently at 6537.25) and a decrease in oil prices (Brent at 105.84), which often correlate with reduced inflation fears.
However, the path for bulls is fraught with challenges. The current trend strength on the 1-hour chart, while moderate at ADX 21.13, still points towards downward pressure. Any rally attempt will likely face immediate selling pressure as traders who bought at higher levels look to exit or as short-sellers defend their positions. The significant resistance cluster between $24,010 and $24,213 represents a formidable barrier. A mere test and rejection of this zone would reinforce the bearish outlook, suggesting that the underlying weakness is still dominant. For a sustained bullish move, not only must these resistance levels be breached, but the 4-hour chart also needs to show signs of a trend reversal, with RSI moving consistently above 50 and MACD showing sustained positive momentum. Without these confirmations, any upside movement could be a 'bull trap', luring unsuspecting buyers before a sharp reversal.
Where Bears Take Control: The $23,807.12 Line in the Sand
The bearish scenario gains traction if the Nasdaq 100 fails to hold its ground at the current $23,874.93 level and breaks decisively below the 1-hour support at $23,807.12. This breakdown would likely be exacerbated by increasing geopolitical fears or a further strengthening of the US Dollar, currently trading at 99.64 on the DXY. A close below $23,807.12 on the 1-hour chart would invalidate any immediate hopes for a bounce and open the door to further declines, targeting the $23,715.59 level. If the selling pressure intensifies, the next significant support to watch is at $23,604.01. This bearish outlook is supported by the daily chart's ADX reading of 42.61, indicating a strong downward trend is already in place, and the RSI at 36.69, far from oversold territory.
The downside targets are clearly defined by the support levels on the 1-hour and 4-hour charts. A break below $23,807.12 on the 1H chart is the immediate trigger for bears, potentially leading to a swift move towards $23,715.59. If this level also succumbs to selling pressure, the next logical target is $23,604.01. On the 4-hour chart, the support cluster around $23,794.42 and $23,686.42 comes into play. A decisive breach of these levels would confirm the bearish trend, potentially accelerating the decline towards the daily support at $23,604.01. This scenario would be amplified by negative news flow, a continued rise in the DXY, or a sell-off in risk-sensitive assets like Bitcoin (currently $69,008) and Ethereum ($2,067.08).
The invalidation of this bearish thesis would occur if the Nasdaq 100 manages to reclaim and hold above the $23,900-$24,000 area, specifically breaking through the $24,010.23 resistance. A close back above the 1-hour middle Bollinger Band would also be a warning sign for bears. Given the current market dynamics, particularly the strong dollar and geopolitical uncertainty, the path of least resistance appears to be to the downside. The sell signal from the 4-hour Stochastic (K=11.58, D=45.51) further supports this view, indicating a lack of buying conviction and potential for further price discovery to the downside. The daily chart's overall bearish trend strength (ADX 42.61) reinforces the idea that any bounces are likely to be short-lived.
The Waiting Game: Consolidation Between $23,807 and $24,010
A neutral scenario suggests the Nasdaq 100 might remain range-bound between the immediate support at $23,807.12 and resistance at $24,010.23 for the near term. This consolidation phase would likely occur if there's a balance between buying and selling pressure, perhaps due to conflicting economic signals or a temporary lull in geopolitical headlines. In such a scenario, the index might oscillate within this range, with traders looking for short-term opportunities on either side, but without a clear directional conviction. The ADX readings across multiple timeframes (1H: 21.13, 4H: 12.72, 1D: 42.61) show a mixed picture of trend strength, with some indicating weak trends and others a strong downtrend, which can sometimes lead to choppy, range-bound price action before a decisive move.
During a consolidation period, technical indicators often provide conflicting signals, reflecting the indecision in the market. For instance, the 1-hour RSI might hover around 50, while the 4-hour Stochastic could show oversold conditions, creating ambiguity. Price action would likely be characterized by lower volume and smaller trading ranges. This phase could be driven by market participants awaiting key economic data releases, such as the upcoming USD Consumer Confidence or PMI figures, or simply waiting for clearer direction from geopolitical developments. The lack of a strong trend on the 4-hour chart (ADX 12.72) supports the possibility of a sideways movement, where the index grinds between support and resistance without making significant progress in either direction. Such periods often precede larger moves as energy builds up.
The key to identifying a consolidation phase is the absence of significant catalysts driving either a strong bullish or bearish momentum. If geopolitical tensions do not escalate further and the US Dollar stabilizes around current levels (DXY 99.64), the Nasdaq 100 could find itself in this holding pattern. Trading within this range would require careful risk management, focusing on short-term plays near the boundaries. However, it's crucial to recognize that consolidation phases are inherently temporary. The build-up of pressure within this range increases the probability of a sharp breakout in either direction once a catalyst emerges. Traders should remain vigilant for signs of increasing volume or a decisive breach of either the support or resistance levels defining this potential range.
The Probable Path: Bears Hold the Edge
Considering the current confluence of negative factors - a strengthening US Dollar (DXY at 99.64), persistent geopolitical uncertainty, and the Nasdaq 100's own technical indicators showing bearish momentum - the most probable scenario leans towards the downside. The daily chart's strong downward trend (ADX 42.61) and the RSI at 36.69 suggest that the path of least resistance is currently lower. While the 1-hour RSI is approaching oversold levels, the overall trend strength on higher timeframes indicates that any bounces may be short-lived opportunities for sellers to re-enter the market. The critical support at $23,807.12 is the immediate line in the sand; a failure to hold this level would likely trigger a cascade towards $23,715.59 and potentially $23,604.01.
The probability for the bearish scenario is estimated at approximately 65%. This is primarily driven by the macro environment: the Fed's hawkish undertones (even if rates are paused, the rhetoric matters) continue to support the dollar, while global conflicts inherently increase demand for safe-haven assets and reduce risk appetite. The Nasdaq 100's correlation with risk sentiment means it is particularly vulnerable. The technical picture, especially on the daily chart, confirms this bearish bias. While a short-term bounce is possible, the underlying trend strength suggests that any such move would be a counter-trend rally, likely to be sold into as it approaches resistance levels like $24,010.23.
The bullish scenario, while possible, currently carries a lower probability, perhaps around 25%. This would require a significant shift in market sentiment, such as a de-escalation of geopolitical tensions or dovish signals from the Federal Reserve that are not currently priced in. For this to materialize, the Nasdaq 100 would need to convincingly break above $24,010.23 and sustain the move, targeting higher levels. The neutral scenario, representing consolidation within the $23,807.12 to $24,010.23 range, holds an estimated 10% probability. This could play out in the absence of major news, but the strong underlying trend on the daily chart makes sustained range-bound trading less likely in the short term.
What I'm Watching This Week: Key Triggers for Nasdaq 100
Traders should be closely monitoring several key triggers that could dictate the Nasdaq 100's direction in the coming days. Firstly, the price action around the $23,807.12 support level is critical. A decisive breach below this point, especially on increasing volume, would validate the bearish outlook and open the door for further downside. Secondly, attention must be paid to the US Dollar Index (DXY). If the DXY continues its ascent above 99.64, it will likely exert continued downward pressure on the Nasdaq 100. Conversely, any signs of weakness in the dollar could provide a much-needed catalyst for a relief rally.
Thirdly, upcoming economic data, particularly the US PMI and Consumer Confidence reports, will be crucial. Stronger-than-expected data could reinforce the Fed's hawkish stance, potentially strengthening the dollar further and pressuring the Nasdaq 100. However, unexpectedly weak data might lead to a reassessment of Fed policy expectations, potentially weakening the dollar and offering some support to equities. The geopolitical landscape remains an overarching factor; any significant escalation or de-escalation in global conflicts could rapidly shift market sentiment and trigger sharp moves in the index. Staying informed and adaptable is key in this environment.
Frequently Asked Questions: Nasdaq100 Analysis
What happens if the Nasdaq 100 breaks below the $23,807.12 support level?
A break below $23,807.12 on the 1-hour chart would likely trigger further selling pressure, with the next immediate target being $23,715.59. This would confirm the bearish thesis, especially if accompanied by rising DXY levels and negative geopolitical news.
Should I consider buying the Nasdaq 100 around the current $23,874.93 level given the RSI at 37.17?
While the 1-hour RSI nearing oversold conditions might suggest a short-term bounce opportunity, the overall bearish trend on higher timeframes (Daily ADX 42.61) indicates caution is warranted. A confirmed break above $24,010.23 resistance would be needed for a more reliable bullish signal.
Is the MACD's negative momentum at 37.17 a strong sell signal for the Nasdaq 100 right now?
The negative MACD momentum on the 1-hour chart, coupled with the bearish trend on the daily timeframe, does suggest selling pressure. However, it's not a standalone sell signal without confirmation, such as a decisive break of support or further deterioration in geopolitical risk sentiment.
How will upcoming US PMI data affect the Nasdaq 100 this week, especially with the DXY at 99.64?
Stronger-than-expected PMI data could reinforce the Fed's hawkish stance, potentially boosting the DXY further and pressuring the Nasdaq 100. Conversely, weaker data might prompt a reassessment of Fed policy, possibly weakening the dollar and offering support to the index.
| Indicator | Value | Signal | Interpretation |
|---|---|---|---|
| RSI (14) | 37.17 | Bearish | Nearing oversold on 1H, but downtrending on Daily |
| MACD Histogram | -0.28 | Bearish | Negative momentum persists on 1H |
| Stochastic | 33.54 / 21.64 | Bullish | Bullish crossover in oversold territory on 1H |
| ADX | 21.13 | Bearish | Moderate downtrend strength on 1H; strong on Daily (42.61) |
| Bollinger | Middle Band | Watch | Price below middle band on 1H, 4H, and 1D |
Bearish Scenario: Downside Pressure Mounts
65% ProbabilityNeutral Scenario: Range-Bound Trading
25% ProbabilityBullish Scenario: A Return Above $24,000
10% ProbabilityTrack markets in real-time
AI-powered analysis, technical indicators and real-time price data.
Join Our Telegram Channel
Breaking market news, AI analysis and trading signals instantly.
Join Channel