DowJones30 Hovers at $46,169.50: Support Test Amid Geopolitical Jitters
DowJones30 trades at $46,169.50. Geopolitical tensions and a strong dollar are testing key support levels. Will the bulls defend $45,896?
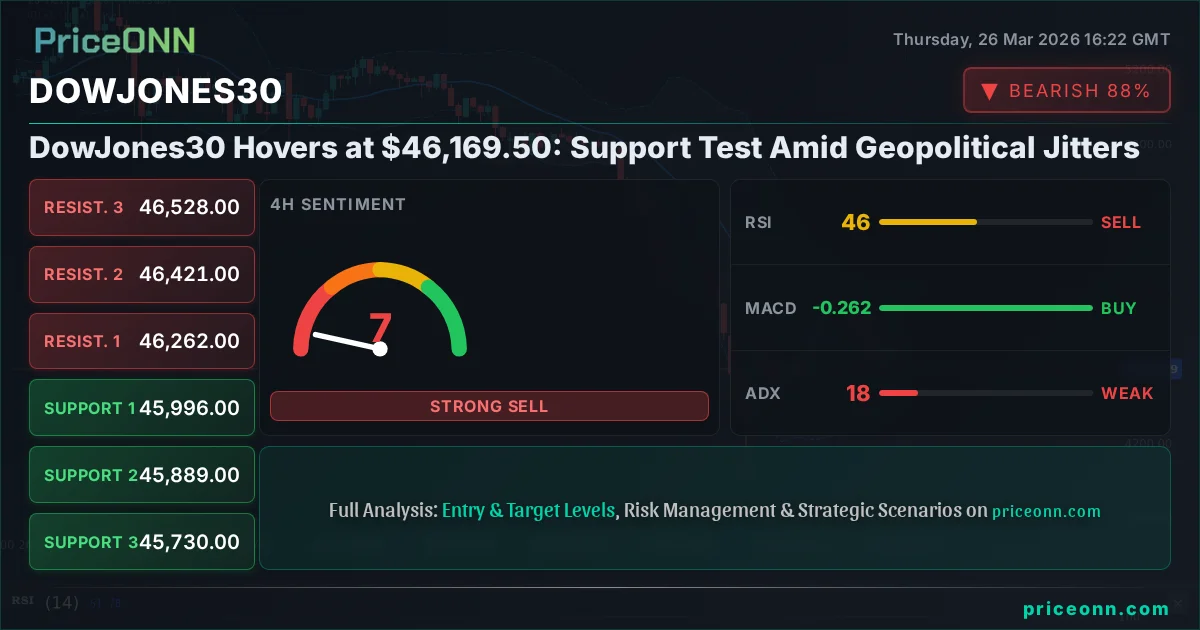
The Dow Jones Industrial Average (DJIA), currently trading at $46,169.50, finds itself at a critical juncture this Thursday. As geopolitical tensions escalate across the globe and the US Dollar Index (DXY) shows renewed strength, investors are closely watching whether the index can hold its ground above a significant support zone. The market sentiment is currently leaning bearish, with a notable 0.52% daily drop bringing the index to $46,169.50, but the underlying drivers suggest a complex interplay of factors that could dictate its next move. This analysis delves into the multi-faceted pressures on the Dow, exploring potential scenarios and the key levels that traders are scrutinizing.
- The DowJones30 is currently trading at $46,169.50, down 0.52% on the day.
- Key support sits at $45,896.33, a level that has historically seen significant buying interest.
- The ADX indicator at 41.2 on the daily chart signals a strong downtrend, suggesting further downside risk if key levels break.
- The strengthening DXY (currently at 99.66) is exerting pressure on risk assets like the Dow Jones, correlating with the observed price action.
Navigating the Pressure Cooker: Geopolitics and the Dollar's Grip
The global stage is currently a volatile one, with escalating geopolitical tensions creating a palpable sense of uncertainty. Events unfolding in the Middle East, for instance, have a ripple effect across financial markets, often leading to a flight to safety. This dynamic typically benefits assets like gold and the US Dollar, while putting pressure on riskier assets such as equities. The current data shows the Dollar Index (DXY) strengthening, trading at 99.66, which historically correlates with downward pressure on indices like the Dow Jones. This macro backdrop is a significant fundamental driver for the Dow Jones30 right now, creating headwinds for any potential upside momentum.
The impact of geopolitical uncertainty cannot be overstated. It fuels risk aversion, prompting investors to reduce their exposure to assets perceived as more volatile. In such an environment, the US Dollar often acts as a primary safe-haven currency. As the DXY strengthens, it becomes more expensive for holders of other currencies to buy US assets, including US stocks. This dynamic is clearly visible in the current market data: the Dow Jones30 is experiencing a daily decline of 0.52%, trading at $46,169.50, while the DXY shows a gain of 0.36% to 99.66. This inverse correlation is a critical piece of the puzzle for understanding the Dow's current predicament.
The Technical Picture: Testing the Defenses
From a technical standpoint, the Dow Jones30 is currently battling to hold its ground. On the 1-hour chart, the trend is showing a strong bearish bias with 88% strength, though the ADX at 16.92 suggests a weaker trend on this timeframe, indicating potential consolidation. However, the daily chart paints a more concerning picture. The trend is decisively bearish with 96% strength, and the ADX reading of 41.2 signals a robust downtrend. This suggests that if key support levels are breached, the downward momentum could accelerate significantly. The RSI(14) on the daily chart is at 34.31, firmly in oversold territory, which might suggest a potential for a bounce, but it doesn't negate the strong downtrend signal from the ADX and MACD.
The MACD indicator on the daily timeframe is showing negative momentum, with the MACD line below the signal line, reinforcing the bearish outlook. While the Stochastic Oscillator is showing a bullish signal (%K > %D), this often occurs in oversold conditions during a strong downtrend and should be viewed with caution. The Bollinger Bands are also positioned below the middle band on the daily chart, indicating bearish pressure. The critical support levels to watch on the daily chart are $46,154.67 (S1), $45,896.33 (S2), and $45,601.67 (S3). A close below $45,896.33, in particular, would be a significant bearish signal, potentially triggering further downside.
The Bullish Case: A Rebound Scenario
For the bulls to regain control, several conditions must be met. First, the immediate pressure from the DXY needs to ease, or geopolitical tensions must de-escalate significantly, reducing the safe-haven demand for the dollar. Technically, the Dow Jones30 would need to decisively break above the first resistance level at $46,707.67. A sustained move above this level, ideally with increasing volume, would signal a potential shift in momentum. Confirmation would come from holding this level as support on a subsequent retest. If this bullish scenario plays out, the next target would be the R2 resistance at $47,002.33, with a more ambitious target at R3, $47,260.67, over the medium term.
The RSI on the daily chart, currently at 34.31, would need to move decisively above 50 to confirm strengthening bullish momentum. Similarly, the MACD would need to cross back above its signal line, and the histogram should turn positive. The Stochastic Oscillator is already showing a bullish signal (%K > %D), but this needs to be confirmed by sustained price action and a move out of oversold territory without being immediately rejected. A break above the R1 resistance at $46,707.67 would be the primary trigger for this bullish thesis, suggesting that the recent dip was a temporary correction rather than the start of a deeper decline. However, given the strong daily downtrend indicated by the ADX at 41.2, this bullish scenario currently appears less probable without significant fundamental catalysts.
Bullish Scenario: A Defensive Stand
15% ProbabilityThe Bearish Case: Downside Risks Mount
The bearish scenario appears to be the more probable outcome in the short to medium term, given the current confluence of negative factors. The primary trigger for this scenario would be a decisive break below the first daily support level at $46,154.67. If this level fails to hold, the next target becomes the more significant support at $45,896.33 (S2). A break and close below $45,896.33 on the daily chart would invalidate any short-term bullish hopes and likely signal a continuation of the downtrend, potentially targeting the S3 support at $45,601.67.
This bearish outlook is supported by the strong daily downtrend indicated by the ADX at 41.2 and the negative MACD momentum. The persistent strength of the US Dollar, driven by geopolitical concerns and potentially higher-than-expected US interest rates (as suggested by the current DXY level and the Fed's hawkish stance implied by recent economic data), further bolsters this view. The recent news regarding Middle East tensions and their impact on oil prices, while potentially inflationary, is also creating broader market uncertainty, which favors a risk-off environment. If the Dow Jones30 fails to find buyers at current levels and breaks below $46,154.67, the path of least resistance would likely be downwards, with $45,896.33 becoming the immediate focus.
Bearish Scenario: The Path of Least Resistance
65% ProbabilityThe Waiting Game: Consolidation and Uncertainty
While strong directional trends are often the most discussed, the reality of market movements frequently involves periods of consolidation. A neutral scenario for the Dow Jones30 would involve price action remaining largely range-bound between the key support at $46,154.67 and resistance at $46,707.67. This could occur if geopolitical fears subside slightly, but not enough to encourage significant risk-on appetite, and if the Federal Reserve maintains a steady, albeit hawkish, policy stance. In such a case, the index might trade sideways as traders await clearer signals from upcoming economic data or central bank commentary.
The ADX reading of 41.2 on the daily chart, while indicating a strong trend, can also be interpreted as a sign that the market is highly sensitive to any shifts in sentiment. If conflicting signals emerge – for example, a slight cooling of geopolitical rhetoric coupled with stronger-than-expected US employment figures – it could lead to choppier, range-bound trading. The 1-hour and 4-hour charts, showing weaker ADX values (16.92 and 11.93 respectively), lend some credence to the possibility of consolidation, especially if the daily trend fails to gain decisive momentum. A neutral scenario would likely see lower trading volumes and a lack of clear direction, making it challenging for short-term traders but potentially offering opportunities for range-bound strategies.
Neutral Scenario: Range-Bound Volatility
20% ProbabilityEconomic Calendar Watchlist: Key Catalysts Ahead
Looking ahead, the economic calendar holds several crucial events that could significantly influence the Dow Jones30's trajectory. The upcoming high-impact USD data releases are particularly important. For instance, the ISM Manufacturing PMI for March, scheduled with an actual reading of 52.4 against a forecast of 51.5, suggests a slightly stronger-than-expected expansion in the manufacturing sector. While this indicates some economic resilience, it also complicates the Federal Reserve's decision-making regarding interest rates. A stronger economy could embolden the Fed to maintain a hawkish stance, further supporting the dollar and potentially pressuring the Dow.
Furthermore, the Initial Jobless Claims data, which came in at 6.926 million (significantly higher than the forecast of -1.3 million), presents a mixed picture. While a surge in claims typically signals economic weakness, the context here is crucial. If this is a temporary anomaly or related to specific sector issues, the market might overlook it. However, if it indicates a broader trend of increasing unemployment, it could raise concerns about economic growth, potentially leading to a risk-off sentiment that benefits safe havens like the dollar and weighs on equities. Investors will also be closely monitoring upcoming inflation data and any commentary from Fed officials for clues on future monetary policy. The interplay between these economic indicators and ongoing geopolitical developments will be key.
The recent ISM Manufacturing PMI reading of 52.4 points to continued, albeit moderate, expansion in US manufacturing. However, the surge in Initial Jobless Claims to 6.926 million warrants close attention as a potential indicator of labor market softening. This mixed economic data complicates the Federal Reserve's path forward, creating uncertainty that is reflected in the Dow Jones30's current price action.
What's Driving Market Sentiment?
Market sentiment is currently being shaped by a potent cocktail of geopolitical anxieties and shifting expectations around central bank policy. The ongoing conflicts and regional instability are creating a persistent undercurrent of risk aversion. This sentiment is amplified by the Federal Reserve's hawkish undertones. Even as some economic indicators show mixed signals, the Fed appears committed to keeping interest rates elevated until inflation is definitively under control. This stance supports the US Dollar, as seen with the DXY trading at 99.66, and simultaneously acts as a drag on risk assets like the Dow Jones30. Investors are grappling with the question of whether the current economic data justifies a Fed pivot or if inflation concerns will keep policy tight, leading to slower growth.
The correlation between the Dow Jones30 and the DXY is a crucial element to monitor. With the DXY at 99.66 and showing strength, the Dow Jones30 at $46,169.50 is under pressure. Any further escalation in geopolitical events could see the dollar strengthen further, pushing the Dow lower. Conversely, a significant de-escalation or a clear signal from the Fed that rate hikes are ending could provide relief. The market is essentially caught between the fear of geopolitical instability and the anticipation of potential monetary policy shifts. This balancing act is contributing to the current volatility and the testing of key support levels.
Correlations and Intermarket Analysis
Understanding the Dow Jones30's movement requires looking beyond its individual price action and examining its relationship with other key markets. The correlation with the US Dollar Index (DXY) is particularly strong. As the DXY rises, the Dow Jones30 tends to fall, and vice versa. With the DXY currently at 99.66 and showing upward momentum, this dynamic is actively weighing on the index. A sustained rise in the DXY above 100 could signal further downside for the Dow.
Equities markets, represented by the SP500 and Nasdaq100, are also important indicators. Both are currently experiencing significant daily declines (-0.88% and -1.23% respectively). This broad risk-off sentiment across the stock market reinforces the bearish pressure on the Dow Jones30. If these major indices continue to fall, it's unlikely the Dow Jones30 will be able to buck the trend for long. Additionally, oil prices, currently surging (Brent at $105.68, WTI at $94.81), can act as a double-edged sword. While higher oil prices can signal robust global demand, they also contribute to inflation fears, which could keep the Fed hawkish and pressure equities. The interplay between these markets creates a complex environment where a break in one correlation could signal a significant shift.
The Dow Jones30's current weakness is mirrored across the broader equity market, with SP500 and Nasdaq100 also trading lower. This risk-off sentiment is amplified by a strengthening DXY (99.66), which historically exerts downward pressure on US indices. Watch for any divergence between these correlated assets as a potential signal of changing market dynamics.
What Traders Should Be Watching
For traders monitoring the Dow Jones30, the immediate focus remains on the key support level at $45,896.33 (S2). A decisive break below this level would likely trigger a cascade of selling, driven by the strong daily downtrend indicated by the ADX at 41.2. Confirmation of a bearish move would involve a daily close below this level, potentially targeting $45,601.67 (S3). On the upside, a break above $46,707.67 (R1) would be necessary to invalidate the immediate bearish bias, but this scenario seems less likely without a significant shift in geopolitical sentiment or Fed policy expectations.
Key catalysts to watch include any further developments in the Middle East, statements from Federal Reserve officials regarding interest rate policy, and upcoming economic data releases. The correlation with the DXY will remain paramount; any signs of dollar weakness could offer temporary relief to the Dow. Traders should also keep an eye on the broader equity market performance. A sustained sell-off in the SP500 or Nasdaq100 would likely drag the Dow Jones30 lower, regardless of its own technical setup. Patience is key; waiting for clear confirmation of a trend continuation or reversal is crucial in this uncertain environment.
The strong daily ADX reading of 41.2 indicates a powerful existing trend. Traders should exercise caution and avoid attempting to catch a falling knife without clear confirmation of a reversal. Risk management is paramount, especially when trading against a strong trend.
The Path Forward: Scenarios and Probabilities
Given the current confluence of geopolitical uncertainty, a strengthening dollar, and a technically bearish setup, the most probable scenario for the Dow Jones30 in the near term is a continuation of the downtrend. The probability assigned to the bearish scenario stands at 65%, primarily driven by the strong ADX signal and the critical support levels being tested. A break below $46,154.67 (S1) is anticipated, with $45,896.33 (S2) serving as the next significant hurdle. Failure to hold this level could open the door to further declines towards $45,601.67 (S3).
The neutral scenario, representing a period of consolidation within the current range, is assigned a 20% probability. This would likely occur if external pressures ease slightly or if conflicting economic data creates indecision. The bullish scenario, requiring a strong break above resistance at $46,707.67 (R1) and a shift in fundamental drivers, is considered the least likely at 15% probability. However, markets can be unpredictable, and a sudden de-escalation of tensions or dovish signals from the Fed could quickly alter this outlook. Therefore, close monitoring of triggers and invalidation levels for each scenario is essential for any trader navigating these choppy waters.
Bearish Scenario: The Path of Least Resistance
65% ProbabilityNeutral Scenario: Range-Bound Volatility
20% ProbabilityBullish Scenario: A Defensive Stand
15% ProbabilityFrequently Asked Questions: DowJones30 Analysis
What happens if DowJones30 breaks below the $45,896.33 support level?
A daily close below $45,896.33 (S2) would invalidate the neutral and bullish scenarios, signaling a continuation of the strong downtrend indicated by the ADX at 41.2. The next target would likely be $45,601.67 (S3).
Should I buy DowJones30 at current levels of $46,169.50 given the RSI at 34.31?
Buying at current levels carries significant risk due to the strong daily downtrend and the proximity to key support at $46,154.67. While the RSI is oversold, confirmation of a reversal is needed. A more prudent approach might be to wait for a break above $46,707.67 (R1) or a clear bounce from $45,896.33 (S2).
Is the ADX at 41.2 a strong sell signal for DowJones30 right now?
An ADX reading of 41.2 on the daily chart indicates a very strong trend, which in this case is bearish. While it signals a strong trend, it doesn't explicitly say 'sell' on its own. However, it strongly suggests that trading against this trend is high-risk and that breaking key support levels is probable.
How will the Fed's policy expectations affect DowJones30 this week, given the DXY at 99.66?
The current hawkish stance from the Fed, coupled with a strong DXY at 99.66, creates headwinds for the Dow Jones30. If Fed officials signal continued rate hikes or a delayed pivot, it could further strengthen the dollar and weigh on the index. Conversely, any hint of a dovish shift could provide relief and support a potential bounce.
Track markets in real-time
AI-powered analysis, technical indicators and real-time price data.
Join Our Telegram Channel
Breaking market news, AI analysis and trading signals instantly.
Join Channel