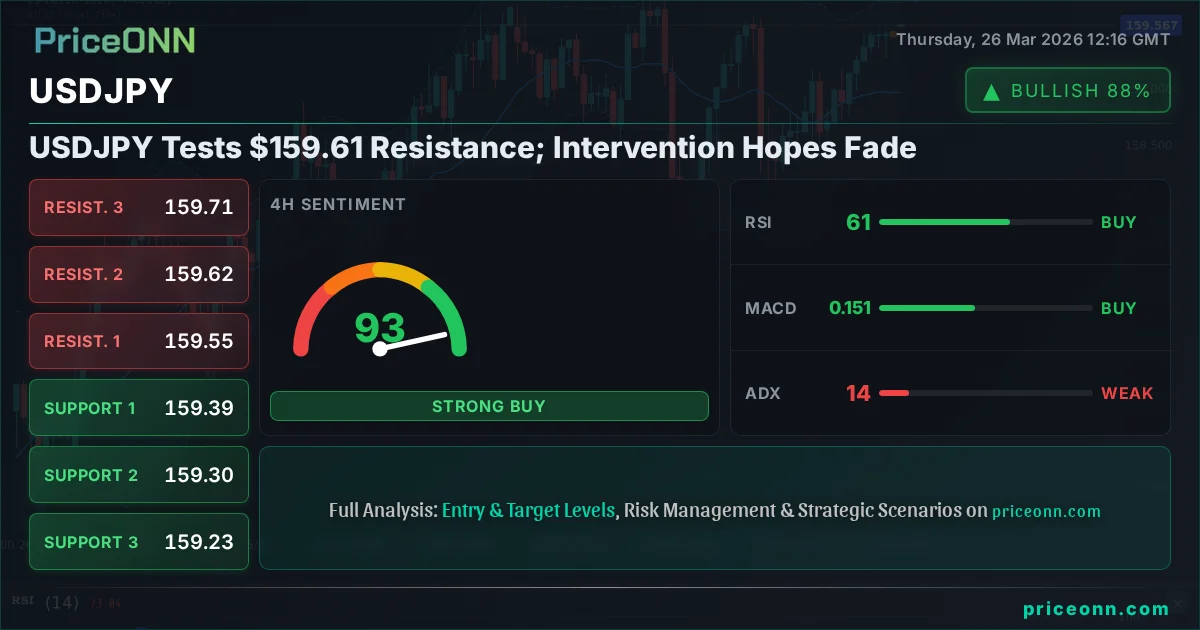
USDJPY Tests $159.61 Resistance; Intervention Hopes Fade
USDJPY hovers near $159.61 as intervention hopes dim. Technicals suggest caution with RSI at 64.6. What's next?
The relentless ascent of USDJPY, now testing the critical $159.61 mark, is putting Japanese policymakers in a tight spot. With intervention fears escalating but lacking concrete signs of decisive action, the market is grappling with the implications of this persistent yen weakness. While the Japanese government has previously warned of 'excessive volatility' and hinted at intervention, the actual implementation remains elusive, leaving traders to navigate a landscape defined by strong dollar momentum and fading hopes for a direct yen defense.
- USDJPY is trading near $159.61, with the 1-hour RSI at 64.6 indicating rising bullish momentum but not yet overbought.
- The key resistance level is at $159.72, while support is found at $159.42, according to 1H data.
- The Dollar Index (DXY) is currently at 99.65, showing a strong uptrend (ADX 31.73 on daily), which typically pressures USDJPY's counterparts.
- Traders are watching upcoming US economic data releases for potential catalysts, alongside ongoing geopolitical tensions influencing safe-haven flows.
This tug-of-war between market forces and potential intervention is creating a tense environment. The Japanese Yen has been on a steady decline against the US Dollar, hitting multi-month highs and raising concerns about import costs and inflation. The $159.61 price point is not just another number; it's a psychological level that has historically been sensitive for currency markets, especially when it involves significant shifts in major currency pairs like USDJPY.
The recent news flow, including remarks from policymakers and market analyses, suggests a growing unease. Reports indicate that while the threat of intervention looms, its effectiveness and timing remain uncertain. This ambiguity allows the USDJPY pair to consolidate and even push higher, as traders bet on the continuation of current trends until a clear intervention signal emerges. The market sentiment is a complex mix of dollar strength, driven by interest rate differentials and safe-haven demand, and a weakening yen, burdened by Japan's monetary policy divergence from other major economies.
The Yen's Slippery Slope: Macroeconomic Crosscurrents
The fundamental backdrop for USDJPY's ascent is multi-faceted. On one hand, the US Dollar remains robust, buoyed by expectations surrounding the Federal Reserve's monetary policy. While the Fed has signaled a pause in rate hikes, the higher-for-longer narrative continues to support dollar strength against currencies where central banks are pursuing looser policies or are constrained by domestic economic conditions. The current DXY level at 99.65, with a strong daily uptrend indicated by ADX 31.73, reinforces this narrative. A rising DXY typically exerts downward pressure on major currency pairs like EURUSD and GBPUSD, and often provides a tailwind for USDJPY.
Conversely, the Japanese Yen faces its own set of headwinds. The Bank of Japan (BOJ) has maintained its ultra-loose monetary policy, a stark contrast to the tightening cycles seen in many other developed economies. This policy divergence creates a significant interest rate differential, making yen-denominated assets less attractive to carry traders and global investors seeking yield. The continued dovish stance from the BOJ, despite some inflationary pressures, means that the yen remains vulnerable to further depreciation. This fundamental imbalance is a primary driver behind the USDJPY's upward trajectory, pushing it towards levels not seen in years.
Geopolitical tensions also play a crucial role, albeit with a more nuanced impact on USDJPY compared to safe-haven assets like gold or even the Swiss Franc. While a surge in global uncertainty typically benefits the yen as a safe-haven currency, the overwhelming strength of the US dollar and the specific policy dynamics of Japan seem to be overshadowing this traditional correlation. The market is currently more focused on interest rate differentials and the perceived lack of immediate intervention from Japanese authorities. This suggests that for the yen to find significant strength, a clear shift in either the Fed's stance or the BOJ's policy, or a dramatic escalation of global risks, would be required.
Technical Signals: Charting the Path at $159.61
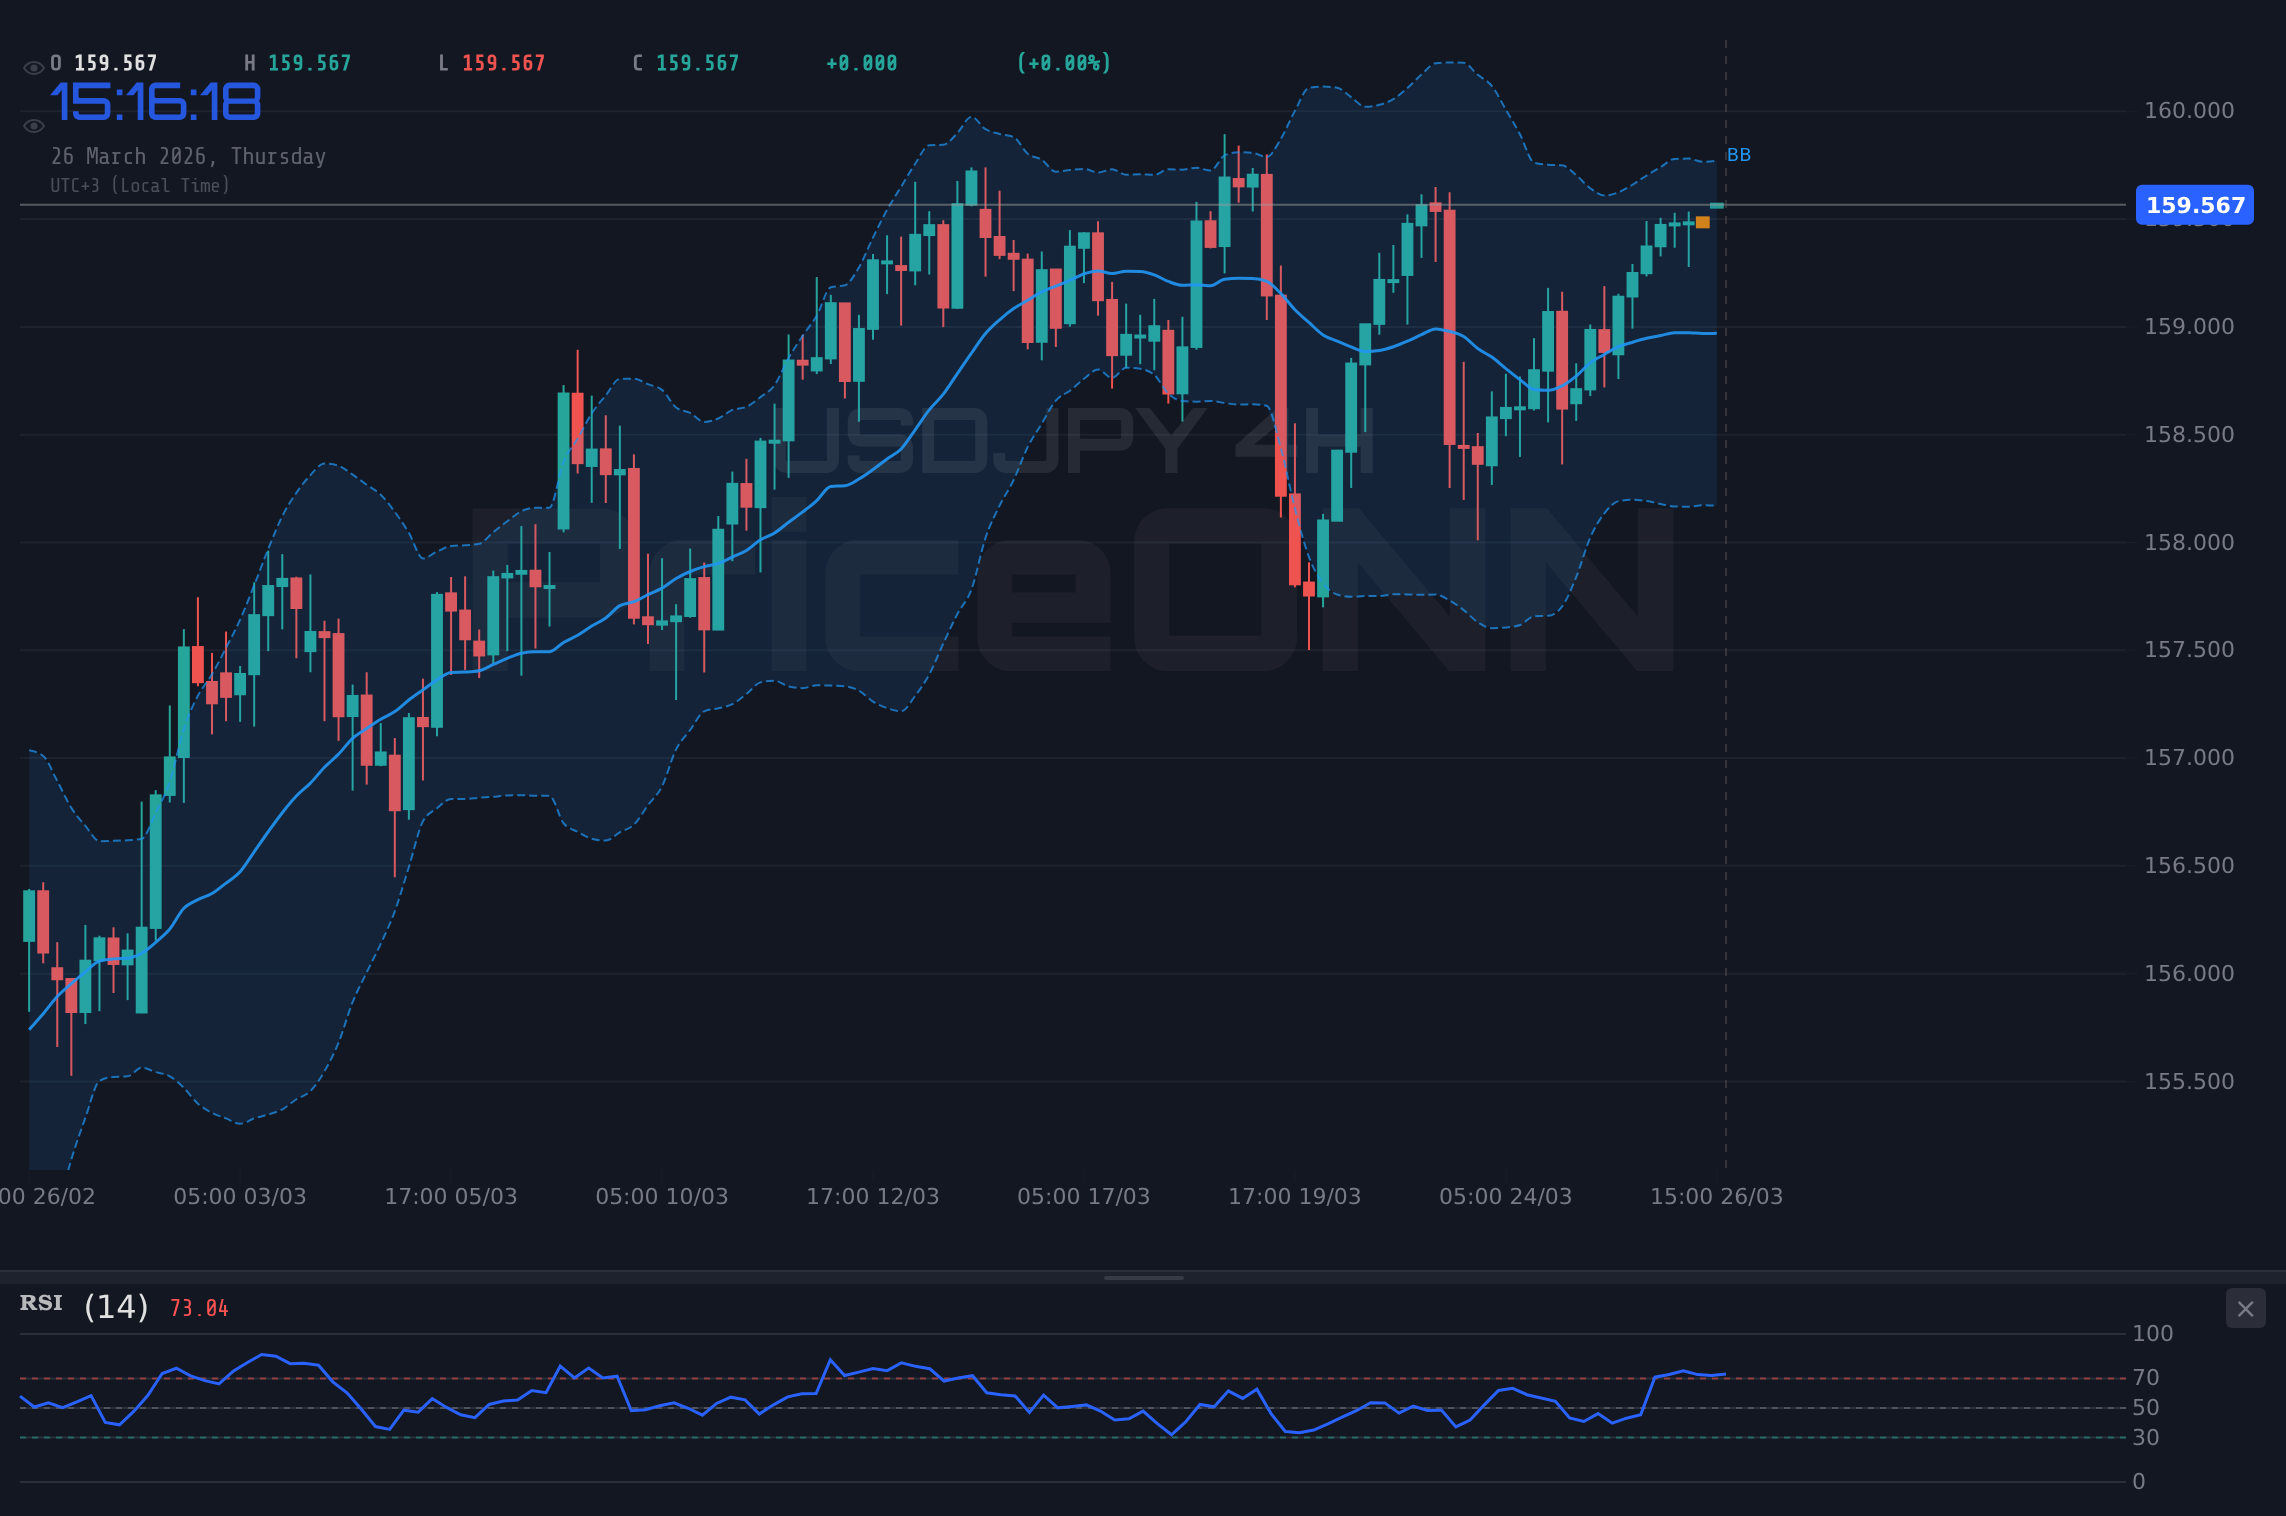
From a technical standpoint, USDJPY is navigating a crucial resistance zone around the $159.61 level. On the 1-hour chart, the RSI is at 64.6, suggesting upward momentum is present but not yet in overbought territory. This indicates that there might still be room for prices to climb, but the proximity to 70 warrants caution. The MACD is negative, with the MACD line below the signal line, hinting at weakening momentum in the short term, despite the overall uptrend. Bollinger Bands are positioned above the middle band, confirming the bullish bias on this timeframe, but a move towards the upper band at $159.545 could signal potential exhaustion if not accompanied by strong volume.
The 4-hour timeframe presents a more neutral picture, with the trend strength at 50%. The RSI at 48.06 is hovering near the midpoint, indicating indecision. However, the MACD remains negative, and Stochastic %K (11.24) is below %D (22.07), both signalling a potential downside correction. The ADX at 11.45 on this timeframe points to a weak trend, suggesting that any move, up or down, might lack strong conviction. This could imply a period of consolidation before the next significant directional move. The support level at $159.501 and resistance at $159.678 highlight the tight range within which the pair might be trading.
The daily chart, however, paints a picture of a strong downward trend in the broader context of the yen's weakness, with an ADX of 34.17. While the current price is $159.61, the daily RSI at 41.79 is still in neutral territory, leaning towards a bearish sentiment. The MACD is positive on this timeframe, with the MACD line above the signal line, indicating underlying bullish momentum. However, Stochastic %K (67.8) is above %D (65.37), suggesting a potential upward bias, but this is counteracted by the overall bearish signal from the daily ADX. This conflict between indicators on different timeframes underscores the complexity of the current market. The key daily support sits at $159.324, and resistance at $160.79, indicating a wider range for potential price action.
The Intervention Dilemma: A Test of Resolve
The core of the current USDJPY narrative revolves around the possibility of currency intervention by Japanese authorities. Historically, intervention has been a tool used sparingly and strategically to curb excessive yen depreciation. However, the effectiveness of such measures is often debated. Direct intervention involves selling USD and buying JPY in the forex market, which can temporarily boost the yen but may not alter the underlying fundamental drivers if interest rate differentials remain wide. The market often tests the resolve of authorities, pushing prices to levels where intervention becomes more likely, only to see authorities hesitate or intervene in a way that proves insufficient to reverse the trend.
The current situation, with USDJPY hovering around $159.61, is precisely the kind of scenario that prompts intervention talks. If the pair breaches key psychological levels, like $160, the pressure on the Ministry of Finance and the Bank of Japan will intensify. However, the timing and scale of any potential intervention are critical. A small-scale intervention might be easily absorbed by the market, while a large-scale one could cause significant short-term volatility. Traders are therefore on high alert, looking for any signals - verbal or actual market action - that might indicate a shift in policy. The lack of clear communication and the historical precedent of verbal warnings followed by limited action suggest that markets might continue to test these levels.
The correlation with the DXY is also a key factor. With the DXY at 99.65 and showing strength, it adds another layer of complexity. If the dollar continues to strengthen across the board, it becomes harder for Japan to counteract this trend solely through intervention without significant and sustained market action. The upcoming US economic data, such as employment figures and inflation reports, will be crucial in shaping the Fed's future policy path, which in turn will influence the DXY and, consequently, USDJPY. Any data points suggesting a hotter-than-expected US economy could further embolden dollar bulls and complicate Japan's intervention strategy.
Navigating the Path Forward: Scenarios and Outlook
Given the current technical and fundamental landscape, several scenarios could unfold for USDJPY. The immediate focus remains on the $159.61 price point and the key resistance at $159.72. A sustained break above this level, especially on increased volume and with positive news flow, could signal a continuation of the upward trend towards the next resistance at $160.79. This scenario would likely occur if US economic data continues to surprise to the upside, reinforcing the Fed's hawkish stance, or if any hints of intervention prove to be insufficient to deter dollar buyers.
Conversely, a failure to break above the $159.72 resistance could lead to a pullback. The immediate support at $159.42 would be the first level to watch. A decisive break below this level, potentially triggered by weaker US data or a stronger-than-expected statement from Japanese authorities signaling a credible threat of intervention, could see USDJPY testing lower supports. The 4-hour chart's neutral trend strength and the daily chart's ADX of 34.17 suggest that while the overarching trend has been bearish for the yen, there's potential for corrections. The key daily support at $159.324 becomes a significant level to monitor in such a case.
A consolidation scenario is also plausible, especially if economic data remains mixed and there's no clear signal from either the Fed or Japanese authorities. In this case, USDJPY might trade within a range, potentially between $159.324 and $159.72, as the market awaits further catalysts. This period of consolidation could be a 'calm before the storm,' allowing underlying pressures to build before a more significant move. Traders would need to be patient, waiting for clear breakouts or breakdowns, and closely monitor volume and broader market sentiment, including the performance of the DXY and risk assets like SP500.
Bearish Scenario: Yen Strength Emerges
55% ProbabilityNeutral Scenario: Consolidation Around $159.61
30% ProbabilityBullish Scenario: Dollar Strength Continues
15% ProbabilityFrequently Asked Questions: USDJPY Analysis
What happens if USDJPY breaks above the $159.72 resistance?
A sustained break above $159.72, especially on strong volume, could signal a continuation of the bullish trend. This might push USDJPY towards the next key resistance level at $160.79, particularly if US economic data remains strong and intervention fears subside.
Should I consider buying USDJPY around the current $159.61 level given the RSI at 64.6?
Buying at current levels carries risk, as the RSI at 64.6 on the 1-hour chart suggests upward momentum but is approaching overbought territory. A more prudent approach might be to wait for a confirmed break above $159.72 or a pullback to a support level like $159.324, especially if the DXY continues its uptrend.
Is the negative MACD signal on the 1-hour chart a concern for USDJPY at $159.61?
Yes, the negative MACD signal on the 1-hour chart, with the MACD line below the signal line, indicates weakening short-term momentum. While the overall trend might still be bullish due to broader dollar strength, this divergence suggests potential for a short-term pullback or consolidation around the current $159.61 levels.
How will upcoming US economic data affect USDJPY this week, given the current price around $159.61?
Stronger-than-expected US economic data (like employment or inflation figures) could reinforce the Fed's hawkish stance, boosting the DXY and potentially pushing USDJPY above $159.72. Conversely, weaker data might lead to a dollar pullback and a test of support levels around $159.324, as the market re-evaluates Fed policy expectations.
Track markets in real-time
AI-powered analysis, technical indicators and real-time price data.
Join Our Telegram Channel
Breaking market news, AI analysis and trading signals instantly.
Join Channel