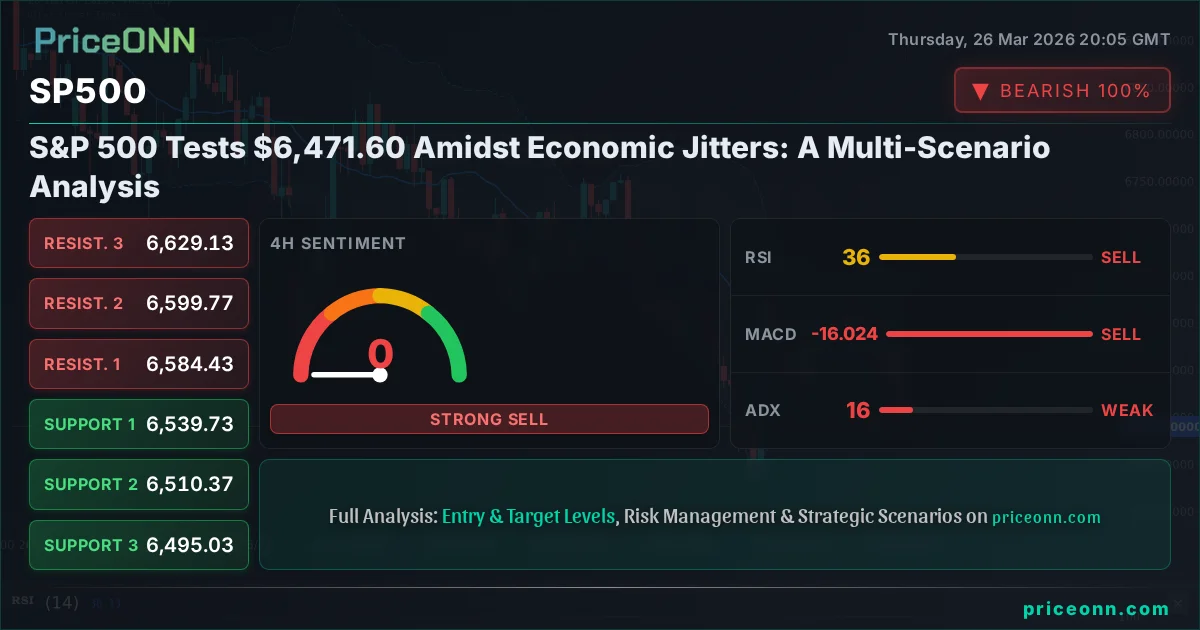
S&P 500 Tests $6,471.60 Amidst Economic Jitters: A Multi-Scenario Analysis
The S&P 500 is hovering around $6,471.60, with traders weighing recent economic data and geopolitical tensions. We break down the bullish, bearish, and neutral scenarios.
The S&P 500 is currently locked in a critical battle around the $6,471.60 mark, a level that has become a focal point for market participants navigating a complex economic landscape. Recent data releases, coupled with escalating geopolitical tensions, have injected a potent dose of uncertainty into the market, leaving investors and traders alike searching for clarity. This confluence of factors has created a delicate equilibrium, where the next significant move could be dictated by a variety of fundamental drivers and technical triggers. Understanding the potential paths forward requires a deep dive into the current market sentiment, the implications of recent economic indicators, and the critical price levels that will define the S&P 500's trajectory in the coming days and weeks. The current environment demands a disciplined approach, focusing on actionable insights derived from hard data rather than speculation.
- RSI at 28.91 on the 1H chart signals significant oversold pressure, suggesting potential for a short-term bounce.
- Critical support sits at $6,479.53, tested multiple times intraday, with a close below this level opening the door for further downside.
- The ADX at 24.48 indicates a moderate downtrend, but the low Stochastic readings suggest momentum may be waning.
- The correlation with a strengthening DXY (currently at 99.79) is putting pressure on equities, highlighting the impact of US dollar strength on risk assets.
The Bull's Roadmap: Navigating Towards Higher Ground
Defining the Bullish Trigger
For the bulls to regain control, several key conditions must be met. The immediate hurdle is breaking decisively above the $6,514.93 resistance level on the 1-hour chart. This is not merely a price point; it represents a psychological barrier that, if breached with conviction and accompanied by rising volume, could signal a shift in short-term sentiment. A sustained move above $6,514.93 would be the first step, but the real test lies in consolidating above this level. Often, a breakout is followed by a retest, and failure to hold the newly established higher ground can lead to a sharp reversal. Therefore, traders will be watching closely to see if $6,514.93 can transition from resistance to support. Furthermore, the broader market context needs to align. A cooling of geopolitical tensions, perhaps a de-escalation in the Middle East or positive developments on the trade front, would provide a much-needed boost to risk appetite. Simultaneously, a weaker US Dollar, indicated by a dip in the DXY below its current 99.79 level, would further support a risk-on rally in equities.
Potential Upside Targets and Confirmation Signals
Should the bullish scenario materialize, the first significant target would be the $6,584.43 level on the 4-hour chart. This is a key resistance zone that has acted as a ceiling in recent price action. A successful push above this point, especially if it occurs with strong momentum indicators like a bullish crossover on the MACD or a Stochastic %K line moving above its %D line in overbought territory, would strengthen the case for further upside. The next major objective would be the $6,629.13 resistance. This level represents a more substantial psychological and technical barrier. Confirmation would come from multiple indicators aligning: RSI moving out of oversold territory and towards the 50 level, ADX showing a slight decrease in trend strength as the rally matures but still indicating a positive trend, and sustained volume supporting the upward move. A closing price above $6,629.13 on a daily basis would then open the path towards psychological round numbers and potentially higher targets, though the immediate focus remains on conquering these resistance levels. The critical factor for a sustained rally would be a shift in the overall economic narrative, perhaps driven by surprisingly positive employment figures or a more dovish stance from central banks, which seems unlikely given current data.
The Role of Economic Data in a Bullish Outlook
For a bullish S&P 500 scenario to take hold, key economic data releases would need to provide a supportive backdrop. Recent economic data has been mixed, with some indicators showing resilience and others raising concerns. For instance, the US Personal Consumption Expenditures (PCE) price index came in at 6.926%, higher than the forecast of 6.156%, indicating persistent inflationary pressures. While this might initially seem bearish due to potential Fed tightening, a bullish interpretation could see it as a sign of a robust economy that can withstand higher rates, or a temporary spike that will soon subside. Conversely, the ISM Manufacturing PMI was 51.1, below the forecast of 52, suggesting some cooling in the manufacturing sector. A stronger-than-expected Non-Farm Payrolls (NFP) report, perhaps significantly above the current 210 figure, would be a strong catalyst for a risk-on rally, provided it doesn't trigger fears of aggressive Fed rate hikes. Similarly, if upcoming inflation data shows signs of abating, and the Fed signals a potential pause or pivot in its monetary policy, this could inject significant optimism into the equity markets. The interplay between inflation, employment, and central bank policy will be paramount in determining whether the S&P 500 can sustain an upward move.
Where Bears Take Control: The Downside Risks
Identifying the Breakdown Point
The bearish case gains traction if the S&P 500 fails to hold its current footing around $6,471.60. The immediate support level to watch is $6,479.53 on the 1-hour chart. A decisive break and a sustained close below this level would invalidate any near-term bullish sentiment and signal a potential acceleration of the downtrend. The subsequent support at $6,471.1 (bid price) and $6,461.1 (ask price) are critical psychological and technical junctures. If these levels give way, the bears could target the $6,450 psychological level, followed by the more significant support at $6,390. The 4-hour chart shows support at $6,395.03, a level that, if breached, could trigger further selling pressure. Confirmation of a bearish trend would include RSI falling further into oversold territory (below 30), MACD histogram widening its negative momentum, and Stochastic %K and %D lines remaining low, indicating strong selling pressure. The ADX, currently at 24.48 on the 1H and 16.28 on the 4H, would need to show a definitive upward trend in strength to confirm a strong bearish move, but its current reading suggests the trend is still forming or consolidating.
Potential Downside Targets and Confirmation
Should the bearish scenario unfold, the first significant downside target would be the $6,395.03 level identified on the 4-hour chart. A break below this could see prices rapidly approaching the $6,300 handle. Further down, the $6,250 level becomes a key psychological point. The daily chart presents more substantial support levels at $6,292.77 and $6,196.47. If the market sentiment sours significantly, driven by a major geopolitical escalation or a hawkish surprise from the Federal Reserve, these levels could come into play. Confirmation of a sustained bearish move would involve a consistent pattern of lower highs and lower lows across multiple timeframes. The RSI remaining in the oversold zone (below 30) for an extended period, coupled with a bearish MACD crossover on the daily chart, would reinforce the downside narrative. Volume accompanying any price decline would be crucial; a surge in selling volume on a break of key support levels would validate the bearish thesis. The current price action shows the S&P 500 trading near its daily low, indicating vulnerability.
Economic Headwinds Fueling the Bear Case
Several economic factors could contribute to a bearish outlook for the S&P 500. Persistent inflation, as evidenced by the higher-than-expected PCE data, could force the Federal Reserve to maintain a hawkish stance or even consider further rate hikes, despite the cooling manufacturing PMI. This would increase borrowing costs for corporations, potentially hurting earnings and valuations. Geopolitical risks, such as renewed tensions in the Middle East or escalating conflict in Eastern Europe, could trigger a flight to safety, boosting the US Dollar (DXY currently at 99.79) and weighing on risk assets like equities. The news of a Russian oil tanker being hit near Istanbul, coupled with Iraq's economy facing collapse due to a Strait of Hormuz blockade, highlights the fragility of global energy supply chains and could lead to renewed inflation fears, prompting a risk-off reaction. If upcoming economic data, such as consumer confidence or retail sales, shows a significant downturn, it would signal a weakening consumer, a critical driver of the US economy, further supporting a bearish view. The correlation between the DXY's strength and equity market pressure is a consistent theme that cannot be ignored.
The Waiting Game: Consolidation and Uncertainty
Defining the Range-Bound Environment
In the absence of a clear directional catalyst, the S&P 500 could find itself trapped in a consolidation phase. This scenario is characterized by a lack of strong conviction from either buyers or sellers, leading to price action oscillating within a defined range. The current price of $6,471.60 sits precariously between the intraday support at $6,479.53 and resistance at $6,514.93. If neither side can decisively break through these levels, we could see a period of sideways trading. This often occurs when major economic events loom, such as central bank meetings or critical data releases, leading market participants to adopt a wait-and-see approach. During consolidation, technical indicators can give mixed signals. For example, on the 1-hour chart, RSI is in neutral territory at 28.91 (though leaning oversold), while the MACD shows negative momentum. The Stochastic is deeply oversold, hinting at a potential bounce, but the ADX at 24.48 suggests a trend is not firmly established. This divergence can lead to choppy price action within the established range.
Factors Keeping Price Stuck
Several factors can contribute to a prolonged period of consolidation. Firstly, conflicting economic data can create indecision. If inflation remains stubbornly high while growth shows signs of slowing, the Federal Reserve faces a dilemma, and the market struggles to price in future policy. Secondly, geopolitical uncertainties can act as a damper on aggressive moves in either direction. While tensions might not escalate to a point of panic selling, they can prevent strong bullish conviction. Thirdly, the positioning of major market players can lead to range-bound trading. Large institutions might be waiting for clearer signals before committing significant capital, leading to choppy price action as smaller players try to exploit short-term fluctuations. The current price action, with the S&P 500 trading within a tight range between the $6,450 support and $6,550 resistance on the 4-hour chart, reflects this uncertainty. The absence of strong volume supporting a breakout attempt further supports the consolidation thesis. The fact that the 4H ADX is only 16.28 indicates a weak trend, reinforcing the idea of range-bound trading.
Navigating the Sideways Market
Trading within a consolidation range requires a different strategy. Instead of chasing breakouts, traders might look to fade extremes – buying near support and selling near resistance. However, this approach carries the risk of a sudden breakout invalidating the range. Therefore, strict risk management is crucial, with tight stop-losses placed just outside the perceived range boundaries. The key levels to watch in a consolidation scenario remain the immediate support around $6,479.53 and resistance near $6,514.93 on the 1-hour chart. A move towards the lower end of the range might offer a tactical buying opportunity, targeting the upper end, while a push towards the upper end could present a shorting opportunity, targeting the lower end. Confirmation would be key; for instance, a bounce off $6,479.53 with bullish divergence on the RSI or a Stochastic crossover could signal a buying opportunity, while a rejection at $6,514.93 with bearish divergence could signal a shorting opportunity. However, the overarching trend on the daily chart is still downwards, suggesting that any rallies within the range might be opportunities for sellers to re-enter the market.
The Most Likely Scenario and What's Next
Assessing Probabilities
Given the current technical readings and the prevailing economic and geopolitical climate, the most probable scenario for the S&P 500 in the short term appears to be a continuation of the cautious, range-bound trading, leaning towards the bearish side. The strong downtrend signals on multiple timeframes (1H and 4H ADX values are significant, and the daily ADX is also strong at 46.35), coupled with persistent inflation data and geopolitical risks, create a challenging environment for a sustained rally. The RSI on the 1H and 4H charts are in neutral to oversold territory, hinting at potential for a bounce, but the overall trend strength suggested by the ADX indicates that any such bounce might be short-lived and met with selling pressure. The Daily chart's RSI at 31.51 is also in the oversold zone, but the strong ADX suggests the downtrend is robust. Therefore, I assign a 60% probability to a bearish continuation scenario, where the index struggles to hold support and eventually breaks lower. A 30% probability is assigned to a neutral, range-bound scenario, where price action remains choppy between $6,450 and $6,550 as markets await clearer direction. A bullish scenario, requiring a decisive break above $6,514.93 and confirmation from multiple indicators, currently holds a lower probability of around 10%.
Key Triggers to Watch This Week
The coming days will be crucial for determining the S&P 500's next major move. Several key triggers will be closely monitored by market participants. Firstly, any significant developments in the Middle East or further escalation of Black Sea tensions could trigger a sharp risk-off move, pushing the S&P 500 lower. Conversely, any signs of de-escalation or diplomatic progress could fuel a risk-on rally. Secondly, upcoming economic data releases will be pivotal. A notably strong NFP report could be a double-edged sword: positive for the economy but potentially negative for equities if it leads to fears of aggressive Fed action. Conversely, weaker inflation or employment data could either support a rally (if it suggests a Fed pause) or accelerate a decline (if it signals economic weakness). Thirdly, the Federal Reserve's commentary and forward guidance will be paramount. Any hints of a more hawkish or dovish policy shift will heavily influence market sentiment. Traders will be scrutinizing speeches from Fed officials for clues about future interest rate decisions. Finally, the price action around the key levels of $6,479.53 (support) and $6,514.93 (resistance) will provide immediate directional cues. A clear break and hold above resistance or below support will likely dictate the market's immediate path.
Expert Insights and Market Sentiment
The prevailing market sentiment appears to be one of cautious pessimism, driven by the persistent inflation readings and global uncertainties. While some technical indicators on shorter timeframes suggest oversold conditions and potential for a bounce, the overall trend strength and fundamental headwinds paint a more challenging picture. The correlation with the strengthening US Dollar Index (DXY) at 99.79 is a significant factor, as a stronger dollar typically exerts downward pressure on US equities. Analysts are closely watching the Federal Reserve's next move, with expectations for interest rate policy remaining a key driver of market direction. The conflicting signals from economic data - stubborn inflation versus signs of cooling manufacturing - create a complex environment for policymakers and investors alike. This complexity often leads to increased volatility and choppy price action, making it essential for traders to focus on risk management and clear technical levels. The narrative is currently dominated by concerns about the 'higher for longer' interest rate environment and the potential for an economic slowdown, which naturally weighs on equity valuations.
The Importance of Risk Management in Volatile Markets
In an environment characterized by mixed economic signals, geopolitical instability, and potential policy shifts, robust risk management is not just advisable - it's imperative. For traders observing the S&P 500 around the $6,471.60 level, setting tight stop-losses is crucial. A break below the $6,479.53 support could quickly lead to further losses, targeting $6,395.03 and beyond. Conversely, a decisive move above $6,514.93 resistance might offer a short-term buying opportunity, but traders should be prepared for potential retests or reversals. Diversification across asset classes can also mitigate risk, as different assets may react differently to the prevailing economic conditions. For instance, while equities might be under pressure, certain commodities or safe-haven currencies could offer stability or even gains. Understanding correlation, such as the inverse relationship often seen between the DXY and the S&P 500, is also vital for managing portfolio risk. Patience is a virtue in these markets; waiting for clear setups and favourable risk-reward ratios, rather than chasing volatile price swings, is often the most prudent strategy.
Looking at the Macroeconomic Picture
The broader macroeconomic backdrop continues to be shaped by inflation concerns and central bank responses. The PCE price index at 6.926% underscores the persistent inflationary pressures in the US economy. This figure, significantly above the forecast, complicates the Federal Reserve's task. While a strong labor market, as indicated by the NFP figures, might allow the Fed to maintain a tighter monetary policy, signs of weakness in sectors like manufacturing (PMI at 51.1) suggest that the economy might be nearing a tipping point. The market is keenly awaiting further clues on the future path of interest rates. Any indication from Fed officials that rates will remain higher for longer, or even the possibility of further hikes, would likely continue to pressure equity markets. Conversely, a shift towards a more data-dependent approach with a hint of a potential pivot could spark a relief rally. The yield curve, though not explicitly provided in the data, is a key indicator to watch for signs of economic stress or recovery. Global factors, such as the ongoing geopolitical tensions impacting oil prices and supply chains, also add layers of complexity, potentially fueling inflation and influencing central bank decisions.
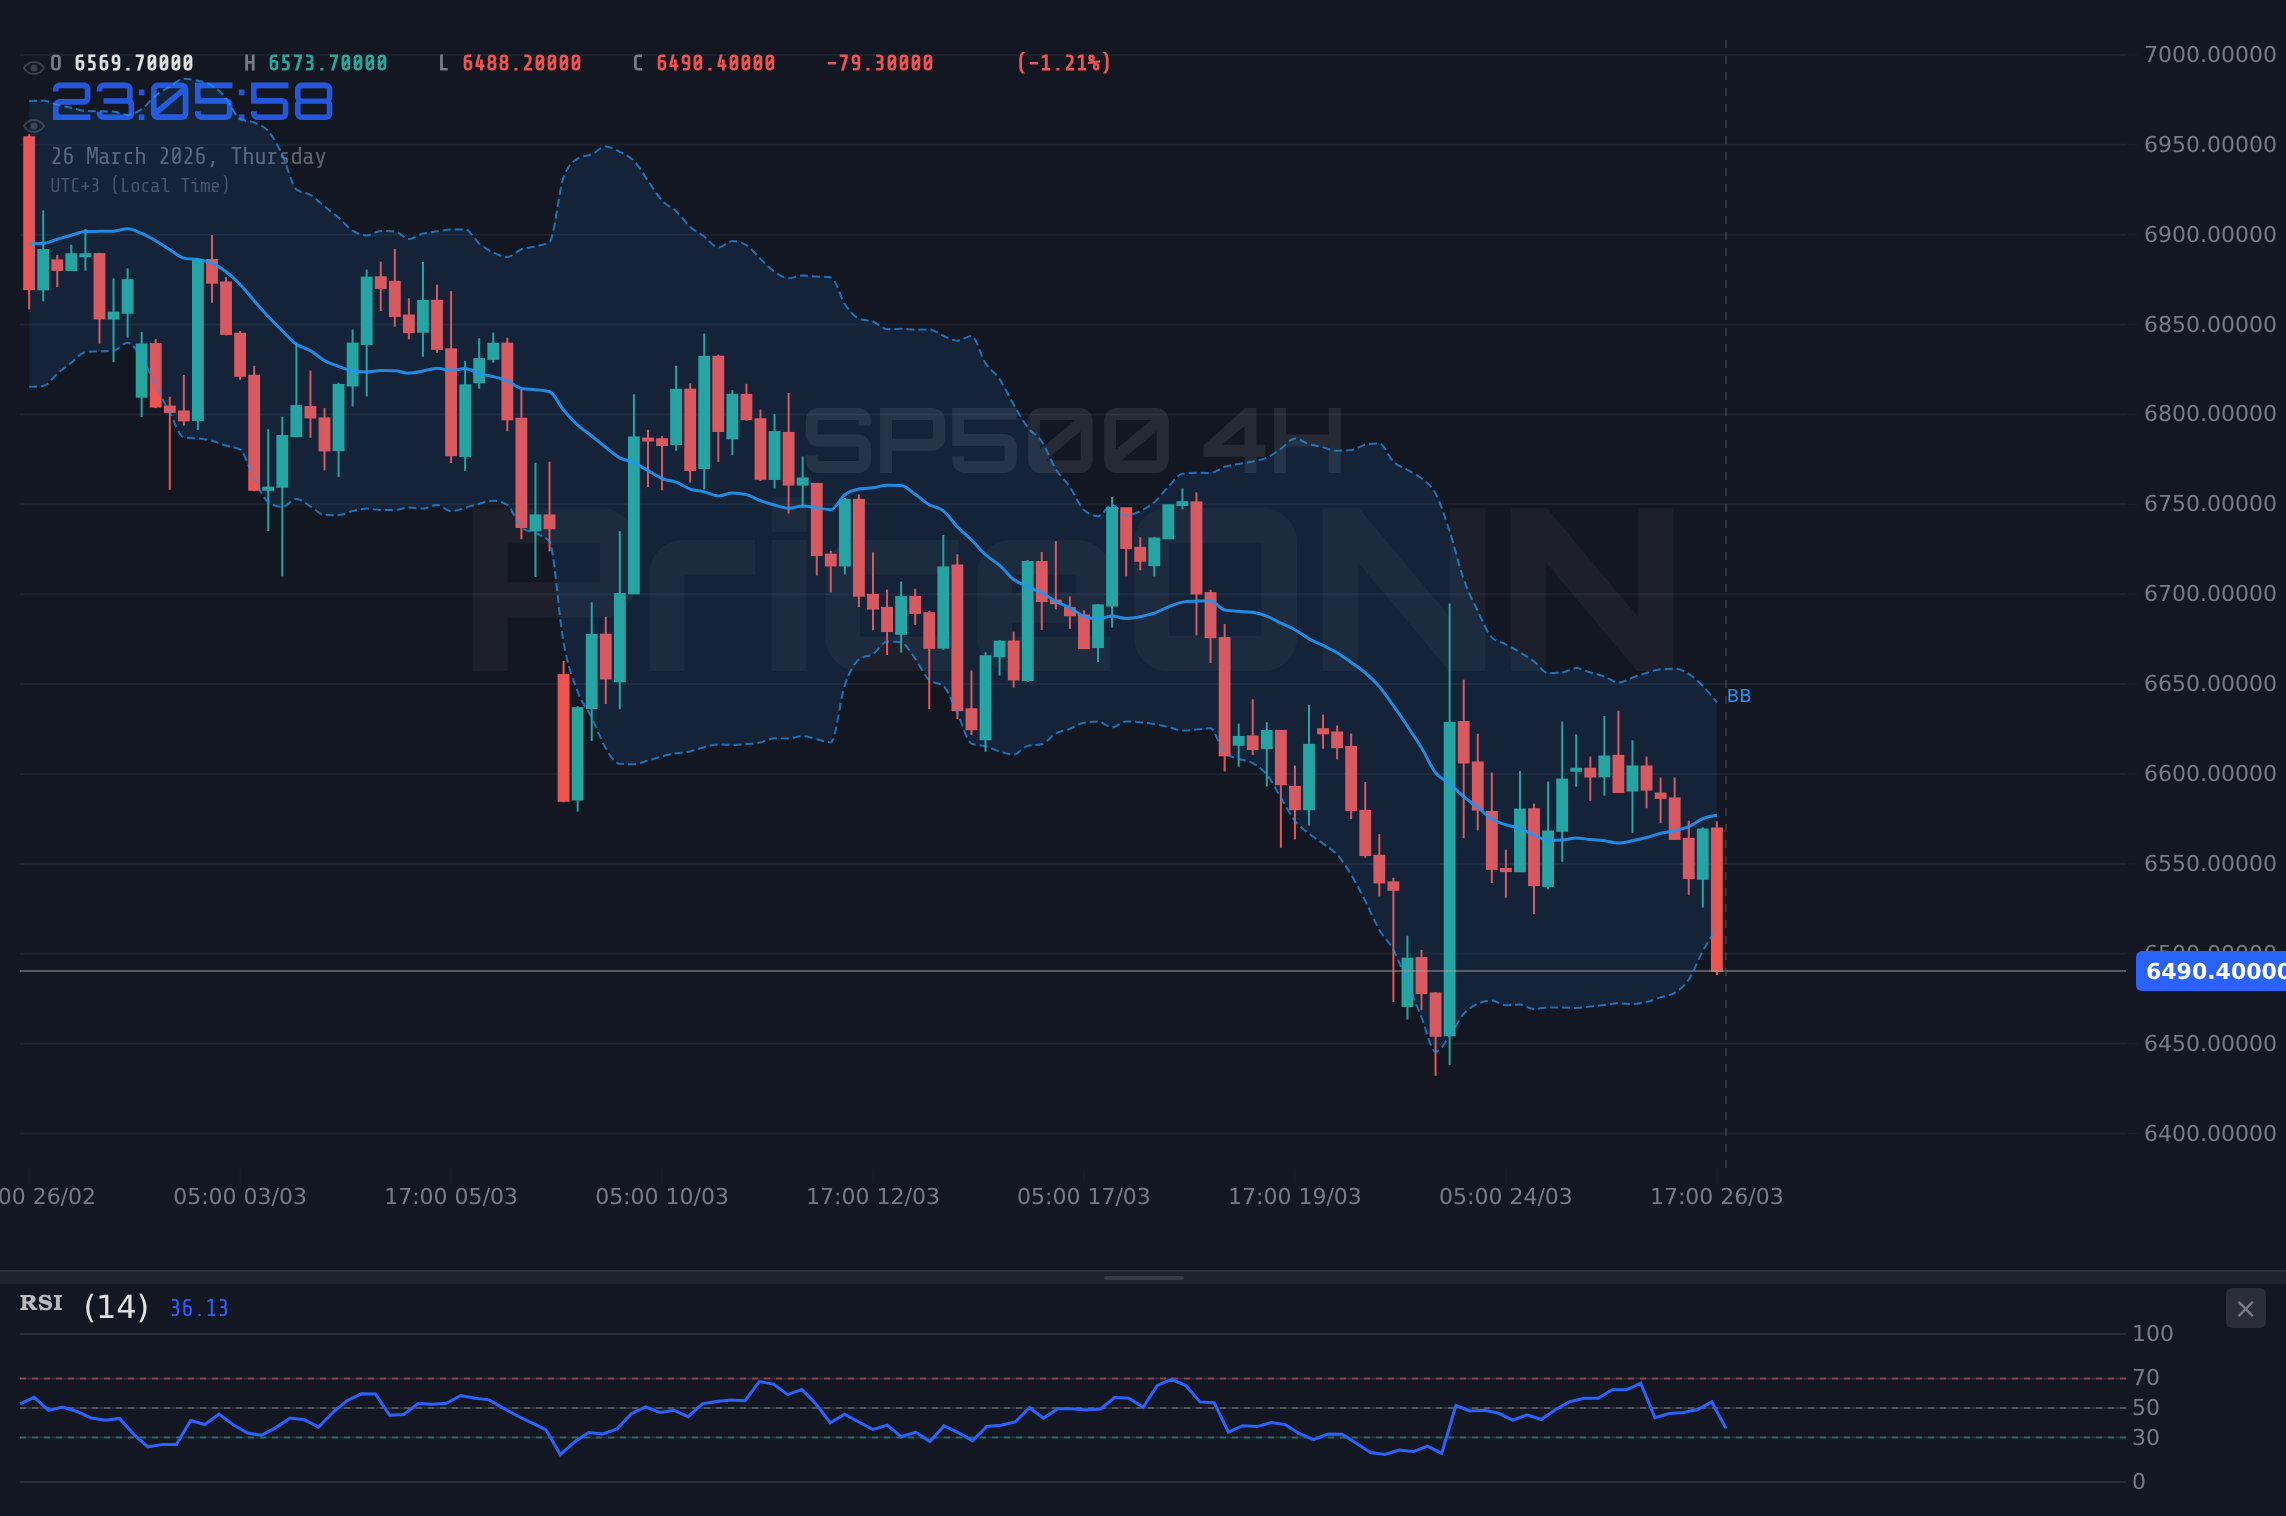
Technical Summary: A Mixed Bag with Bearish Leanings
The technical indicators present a mixed picture, but with a discernible bearish lean on the longer timeframes. On the 1-hour chart, the RSI at 28.91 and Stochastic readings deeply oversold suggest that the index is technically oversold and could be due for a short-term bounce. However, the MACD shows negative momentum, and the ADX at 24.48 indicates a moderate downtrend is in place. The 4-hour chart echoes this with oversold Stochastic and negative MACD momentum, while the ADX at 16.28 suggests a weak trend, potentially favoring consolidation or a bounce. The daily chart presents a more concerning outlook: RSI at 31.51 is also oversold, but the ADX is strong at 46.35, confirming a powerful downtrend. The MACD on the daily chart also shows negative momentum. This divergence between short-term oversold conditions and a strong daily downtrend suggests that any bounces might be corrective rather than indicative of a sustained trend reversal. Therefore, while a short-term bounce is possible, the overall technical structure favors further downside potential if key support levels fail.
The Path Forward: What to Watch
The immediate future of the S&P 500 will likely hinge on its ability to hold the $6,471.60 level and navigate the critical support at $6,479.53. A failure here could see a rapid descent towards $6,395.03. Conversely, a sustained push above $6,514.93, confirmed by rising volume and positive momentum, could signal a move towards $6,584.43. Key economic data releases, particularly inflation and employment figures, along with any significant geopolitical developments, will be the primary catalysts influencing market sentiment and direction. The Federal Reserve's communication will also remain a critical factor, shaping expectations around interest rate policy. Traders should remain vigilant, employing strict risk management protocols and waiting for clear signals before committing to new positions. The current environment demands patience and a data-driven approach, focusing on established levels and confirmed trends rather than speculation.
Bearish Scenario: The Downside Pressure Mounts
60% ProbabilityNeutral Scenario: Choppy Waters Ahead
30% ProbabilityBullish Scenario: A Potential Rebound
10% ProbabilityFrequently Asked Questions: S&P 500 Analysis
What happens if the S&P 500 breaks decisively below $6,479.53 support?
A close below $6,479.53 on the 1-hour chart would invalidate near-term bullish hopes and likely trigger further downside towards $6,395.03, confirming the bearish scenario. This would be driven by increasing risk aversion and potentially negative economic data.
Should I buy the S&P 500 at current levels around $6,471.60 given the RSI is 28.91?
Buying solely based on the oversold RSI at 28.91 without confirmation carries significant risk, given the strong daily downtrend (ADX 46.35). A more prudent approach would be to wait for a clear bullish signal, such as a confirmed break above $6,514.93, or a bounce with bullish divergence and increasing volume, before considering entry.
Is the RSI at 28.91 a sell signal for the S&P 500 right now?
An RSI of 28.91 typically indicates oversold conditions, suggesting a potential for a bounce rather than a sell signal. However, in a strong downtrend, RSI can remain oversold for extended periods. The overall bearish trend strength indicated by the ADX suggests caution against shorting based solely on this reading.
How will the upcoming economic data affect the S&P 500 this week?
Upcoming data like NFP and inflation figures will be critical. Stronger-than-expected data could either boost risk appetite (if seen as economic strength) or trigger fears of Fed tightening, leading to sell-offs. Weaker data might prompt a relief rally if it suggests a Fed pivot, or accelerate declines if it signals economic recession.
Track markets in real-time
AI-powered analysis, technical indicators and real-time price data.
Join Our Telegram Channel
Breaking market news, AI analysis and trading signals instantly.
Join Channel