Brent Crude Tests $106.34 Resistance Amid Inflation Fears; Price Now $107.18
Brent crude oil faces a critical test at the $106.34 resistance level as inflation concerns mount. Currently trading at $107.18, the market is watching for signs of a sustained move higher.
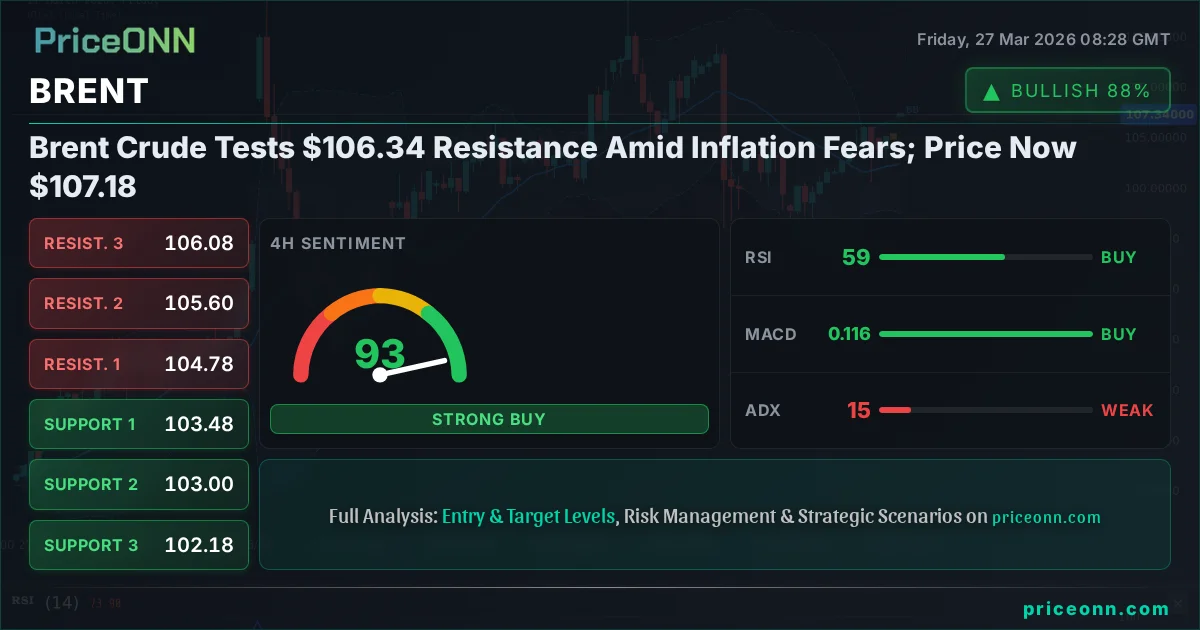
The global energy landscape is once again at a pivotal juncture. With Brent crude oil currently hovering around $107.18, the market is keenly observing its interaction with key resistance levels, particularly the $106.34 mark. This price point is more than just a number; it represents a critical barrier that, if breached decisively, could signal further upside momentum driven by persistent inflation fears and ongoing geopolitical tensions. The question on every trader's mind is whether the current bullish push, evidenced by a strong daily gain of 3.43% and a price surge of $3.56 to $107.18, has enough fuel to overcome this significant hurdle and continue its ascent.
- Brent crude is testing resistance at $106.34, with the current price at $107.18, indicating potential upside momentum.
- The daily chart shows a strong bullish trend (100% strength) with ADX at 62.43, suggesting significant upward force.
- Persistent inflation fears and geopolitical risks are key fundamental drivers supporting oil prices.
- Traders are watching the $106.34 level closely; a break above could target $109.05, while failure might lead to a retest of $100.77.
Geopolitical Tensions Fueling Energy Demand
The recent surge in Brent crude prices, pushing it to $107.18, is not occurring in a vacuum. The global geopolitical chessboard is increasingly volatile, creating a backdrop where energy supply stability is constantly under scrutiny. Reports highlighting recent drone attacks on tankers in the Black Sea and the persistent threat of a Strait of Hormuz blockade are significant factors contributing to market anxiety. These events directly impact the perceived risk premium associated with oil supply. When supply routes are threatened, even the potential for disruption is enough to drive prices higher, as traders price in the possibility of significant supply shocks. The US government's stress-testing of $200 oil prices, as reported, underscores the severity of these concerns and the potential for extreme price swings should major supply disruptions materialize. This heightened risk environment inherently supports higher energy prices, making it challenging for oil to retreat significantly despite other macroeconomic headwinds.
Inflationary Pressures Reinforce the Bull Case
Beyond immediate geopolitical flashpoints, the persistent specter of inflation continues to underpin the bullish narrative for commodities like Brent crude. While central banks worldwide grapple with managing inflation, the underlying drivers remain potent. Factors such as robust consumer demand, supply chain constraints that haven't fully resolved, and the increasing cost of energy itself create a feedback loop that keeps inflationary pressures elevated. The economic calendar shows mixed signals, but the overall trend suggests that inflation is proving to be more stubborn than anticipated. For oil, this means that even if demand were to moderate slightly, the inflationary environment itself provides a floor and a catalyst for price appreciation. As the price of oil rises, it directly contributes to higher transportation costs, manufacturing expenses, and ultimately, consumer prices, reinforcing the very inflation that supports its upward trajectory. This creates a complex dynamic where rising oil prices, while a symptom of inflationary pressures, also become a significant driver of future inflation.
The Role of Central Banks and Interest Rate Expectations
The monetary policy stance of major central banks, particularly the Federal Reserve and the European Central Bank, plays a crucial role in shaping the outlook for oil prices. While the immediate focus is often on inflation, the underlying interest rate environment is critical. If central banks are perceived to be behind the curve on inflation, or if market expectations shift towards a more hawkish stance (higher rates for longer), this can initially put pressure on risk assets. However, for commodities like oil, the situation is nuanced. High interest rates are intended to cool demand, which would theoretically reduce oil consumption. Yet, the current market seems to be prioritizing supply-side risks and the 'cost-push' inflation element driven by energy prices. The fact that Brent is trading at $107.18 despite potential tightening measures highlights the strength of the supply-side narrative. The market is currently pricing in a scenario where geopolitical supply disruptions and the inflationary impact of energy costs outweigh the demand-dampening effects of potential rate hikes. This suggests that until there is a clear resolution to supply-side risks or a significant shift in global demand, oil prices may remain resilient even in a higher-rate environment.
Technical Indicators: A Bullish Lean on the Daily Chart
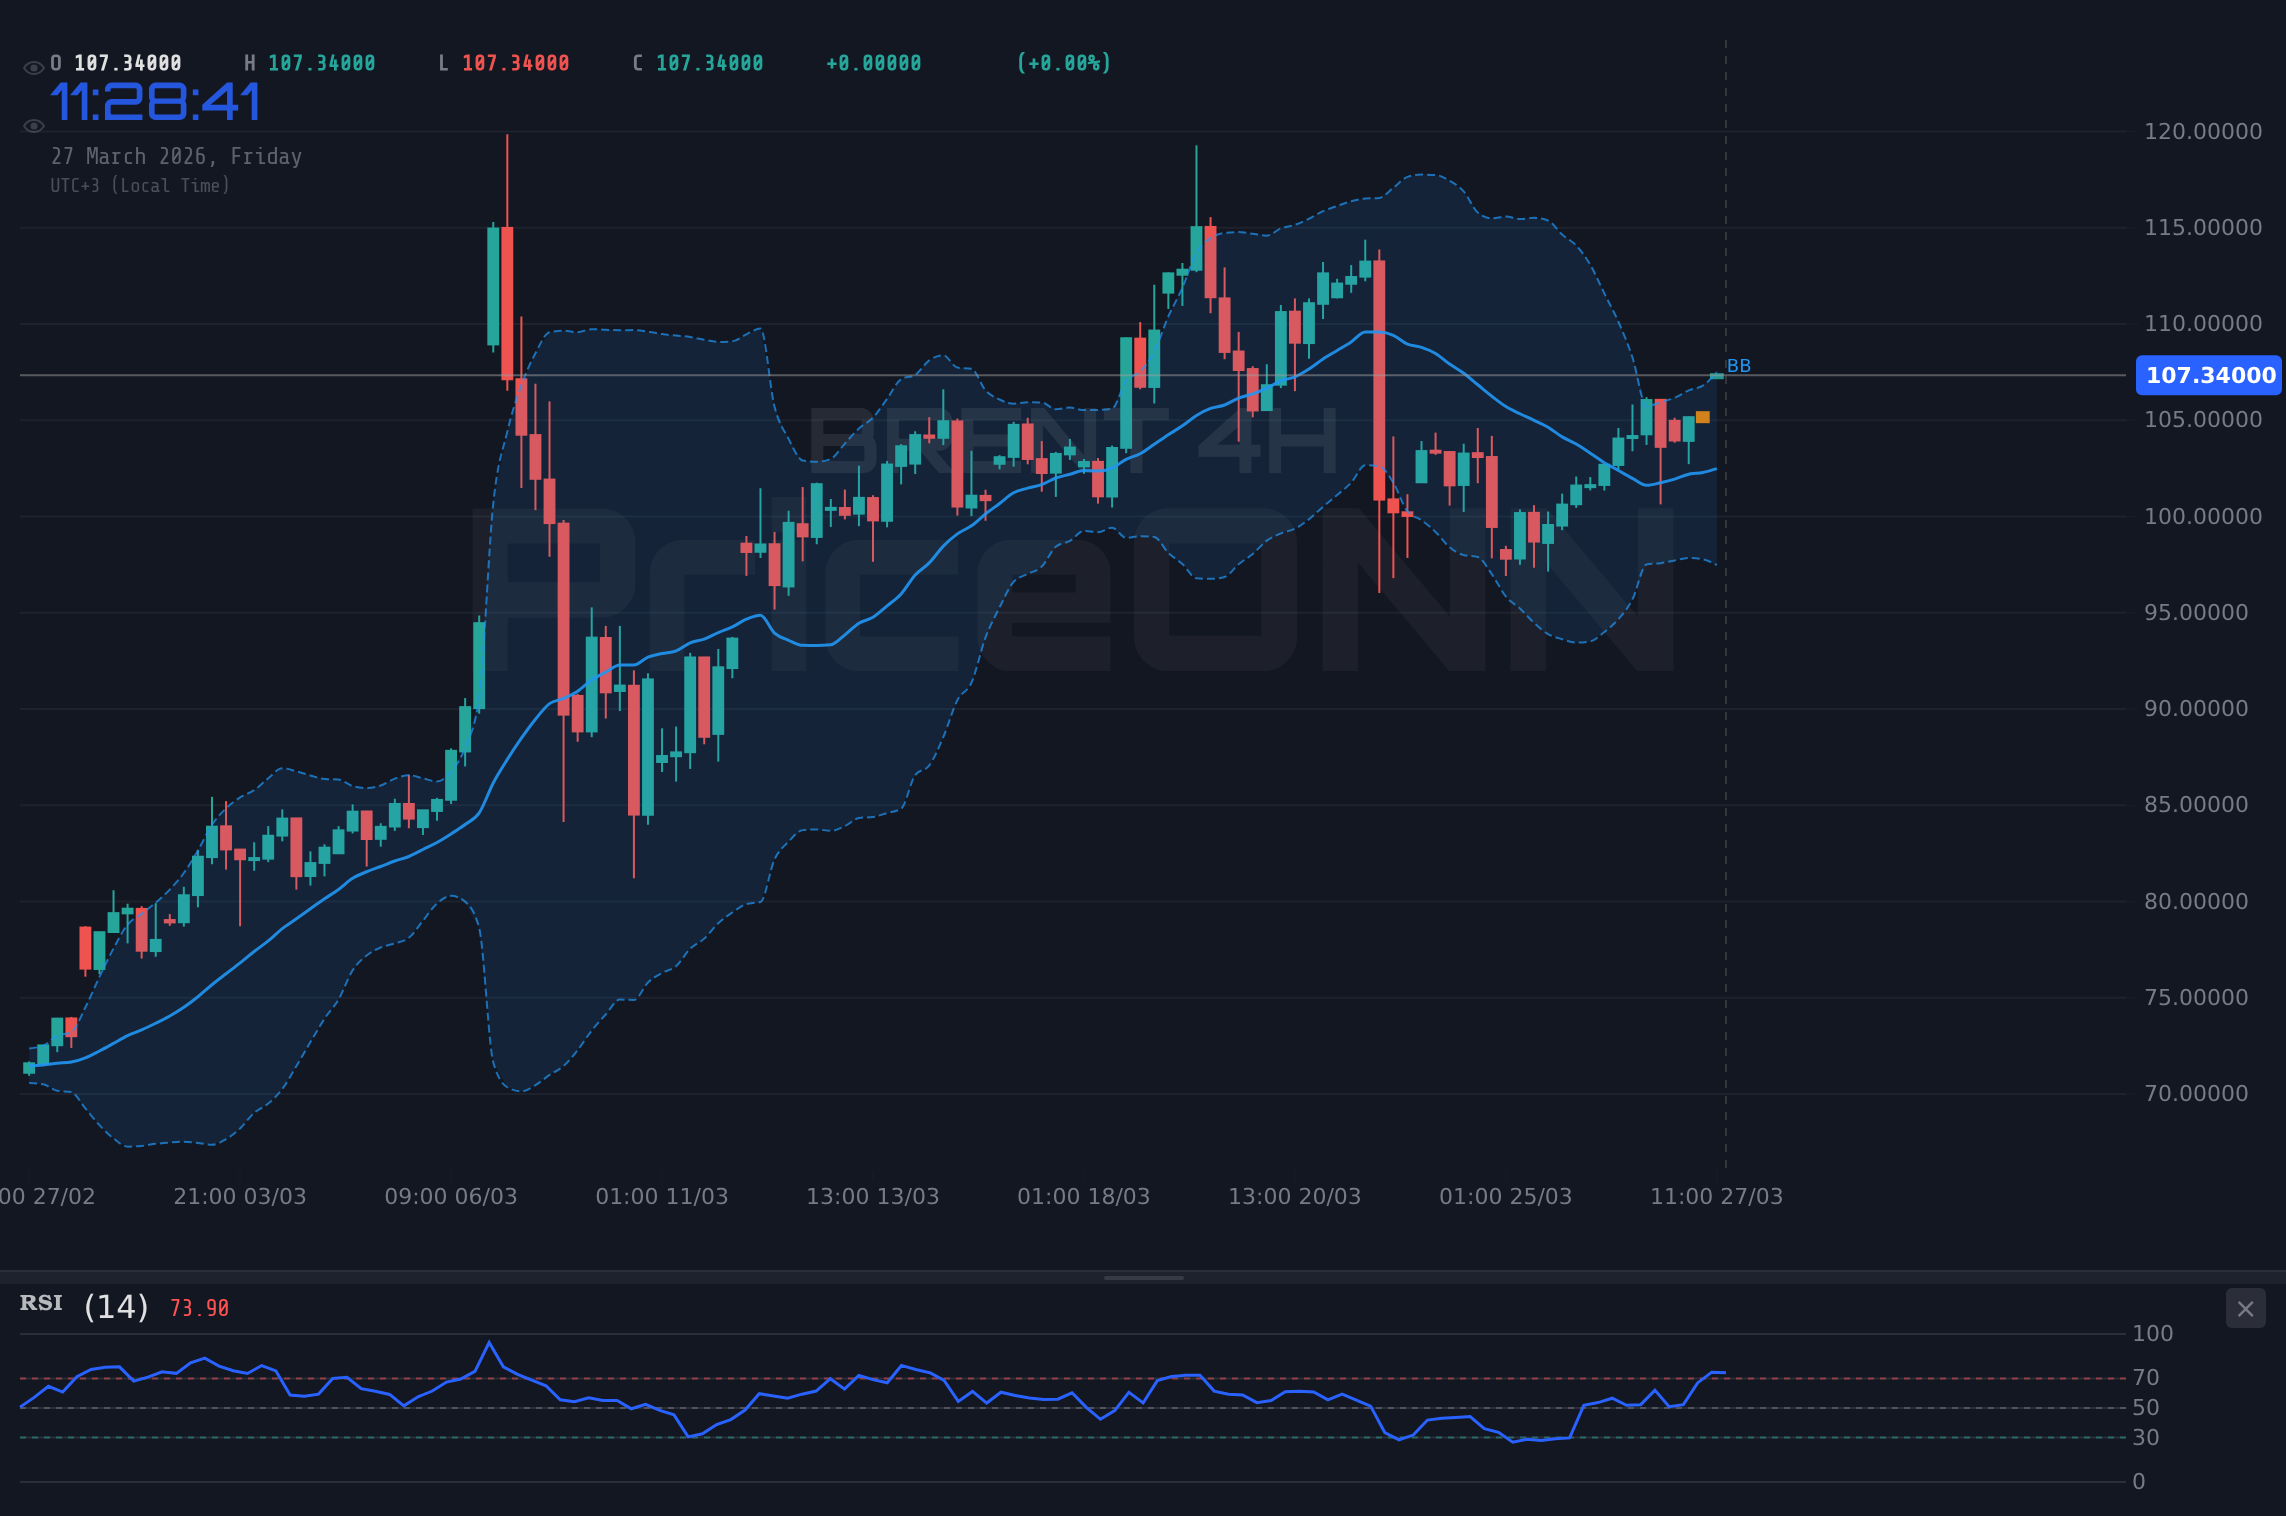
When we turn to the technical indicators for Brent crude, the daily timeframe paints a compelling, albeit nuanced, picture. The trend is unequivocally bullish, with a strength rating of 100% and an ADX reading of 62.43, indicating an extremely strong upward trend is in play. The Relative Strength Index (RSI) at 66.97, while not yet in overbought territory (typically considered above 70), shows strong upward momentum and suggests room for further gains. Similarly, the Stochastic Oscillator's K value at 34.86 and D value at 45.65 indicate a potential for a pullback or consolidation, but the overall trend support is robust. The MACD is showing positive momentum, suggesting that buyers are in control on this timeframe. The Bollinger Bands are positioned above the middle band, reinforcing the bullish sentiment. However, the 1-hour and 4-hour charts offer a more cautious perspective, showing neutral to weakening momentum, which suggests that any immediate push higher might face some consolidation or minor retracements before potentially resuming its upward trajectory. This divergence between timeframes is crucial for traders to consider when managing risk.
Navigating the $106.34 Resistance Level
The immediate focus for Brent crude traders is the resistance level at $106.34. This is not just a static line but a zone where selling pressure has historically emerged. Currently trading at $107.18, Brent has already surpassed this initial resistance. The question now is whether this breakout is sustainable or a 'fakeout'. The daily trend strength of 100% with a high ADX suggests conviction behind the move. However, the 1-hour chart's ADX of 25.1 and RSI at 69.8 hint at potential exhaustion or at least a need for consolidation. If Brent can hold above $107.18 and consolidate, it could build a base for a further advance. A decisive close above $107.18, especially with increasing volume, would be a strong signal. Conversely, a failure to hold current levels and a subsequent break below the $105.01 support on the 1-hour chart could signal a short-term reversal, potentially leading to a test of lower support levels such as $104.44 or even $100.77 on the daily chart. The interplay between the strong daily bullish trend and the more cautious signals on shorter timeframes creates a classic 'wait and watch' scenario for many market participants.
The Impact of Economic Data Releases
Looking ahead, upcoming economic data releases will be critical in shaping the trajectory of Brent crude prices. Key high-impact events for the US dollar, which often correlate inversely with oil prices, will be closely monitored. For instance, the upcoming release of PMI data (expected at 51.1 actual vs 52 forecast) and employment figures (actual 6.926 vs forecast -1.3) will provide insights into the health of the US economy. Stronger-than-expected data could suggest resilient demand, potentially supporting oil prices, while weaker data might raise concerns about economic slowdown, leading to price pressure. Similarly, any updates on inflation figures, such as CPI or PCE, will be paramount. If inflation proves more persistent, it could reinforce the bullish case for commodities as an inflation hedge, potentially driving Brent higher. Conversely, signs of cooling inflation might lead to expectations of central bank easing, which could initially weaken the dollar and support oil, or conversely, signal weakening demand. The market's reaction to these data points will be crucial in confirming or challenging the current bullish trend.
Correlations with Other Markets
Understanding Brent's price action requires considering its correlations with other major markets. The US Dollar Index (DXY) is a key indicator; currently at 99.78, it shows a strong upward trend on the daily chart (96% strength, ADX 31.79). Typically, a strengthening dollar puts downward pressure on dollar-denominated commodities like oil. However, in the current environment, the narrative seems to be shifting. Both the DXY and Brent are showing bullish strength, suggesting that global risk appetite and specific supply-side concerns are overriding the typical inverse correlation. This could indicate a broader inflationary theme or a 'risk-on' sentiment that benefits both the dollar and oil simultaneously, driven by factors like geopolitical risk and inflation hedging. Equity markets, such as the SP500 (currently at 6484.5) and Nasdaq (at 23610.56), are showing a bearish trend on the daily charts, indicating a potential 'risk-off' sentiment. If this risk-off sentiment intensifies, it could theoretically lead to a pullback in oil prices as investors reduce exposure to riskier assets. However, the strong bullish trend in Brent, coupled with its status as a potential inflation hedge, might allow it to remain resilient or even benefit from safe-haven flows if geopolitical tensions escalate further, creating a complex interplay of market forces.
Scenario Analysis: What's Next for Brent?
Bullish Scenario: Sustained Momentum
65% ProbabilityConsolidation Scenario: Choppy Price Action
25% ProbabilityBearish Scenario: Resistance Holds Firm
10% ProbabilityThe Path Forward: Watchful Optimism
Brent crude oil is at a critical juncture, trading at $107.18 and testing key resistance at $106.34. The daily technicals present a strong bullish picture, supported by persistent geopolitical risks and inflationary pressures that continue to drive demand for commodities as a hedge. However, caution is warranted given the divergence in signals from shorter timeframes and the potential for macroeconomic factors to shift the narrative. Traders must remain vigilant, watching for clear confirmation of a sustained move above current levels or signs of a reversal. The upcoming economic data releases will be pivotal in providing further clarity.
Frequently Asked Questions: BRENT Analysis
What happens if Brent crude breaks decisively above the $107.18 level?
A sustained break above $107.18, particularly with strong volume, would likely target the next daily resistance level at $109.05. This would confirm the bullish trend, driven by ongoing supply concerns and inflation hedging. The ADX at 62.43 on the daily chart supports this potential continuation.
Should I buy Brent at current levels of $107.18 given the RSI is at 66.97?
Buying at $107.18 carries some risk as the RSI is approaching overbought territory on the daily chart, and shorter timeframes show weaker momentum. A more prudent approach might be to wait for consolidation or a clear break above $107.18 with confirmation, or to enter on a dip towards the $105.01 support level, targeting a higher move with defined risk.
Is the ADX at 62.43 a strong buy signal for Brent crude?
An ADX of 62.43 on the daily chart indicates an extremely strong trend, which is bullish for Brent crude. However, it also suggests the trend is mature and could be nearing exhaustion or a period of consolidation. While it confirms the current strength, traders should look for other indicators and price action for precise entry timing rather than relying solely on the high ADX.
How will upcoming US economic data affect Brent crude prices this week?
Upcoming data like PMI and employment figures will be crucial. Stronger-than-expected data could boost demand expectations, supporting Brent's rise towards $109.05. Weaker data might signal an economic slowdown, increasing the probability of a bearish scenario where Brent tests support at $100.77.
Track markets in real-time
AI-powered analysis, technical indicators and real-time price data.
Join Our Telegram Channel
Breaking market news, AI analysis and trading signals instantly.
Join Channel