WTI Oil Tests Key Resistance Near $95.46 Amid Inflation Fears and Geopolitical Tensions
WTI crude oil faces resistance at $95.46 as inflation concerns and geopolitical risks escalate, impacting the broader energy market and USD correlation.
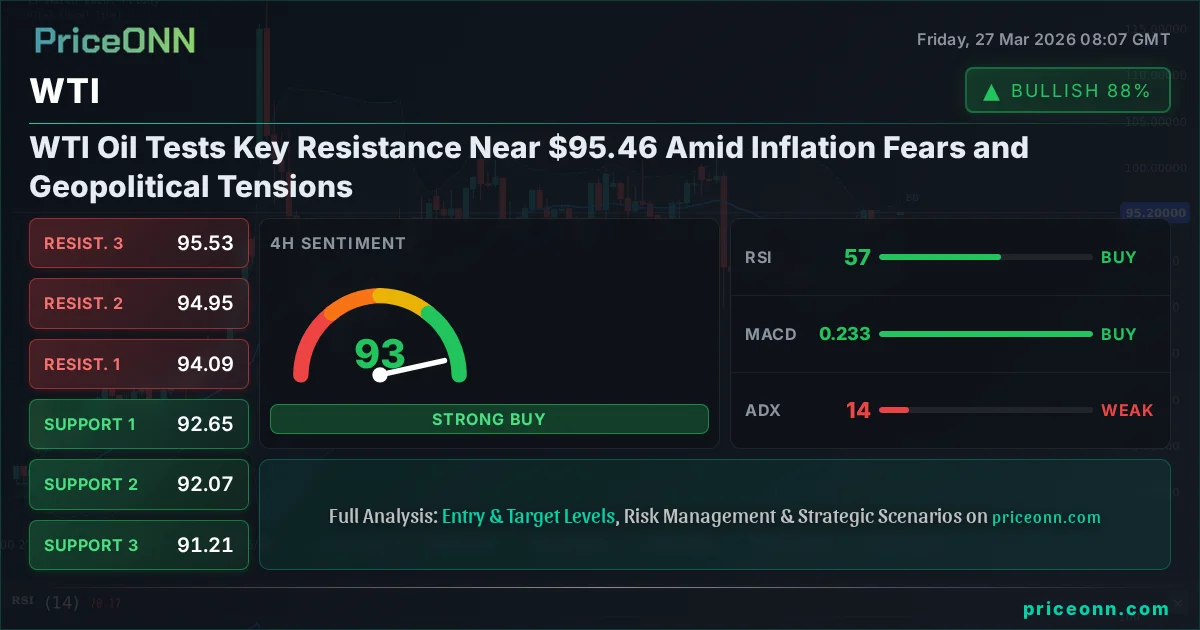
The global energy landscape is currently a complex tapestry woven with threads of rising inflation, simmering geopolitical tensions, and the ever-present influence of central bank policy. At the heart of this intricate market, WTI crude oil is finding itself at a critical juncture, currently trading around the $95.46 mark. This price point is not just a number; it represents a significant resistance level that traders and analysts are watching with intense scrutiny. The question on everyone's mind is whether WTI has the momentum to break through this barrier or if it will retreat, potentially signaling a shift in the broader market sentiment towards risk aversion.
- WTI crude oil is currently trading at $95.46, facing resistance near this level.
- The ADX indicator at 23.84 on the 1H chart suggests a medium-strength trend, but the 1D ADX at 56.92 signals a very strong uptrend, creating a conflict worth monitoring.
- Geopolitical tensions in the Black Sea and Strait of Hormuz, alongside escalating war risk, are pushing oil prices higher, with the US government stress-testing $200 oil scenarios.
- The DXY is at 99.81, indicating dollar strength which typically puts pressure on commodities like oil, yet WTI is showing bullish momentum, suggesting other factors are currently dominating.
- Upcoming economic data, particularly from the US and EUR, will be crucial in determining the next direction for WTI.
The current price action in WTI is a fascinating case study in how multiple macroeconomic and geopolitical forces can coalesce to create significant market movements. As of the latest data, WTI is hovering around $95.46, a level that has historically acted as a ceiling. This resistance is being tested at a time when inflation concerns are once again taking center stage. The latest US economic data, with a PMI reading of 52.4 (above forecast) and a preliminary figure of 51.1 for another indicator, suggests underlying economic activity that could fuel demand for energy. However, the actual figures for some other USD-related economic events were slightly below expectations, creating a mixed signal. This data landscape inherently makes the market's reaction to WTI's price action even more compelling.
The Macroeconomic Undercurrents Driving Oil Prices
Understanding the price of WTI today requires a deep dive into the macroeconomic environment. The specter of inflation looms large, and oil prices are a significant contributor to this concern. When oil prices rise, the cost of transportation and energy increases across the board, feeding into broader inflation metrics. The US government's stress-testing of a $200 per barrel oil price scenario, as reported recently, underscores the gravity of this situation. This proactive measure highlights the potential economic shockwaves that a sustained surge in oil prices could unleash, from impacting consumer spending to disrupting supply chains. The implications for central bank policy, particularly the Federal Reserve, are profound. If inflation continues to be sticky, the Fed might be forced to maintain a hawkish stance or even consider further tightening, which could, in turn, influence the dollar's strength and, consequently, commodity prices.
The Dollar Index (DXY) is currently trading at 99.81, showing a strengthening trend. Historically, a stronger dollar tends to make dollar-denominated commodities like oil more expensive for holders of other currencies, thus potentially dampening demand and putting downward pressure on prices. However, the current WTI rally, despite the DXY's upward movement, suggests that other factors are currently outweighing this inverse correlation. Geopolitical risks appear to be the dominant force. Recent reports highlight increased tensions in the Black Sea and the threat of a Strait of Hormuz blockade. Such events have a direct and immediate impact on global oil supply stability, creating a 'risk-on' sentiment specifically within the energy markets, even if broader market sentiment is leaning towards 'risk-off'. This divergence is a key element to watch.
Geopolitical Storm Clouds Gathering Over Oil Supply
The geopolitical narrative surrounding oil prices cannot be overstated. Recent drone attacks in the Black Sea and the ongoing closure of the Strait of Hormuz are not isolated incidents; they represent significant threats to the stability of global oil supply. The Strait of Hormuz, a critical chokepoint through which a substantial portion of the world's oil supply transits, being under threat immediately sends ripples of concern through the market. This heightened risk premium is a primary driver behind the current upward pressure on WTI and Brent crude. When supply routes are perceived to be at risk, even a minor disruption can lead to a significant price jump as traders and consumers scramble to secure existing supplies and anticipate future shortages.
The US government's stress-testing of $200 oil prices is a stark indicator of how seriously these geopolitical risks are being taken. This scenario modeling suggests that policymakers are preparing for the possibility of severe supply shocks. Such preparations themselves can influence market psychology, as the very act of planning for extreme price levels can, paradoxically, contribute to price volatility. The interplay between actual supply disruptions and the market's anticipation of future ones creates a dynamic environment where prices can move sharply based on headlines and perceived threats. This is a key reason why fundamental analysis in the energy sector must always incorporate a thorough understanding of global political developments.
Technical Indicators: Conflicting Signals Amidst Strong Trends
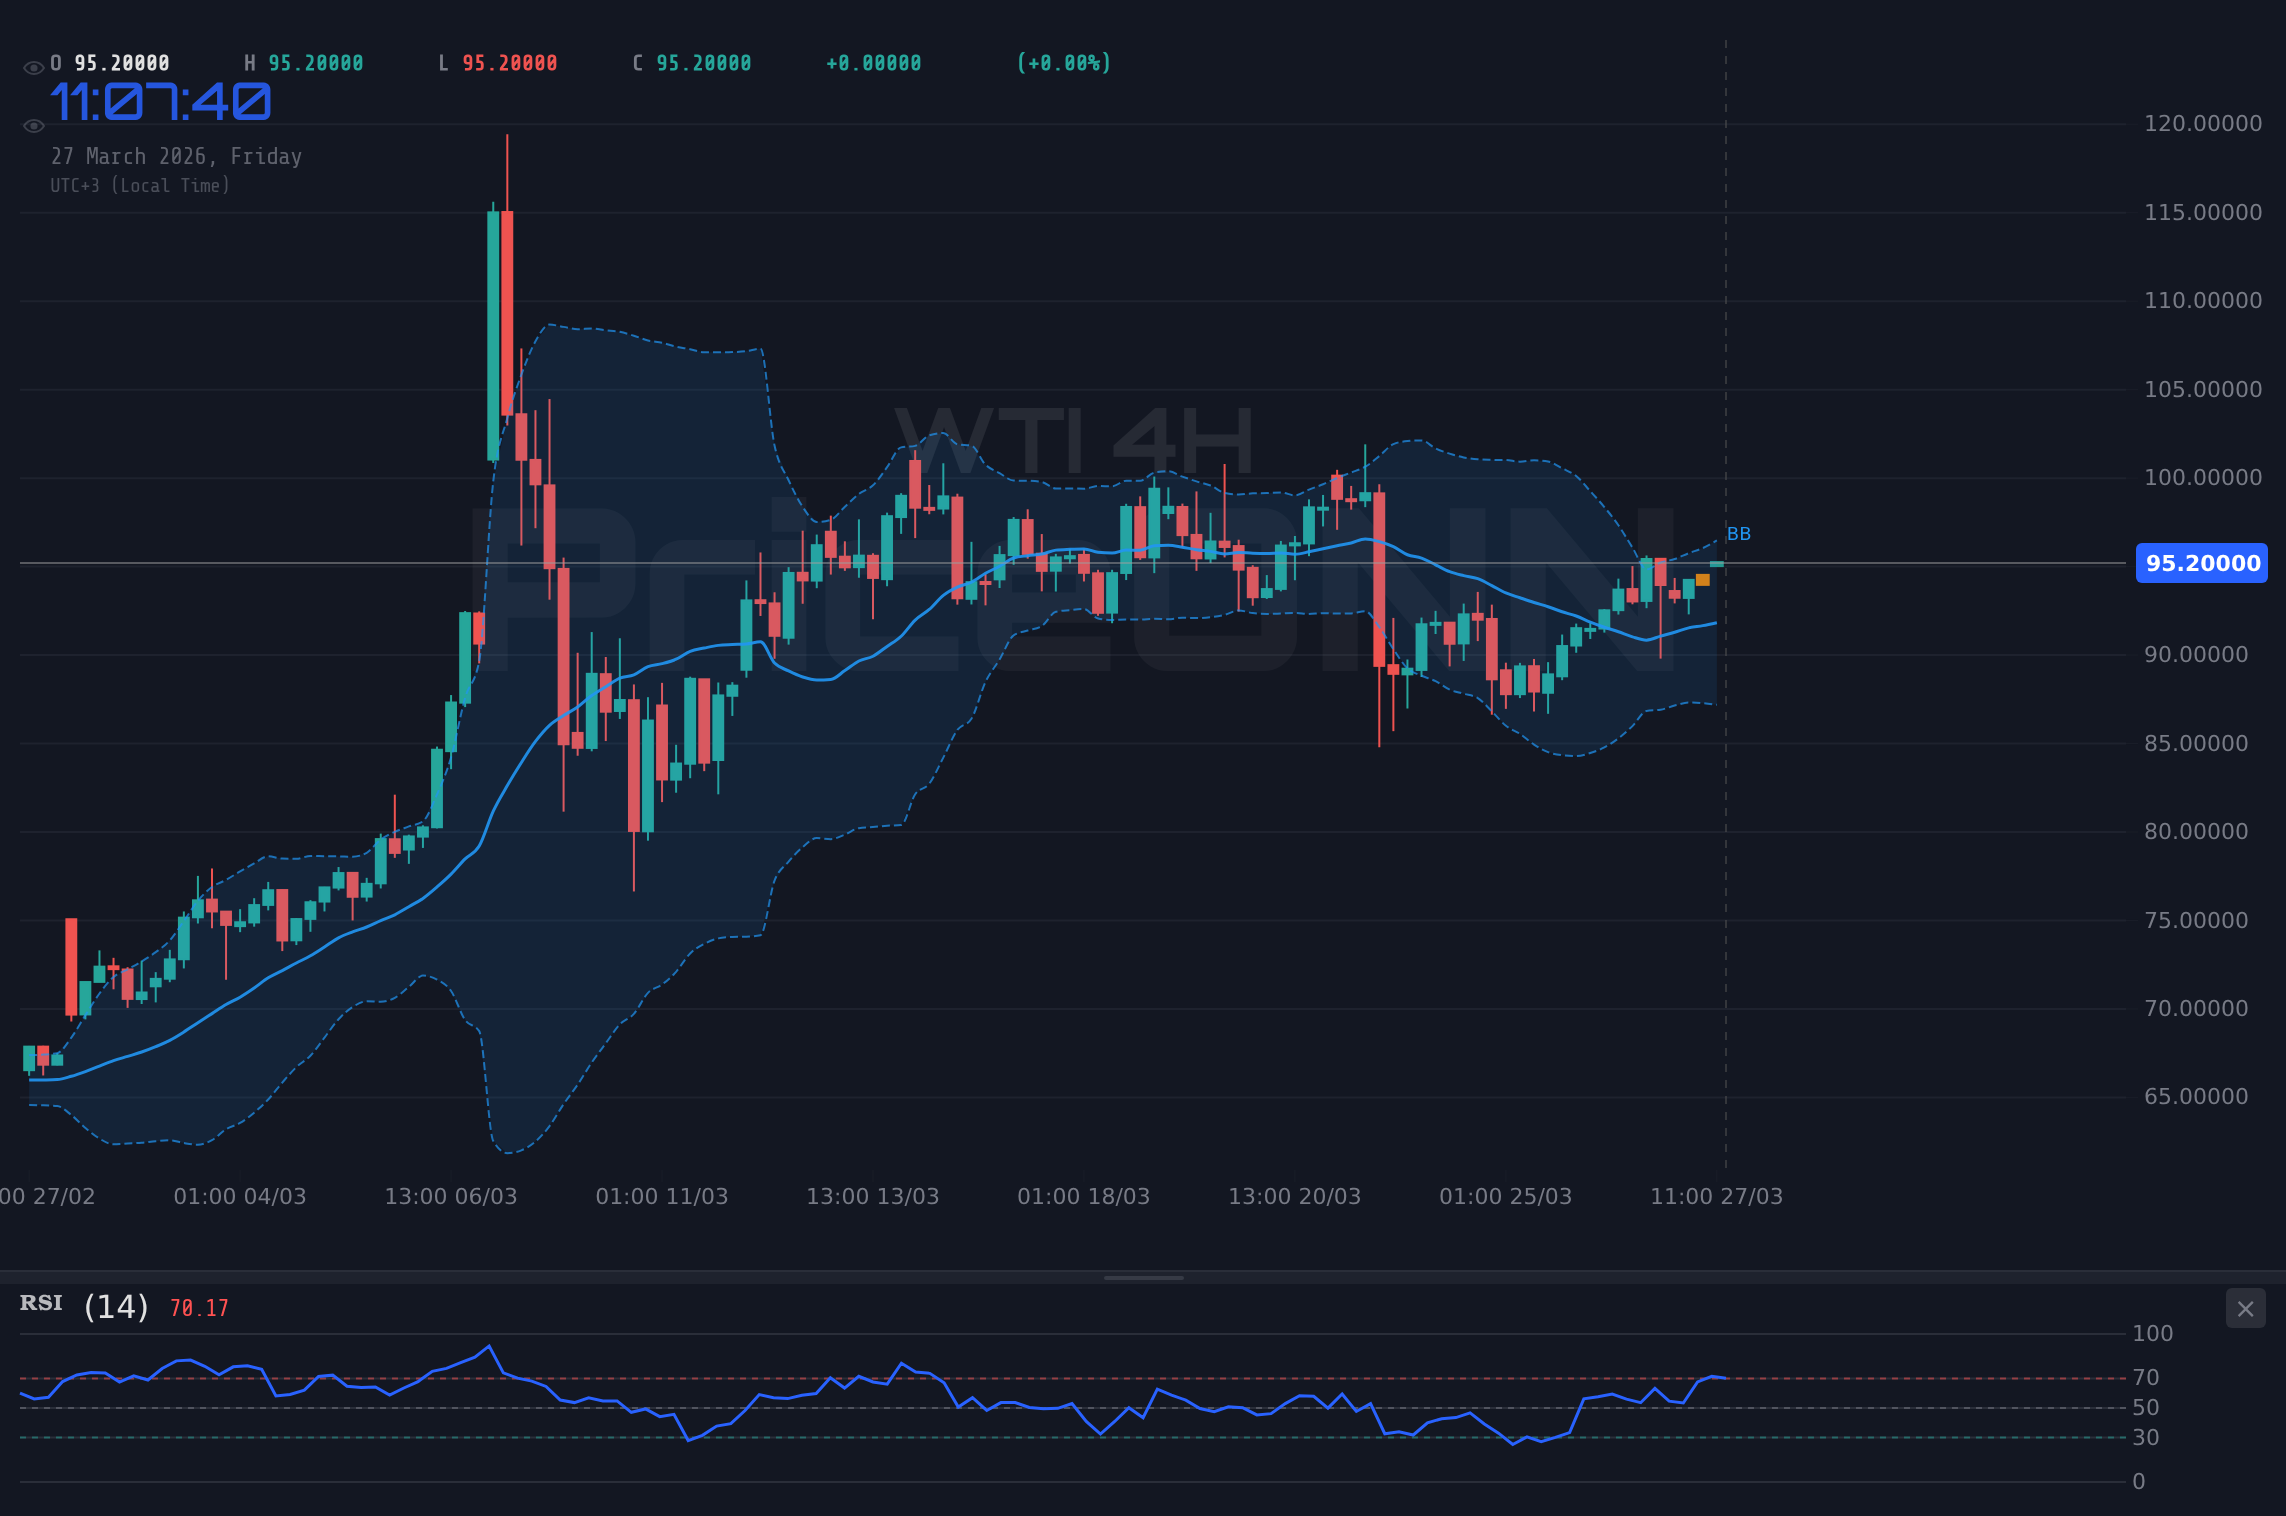
While the macroeconomic and geopolitical backdrop provides the 'why', technical indicators offer the 'how' and 'when' for trading decisions. On the 1-hour chart, WTI shows a neutral trend with moderate strength (ADX 23.84). The RSI is at 64.18, indicating a bullish tendency within the neutral zone, while the Stochastic K line at 94.41 and D line at 78.13 suggest an overbought condition, signaling potential for a pullback. The MACD is showing negative momentum on this timeframe, which contradicts the RSI. This conflict between indicators on the shorter timeframe suggests a lack of clear direction, despite the overall bullish price action.
However, the picture changes dramatically when we shift to the daily (1D) timeframe. Here, the trend is decisively bullish, with a very strong ADX reading of 56.92. This indicates a robust, established uptrend. The RSI at 62.88 is in the upper neutral zone, still showing room for upward movement before becoming extremely overbought. The Stochastic K (51.72) and D (48.09) lines are showing a bullish crossover, reinforcing the upward momentum. The MACD is displaying negative momentum, which is a point of divergence, but the strong ADX and bullish stochastic suggest the trend might override this. The Bollinger Bands on the daily chart are above the middle band, also supporting the bullish outlook. This confluence of a strong daily trend, with some shorter-term indicators flashing caution, presents a classic scenario where longer-term trends often dictate price action.
The conflict between the 1-hour and 1-day technical signals is precisely where a seasoned trader earns their keep. The 1-hour chart's neutral trend and overbought Stochastic might tempt some to look for a short-term sell-off. However, the powerful uptrend indicated by the daily ADX and Stochastic crossover suggests that any short-term weakness could be a buying opportunity for those playing the longer game. The key is to understand which timeframe's signals are currently dominating market sentiment. Given the strength of the daily trend indicators, it's more probable that the longer-term picture will prevail, and any dips might be viewed as accumulation phases rather than the start of a reversal.
Economic Calendar: Key Events to Watch
Looking ahead, the economic calendar is packed with high-impact events that could significantly sway WTI prices. Several USD-related releases are on the horizon, including PMI figures. The preliminary US PMI reading of 51.1, while slightly below the forecast of 52, is still in expansionary territory. However, the actual figure of 52.4 for another economic indicator, surpassing the forecast of 51.5, suggests underlying strength. These data points are critical for gauging the health of the US economy, the world's largest consumer of energy. Stronger-than-expected economic data could fuel demand expectations, pushing oil prices higher, while weaker data might signal a slowdown, capping any upward momentum.
Furthermore, the GBP economic calendar shows a consistent figure of 3 for a key release, which was in line with forecasts. While this doesn't introduce new volatility, it removes one variable from the equation for GBP-related currency pairs, indirectly affecting cross-currency oil trades. The USD also had a significant release where the actual figure of 6.926 came in below the forecast of -1.3, indicating a contraction in a specific economic metric. This could be interpreted as a slight headwind for the dollar, potentially offering some relief to commodity prices. The market will also be keenly watching for any hints from the Federal Reserve regarding future interest rate policy, as this will directly impact the DXY and, by extension, WTI.
Correlations and Divergences: DXY, Equities, and Oil
The relationship between WTI, the US Dollar Index (DXY), and major equity indices like the S&P 500 and Nasdaq provides crucial context. Currently, the DXY is at 99.81, showing strength. Typically, a stronger dollar acts as a headwind for oil prices. However, WTI is exhibiting a bullish trend, indicating that other factors, such as geopolitical risks and supply concerns, are currently overriding the typical inverse correlation. This divergence is a significant signal for traders, suggesting that the usual playbook might not apply in the current environment.
Similarly, the performance of the S&P 500 (currently at 6494.1) and Nasdaq (at 23655.44) offers insights into market risk appetite. Both indices are showing mixed signals on shorter timeframes but a predominantly bearish trend on the daily charts (S&P 500 ADX 47.12, Nasdaq ADX 44.68). A general risk-off sentiment in equities often leads to increased demand for safe-haven assets and can put pressure on riskier commodities like oil. Yet, WTI is defying this trend, likely due to the specific supply-side pressures it faces. This decoupling between equity market sentiment and oil prices highlights the unique drivers currently at play in the energy sector.
Navigating the Volatility: Scenarios for WTI
Given the confluence of strong bullish technicals on the daily chart, conflicting signals on shorter timeframes, elevated geopolitical risks, and mixed macroeconomic data, several scenarios are plausible for WTI. The current price of $95.46 represents a crucial resistance point. A break above this level, particularly with strong volume and confirmed by positive macroeconomic indicators, could signal a continuation of the bullish trend. The targets would then be the next significant resistance levels, potentially pushing towards the $100 mark if market sentiment remains strongly bullish and supply concerns persist.
Conversely, failure to break above $95.46, coupled with a renewed strengthening of the DXY or a significant escalation in risk aversion across broader markets, could lead to a pullback. The support levels at $94.81 and $94.09 would then become targets. A break below these levels, especially if accompanied by a shift in geopolitical risk perception or a dovish turn from the Fed, could signal a more significant correction. Traders will be closely watching the interplay between these technical levels and the fundamental catalysts driving the market.
Bearish Scenario: Retreat from Resistance
65% ProbabilityBullish Scenario: Breakout Confirmation
25% ProbabilityConsolidation Scenario: Range-Bound Action
10% ProbabilityFrequently Asked Questions: WTI Analysis
What happens if WTI breaks above the $95.46 resistance level?
A confirmed break above $95.46, especially with increasing volume and positive geopolitical news, could signal a continuation of the bullish trend. Target 1 would be $96.46, followed by $98.00, as market sentiment shifts towards further upside potential.
Should I buy WTI at current levels of $95.46 given the conflicting signals?
Buying at current resistance levels is generally not advised. A more prudent approach would be to wait for a confirmed breakout above $95.46 or a pullback to a key support level like $94.09, where a better risk-reward ratio might be established. Patience is key.
Is the ADX at 56.92 on the daily chart a sell signal for WTI?
An ADX of 56.92 on the daily chart signifies a very strong trend, which is currently bullish for WTI. While high ADX values can sometimes indicate an overextended market, they primarily confirm the strength of the existing trend rather than signaling a reversal on their own. It reinforces the bullish narrative.
How will upcoming US economic data affect WTI this week?
Stronger-than-expected US economic data, such as PMI figures, could boost demand expectations for oil, potentially pushing WTI above $95.46. Conversely, weaker data might reinforce dollar strength and cap oil's upside, leading to a test of support levels around $94.09.
Technical Outlook Summary
| Indicator | Value | Signal | Interpretation |
|---|---|---|---|
| RSI (14) | 62.88 | Neutral | Upper neutral zone, still room to rise but watch for overbought conditions. |
| MACD Histogram | -0.15 | Bearish | Negative momentum on daily chart, potential divergence with price trend. |
| Stochastic | K:51.72, D:48.09 | Bullish | Bullish crossover in neutral zone, reinforcing upward momentum. |
| ADX | 56.92 | Bullish | Very strong uptrend confirmed on daily chart. |
| Bollinger Bands | Above Middle Band | Bullish | Price trading above the middle band indicates bullish bias. |
Key Levels
Track markets in real-time
AI-powered analysis, technical indicators and real-time price data.
Join Our Telegram Channel
Breaking market news, AI analysis and trading signals instantly.
Join Channel