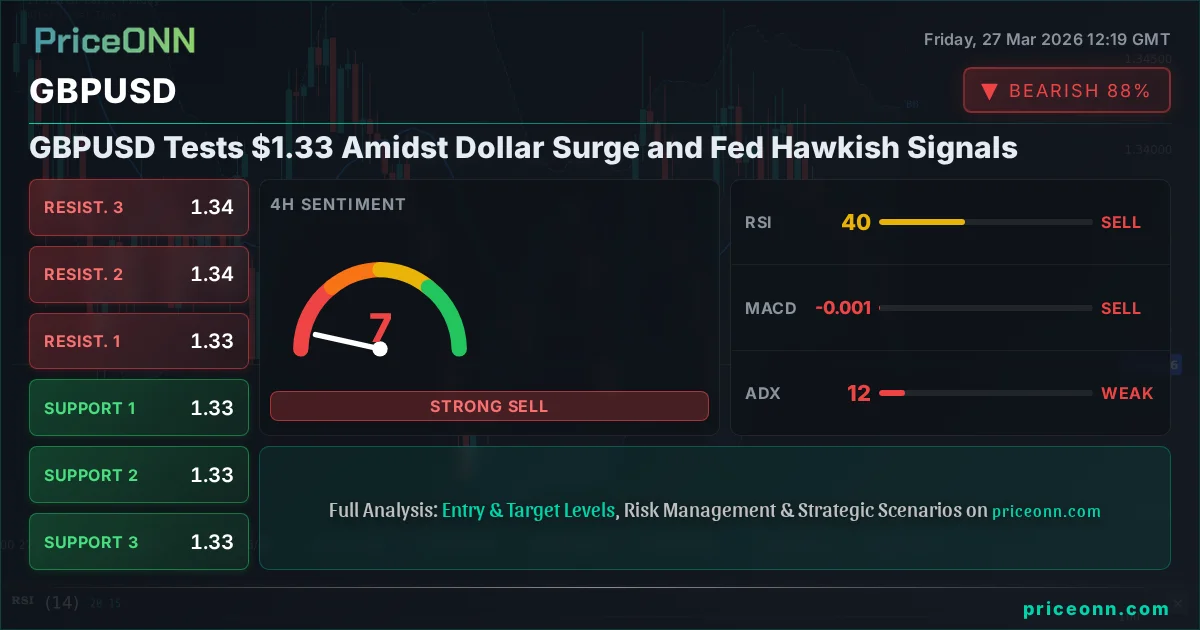
GBPUSD Tests $1.33 Amidst Dollar Surge and Fed Hawkish Signals
GBPUSD struggles near $1.33 as the DXY index climbs and Fed officials hint at renewed inflation focus. Key levels to watch: R1 $1.3367, S1 $1.3299.
Is the current dip in GBPUSD a temporary pause or the start of a deeper decline? With the pair hovering precariously around the $1.33 psychological level, investors are grappling with a potent mix of a strengthening US Dollar and renewed hawkish rhetoric from Federal Reserve officials. The Dollar Index (DXY) has been on an impressive run, nearing the 99.90 mark, a move that typically spells trouble for riskier assets and major currency pairs like the British Pound against the US Dollar. This isn't just a technical play; it's deeply rooted in macroeconomic fundamentals and shifting global risk sentiment. The question on everyone's mind is whether this pressure on GBPUSD is sustainable or if there are underlying factors that could spark a reversal.
- GBPUSD is trading near $1.33, pressured by a surging DXY to 99.90.
- Critical support for GBPUSD sits at $1.3299, tested multiple times this week.
- The 1H RSI at 27.34 indicates extreme oversold conditions, suggesting a potential short-term bounce.
- Fed rate hike expectations are rising, correlating with DXY strength and weighing on GBPUSD.
The Dollar's Ascent: A Multi-Faceted Strength
The US Dollar's recent rally is not a single-factor phenomenon. Several converging forces are at play, creating a robust environment for USD strength. Firstly, the persistent inflation concerns, despite some cooling in certain metrics, are keeping the Federal Reserve on a hawkish footing. Recent comments from Fed officials, as reported by Bloomberg, suggest a renewed focus on inflation risks, hinting that the era of easy money might be far from over. This is directly impacting interest rate expectations. While the market is always pricing in various scenarios, the narrative is shifting back towards potential rate hikes or at least a prolonged period of higher-for-longer rates, which naturally supports the dollar. The CME FedWatch tool, though not explicitly detailed here, reflects this sentiment shift, influencing Treasury yields and, consequently, the DXY. With the DXY currently trading around 99.92, this upward momentum is a significant headwind for GBPUSD.
Secondly, global uncertainty continues to be a significant driver for safe-haven assets, and the US Dollar remains the ultimate safe haven. Geopolitical tensions, as highlighted by recent news citing escalating conflicts and cyber threats, are pushing investors towards perceived safety. This risk-off sentiment is palpable across markets, leading to a flight to quality. When global markets become volatile, capital tends to flow into dollar-denominated assets, increasing demand for the greenback. The correlation is clear: as global risk appetite wanes, the DXY tends to climb, putting pressure on pairs like GBPUSD, EURUSD, and XAUUSD. The market's reaction to these macro events is often immediate and pronounced, creating a challenging environment for currency pairs that are sensitive to risk sentiment.
Finally, the relative economic performance between the US and other major economies, particularly the UK and the Eurozone, plays a crucial role. While the US economy shows resilience, albeit with inflation concerns, the outlook for other regions can be more mixed. This divergence in economic fortunes, coupled with the Fed's proactive stance on inflation, creates a yield advantage for the dollar, attracting foreign investment and further bolstering its value. This fundamental backdrop provides a solid foundation for the dollar's strength, making it a formidable opponent for the British Pound.
GBPUSD: Caught in the Crossfire
The British Pound is finding itself in a precarious position, caught between the relentless advance of the US Dollar and its own domestic economic considerations. The current price of GBPUSD at $1.33 reflects this struggle. On the 1-hour chart, the trend is decisively bearish, with the ADX at 18.19 indicating a weak trend, suggesting sideways movement but with a downward bias. However, the RSI(14) at 27.34 is screaming 'oversold', hinting at a potential short-term bounce. This divergence between the trend strength and the RSI reading is a classic sign of a market in flux, where short-term technicals might contradict the broader fundamental picture. The Stochastic indicator, with %K at 7.95 and %D at 26.66, also signals a bearish momentum, reinforcing the idea that sellers are in control, at least for the immediate future. This technical picture, however, needs to be viewed against the backdrop of the powerful dollar rally.
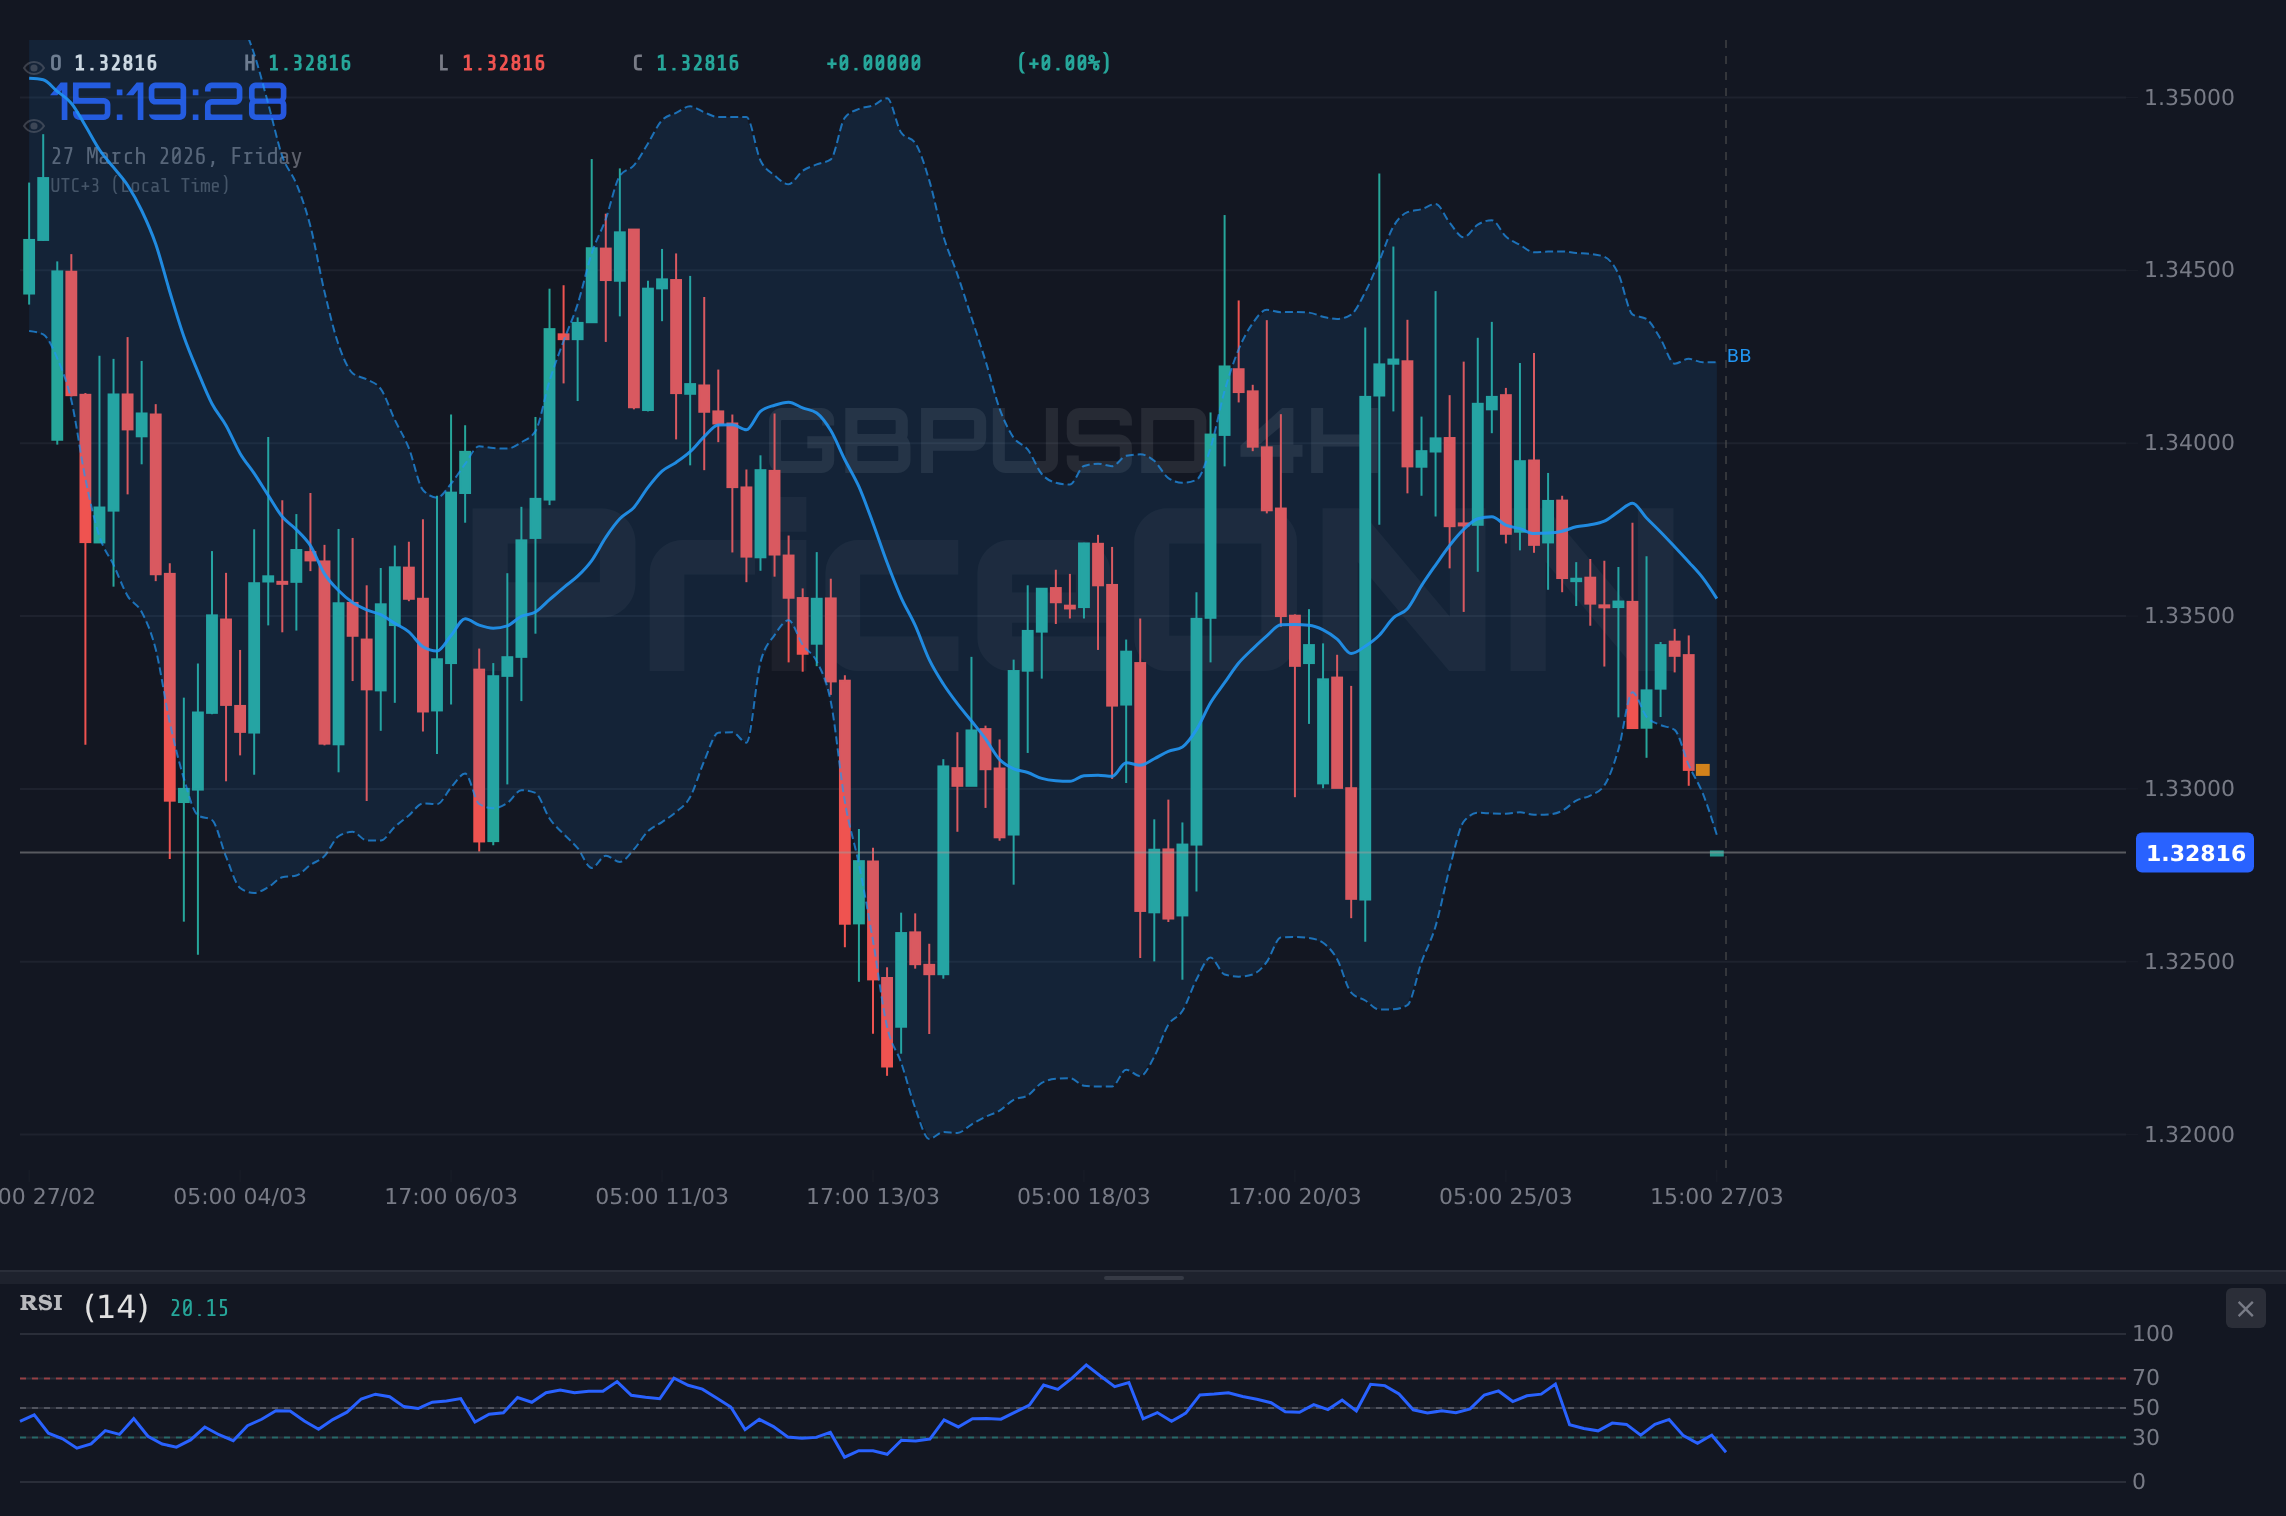
Delving into the 4-hour timeframe, the picture remains challenging for the Pound. The trend is still classified as neutral, but the ADX at 14.74 signifies an even weaker trend, suggesting consolidation or a lack of clear direction in the medium term. Yet, the overall signal leans towards 'SELL'. The RSI(14) is at 40.11, still in the neutral zone but trending downwards, indicating that selling pressure is present. The MACD is below its signal line, confirming negative momentum. While the Stochastic shows a potential bullish signal (%K > %D), it's within an oversold territory and might not have the strength to reverse the prevailing trend. The key support level to watch on this timeframe is $1.15336, a break below which could accelerate the decline. The current price action suggests that the market is waiting for a clearer catalyst to break the indecision, but the dominant force remains the dollar's strength.
On the daily chart, the bearish trend for GBPUSD is undeniable, with an ADX of 34.07 indicating a strong downward trend. The RSI(14) is hovering around 39.83, firmly in the neutral-to-bearish territory, and showing a downward eğilim. MACD is negative, and Bollinger Bands are showing a downward bias, with the price trading below the middle band. The Stochastic is giving a bearish signal (%K < %D), further confirming the negative sentiment. The immediate support level identified is $1.15093. A sustained break below this level would be a significant bearish development, potentially opening the door for further downside. The confluence of technical indicators on the daily chart paints a grim picture for the Pound, especially when considered alongside the macro-economic headwinds.
The recent news regarding the Federal Reserve's renewed focus on inflation risks is particularly pertinent. If the Fed indeed pivots back to a more hawkish stance, as suggested by some officials, this would likely translate into higher US interest rates or a slower pace of rate cuts than previously anticipated. This scenario directly benefits the US Dollar, increasing the yield advantage and attracting capital away from currencies like the GBP. The impact on GBPUSD could be substantial, potentially pushing it towards the lower support levels identified. This fundamental driver adds significant weight to the bearish case, suggesting that the current technical oversold conditions might be a temporary reprieve rather than a signal of an impending reversal.
The Bull's Gambit: Can Sterling Find Its Footing?
For GBPUSD to stage a meaningful recovery, several conditions would need to be met, defying the current bearish momentum. The most immediate technical signal offering a glimmer of hope comes from the 1-hour RSI(14) reading of 27.34, which is deeply oversold. Historically, such readings can precede short-term bounces as the market takes a breather or as some profit-taking occurs. The Stochastic indicator on the 1-hour chart also shows a potential for a rebound, with %K (7.95) potentially poised to cross above %D (26.66) if buying pressure intensifies. A break above the immediate 1-hour resistance at $1.15204 would be the first sign of a bullish attempt, potentially targeting the next resistance at $1.15306. If this short-term momentum were to extend, a more significant move towards the 4-hour resistance at $1.15459 could be on the cards.
However, for a more sustained bullish trend to emerge, fundamental factors would need to shift dramatically. Firstly, a significant dovish pivot from the Federal Reserve would be required. This could manifest as clearer signals of impending rate cuts, a softening of inflation rhetoric, or unexpected weakness in US economic data that forces the Fed's hand. For instance, a surprisingly weak US Non-Farm Payrolls (NFP) report or a significant drop in US inflation figures could dramatically alter market expectations and support a GBPUSD rally. Conversely, any positive surprises from the UK economy, such as stronger-than-expected GDP growth or inflation figures that align with or exceed expectations, would provide a much-needed boost to the Sterling. The upcoming economic calendar will be crucial in this regard, with key US and UK data releases on the horizon.
Furthermore, a de-escalation of geopolitical tensions would likely reduce the demand for the safe-haven US Dollar, allowing riskier currencies like the Pound to regain some ground. If the narrative around global uncertainty begins to fade, and market participants become more comfortable with risk, capital might flow back into assets perceived as higher-yielding or with higher growth potential, benefiting GBPUSD. The news flow surrounding energy prices and international relations will be critical to monitor. A sustained drop in oil prices, driven by easing supply concerns or a resolution to geopolitical standoffs, could also contribute to a less bullish dollar environment and, by extension, support GBPUSD. Such a confluence of positive developments - a Fed pivot, strong UK data, and easing global risks - would be necessary to invalidate the current bearish trend and propel GBPUSD significantly higher.
The Waiting Game: Consolidation Around $1.33
Before a decisive move higher or lower, GBPUSD might find itself in a period of consolidation, particularly around the $1.33 psychological level. This scenario often occurs when conflicting signals emerge, or when the market awaits a significant catalyst. Technically, the confluence of oversold indicators on the 1-hour chart (RSI 27.34) and the strong bearish trend on the daily chart (ADX 34.07) creates a tug-of-war. The immediate resistance at $1.15204 and support at $1.15048 represent the boundaries of this potential range on the shorter timeframes. If price action remains confined between these levels, it suggests a market in a holding pattern.
Fundamentally, this consolidation could persist if incoming economic data from both the US and the UK offers mixed signals. For example, if US inflation data shows signs of moderation but not a definitive decline, and UK employment figures remain stable but uninspiring, the market might remain indecisive. This would prevent a strong conviction trade from forming, leading to a period of range-bound trading. The DXY's movement would also be key here; if the dollar's strength falters temporarily without a clear fundamental reason, it could allow GBPUSD to stabilize, but without enough momentum to break out decisively. Such a scenario would likely see price action oscillating between the key support at $1.15093 and resistance around $1.15621 on the daily chart, offering limited trading opportunities but requiring careful risk management for those attempting to trade the range.
Market Sentiment Analysis: What the Indicators Are Saying
The current market sentiment for GBPUSD is predominantly bearish, as evidenced by the overwhelming 'SELL' signals across multiple timeframes and the strong downward trend indicated by the ADX. On the 1-hour chart, the RSI at 27.34 is deeply oversold, suggesting that the current downward move might be overextended in the short term. This could lead to a temporary bounce, but the overall trend remains a significant concern. The MACD is negative, and the Stochastic is also signaling further downside, reinforcing the bearish outlook. This technical picture aligns with the fundamental drivers, particularly the strength of the US Dollar and the hawkish undertones from the Federal Reserve. The DXY's current level around 99.92 is a significant factor weighing on the pair.
However, it's crucial to acknowledge the conflicting signals. While the daily trend is strong (ADX 34.07), the 1-hour RSI is deeply oversold, and the Stochastic on the 4-hour chart is showing a potential uptick. These short-term indicators suggest that a bounce is possible, even within a larger downtrend. This is where careful analysis becomes paramount. A trader looking for opportunities would need to see confirmation beyond just the oversold RSI. This confirmation might come in the form of a bullish divergence on the MACD, a sustained break above the 1-hour resistance at $1.15204, or a significant shift in the fundamental narrative, such as dovish commentary from the Fed or surprisingly strong UK economic data. Without such confirmation, chasing a counter-trend move is a risky proposition.
The price action around the $1.33 level is critical. A break below this psychological barrier could trigger further selling, potentially targeting the next support at $1.3299. Conversely, if the oversold conditions on the shorter timeframes lead to a rebound, the initial test will be at $1.15204, followed by $1.15306. The broader market sentiment, driven by the DXY and Fed expectations, will likely dictate the ultimate direction. The current signals suggest caution, with a bias towards further downside unless key technical or fundamental thresholds are breached.
The Bull's Roadmap: Navigating Towards Higher Ground
The Sterling's Ascent: A Potential Rebound
15% ProbabilityWhere Bears Take Control: The Downside Scenario
The Bear Trap: Testing Lower Depths
70% ProbabilityThe Waiting Game: Range-Bound Uncertainty
Consolidation Zone: Caught Between Levels
15% ProbabilityThe most probable scenario, given the current confluence of a strong dollar, hawkish Fed sentiment, and bearish technicals on longer timeframes, is a continued push lower for GBPUSD. The probability is assigned at 70%, with the primary trigger being a break below the critical $1.15048 support level, especially if accompanied by further DXY strength. The oversold conditions on the 1-hour chart present a slight chance for a short-term bounce, hence the 15% probability for the bullish scenario, contingent on significant positive catalysts. The neutral scenario, with a 15% probability, reflects the possibility of a temporary pause before the next directional move, particularly if key economic data releases provide mixed signals.
What I'm Watching: Key Triggers for GBPUSD
The market is at a critical juncture for GBPUSD. My attention is sharply focused on a few key elements that will likely dictate the pair's direction in the coming days. Firstly, I am closely monitoring the US Dollar Index (DXY). Its ability to hold above the 99.90 level and push higher will be a significant tailwind for the bearish case on GBPUSD. Any sign of weakness or consolidation in the DXY could offer temporary relief for Sterling.
Secondly, the upcoming economic data releases are paramount. A surprisingly strong US inflation or employment report could solidify the hawkish Fed narrative, further pressuring GBPUSD towards lower targets. Conversely, any signs of significant cooling in US inflation or unexpected weakness in US growth data could trigger a dollar sell-off and a potential rally in GBPUSD. From the UK side, any data that suggests a worsening economic outlook or increased stagflationary pressures would add to the downside risk.
Finally, the price action around the key support level of $1.3299 is crucial. A decisive break below this level, particularly on increasing volume, would likely signal the start of a more aggressive sell-off, validating the bearish scenario. Conversely, a strong bounce from this level, coupled with positive news flow or a shift in Fed sentiment, could signal a short-term reversal. The interplay between these fundamental drivers and technical levels will be key to navigating this volatile market.
Frequently Asked Questions: GBPUSD Analysis
What happens if GBPUSD breaks below the $1.3299 support level amidst continued DXY strength?
A break below $1.3299, especially with the DXY pushing higher towards 100, would likely trigger further selling pressure. This could accelerate the decline towards the next significant daily support at $1.32313, as traders exit riskier positions and seek the safety of the US Dollar. The oversold conditions on shorter timeframes might offer a brief pause, but the fundamental backdrop would support further downside.
Should I consider buying GBPUSD around the current $1.33 levels given the 1-hour RSI is at 27.34?
While the 1-hour RSI at 27.34 signals extreme oversold conditions and could precede a short-term bounce, entering long positions at current levels carries significant risk. The overall trend on the daily chart remains bearish (ADX 34.07), and the DXY is strong. A more prudent approach would be to wait for confirmation, such as a decisive break above $1.15204 resistance or a clear shift in fundamental drivers, before considering a long entry, possibly with a 65% probability of a move towards $1.15621.
Is the MACD signal on the daily chart a strong sell signal for GBPUSD at current levels?
The negative MACD momentum on the daily chart, with the MACD line below the signal line, does indicate bearish pressure. However, it is not a standalone sell signal. It needs to be considered in conjunction with other indicators and the broader market context. While it supports the bearish outlook, the ADX at 34.07 is a stronger indicator of the current strong downward trend, suggesting that the MACD signal is aligned with the prevailing market direction.
How might upcoming US inflation data impact GBPUSD this week, given the Fed's hawkish signals?
If upcoming US inflation data, such as CPI or PCE, comes in hotter than expected (Actual > Forecast), it would reinforce the Fed's hawkish stance and likely strengthen the US Dollar further. This would increase the probability of GBPUSD falling towards its support levels, potentially below $1.3299. Conversely, if inflation shows signs of significant cooling, it could lead to a dollar pullback and a short-covering rally in GBPUSD, potentially targeting resistance levels around $1.3367.
Track markets in real-time
AI-powered analysis, technical indicators and real-time price data.
Join Our Telegram Channel
Breaking market news, AI analysis and trading signals instantly.
Join Channel