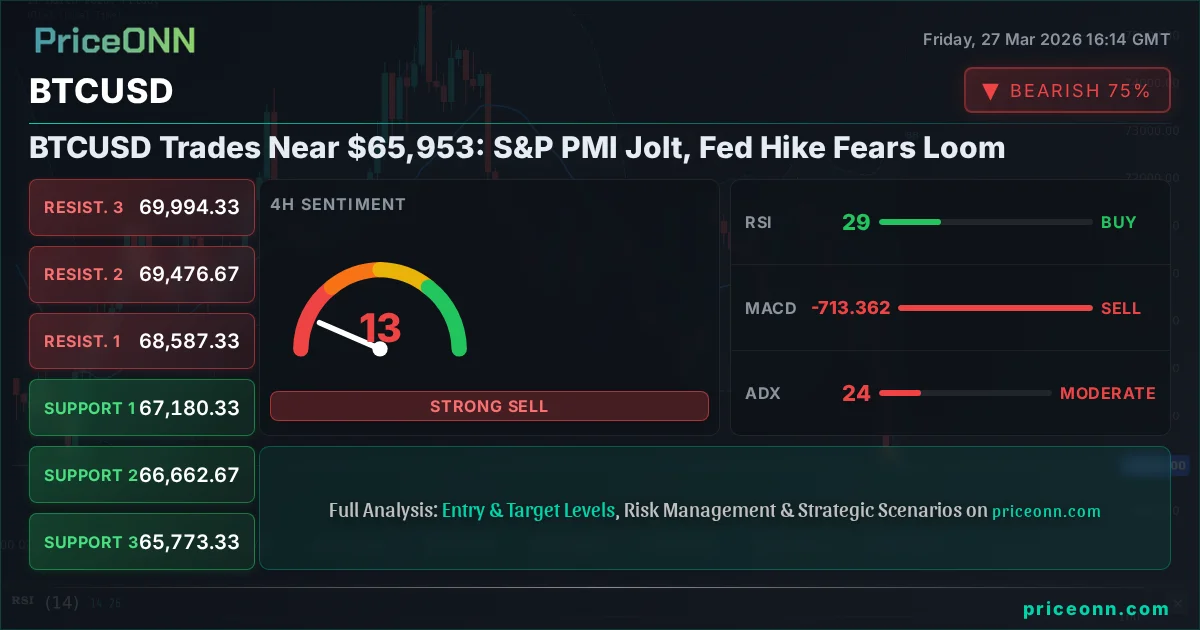
BTCUSD Trades Near $65,953: S&P PMI Jolt, Fed Hike Fears Loom
BTCUSD hovers around $65,953 amid a sharp equities selloff and renewed Fed rate hike speculation. Key support at $65,826.33.
Bitcoin, the flagship cryptocurrency, is currently navigating choppy waters, trading just above the critical $65,953 mark. This price point is being tested as broader market sentiment sours, driven by a potent cocktail of declining equity indices and resurfacing concerns about potential Federal Reserve interest rate hikes. The latest PMI data from the US, while showing a slight dip, still hints at an economy that might be robust enough for the Fed to reconsider its easing path, creating a complex environment for risk assets like Bitcoin.
The market's reaction to the latest US economic data has been swift and decisive, particularly impacting risk appetite. The S&P 500 and Nasdaq indices have both experienced significant downturns, reflecting a broader shift away from riskier assets. This risk-off sentiment is a well-known adversary for cryptocurrencies, often leading to correlated sell-offs. With the S&P 500 currently trading at 6417.45, down 1.08% on the day, and the Nasdaq at 23316.34, down 1.28%, the correlation is playing out as expected. This selloff in equities creates a challenging backdrop for BTCUSD, which has recently struggled to maintain its upward momentum, failing to sustain levels above $67,000.
Looking at the technical picture for BTCUSD, the 1-hour chart presents a bearish trend with strong conviction (90% strength). The immediate support level to watch is $65,826.33, followed by $65,444.67 and $65,154.33. On the flip side, resistance is forming around $66,498.33, $66,788.67, and potentially higher at $67,170.33. The Relative Strength Index (RSI) at 16.78 is deeply oversold, suggesting that while the selling pressure is intense, a short-term bounce could be on the cards. However, the Moving Average Convergence Divergence (MACD) is showing negative momentum, and the MACD histogram is below the signal line, confirming the bearish sentiment. The ADX at 41.94 indicates a strong downtrend, making any upward movements potentially corrective rather than a reversal.
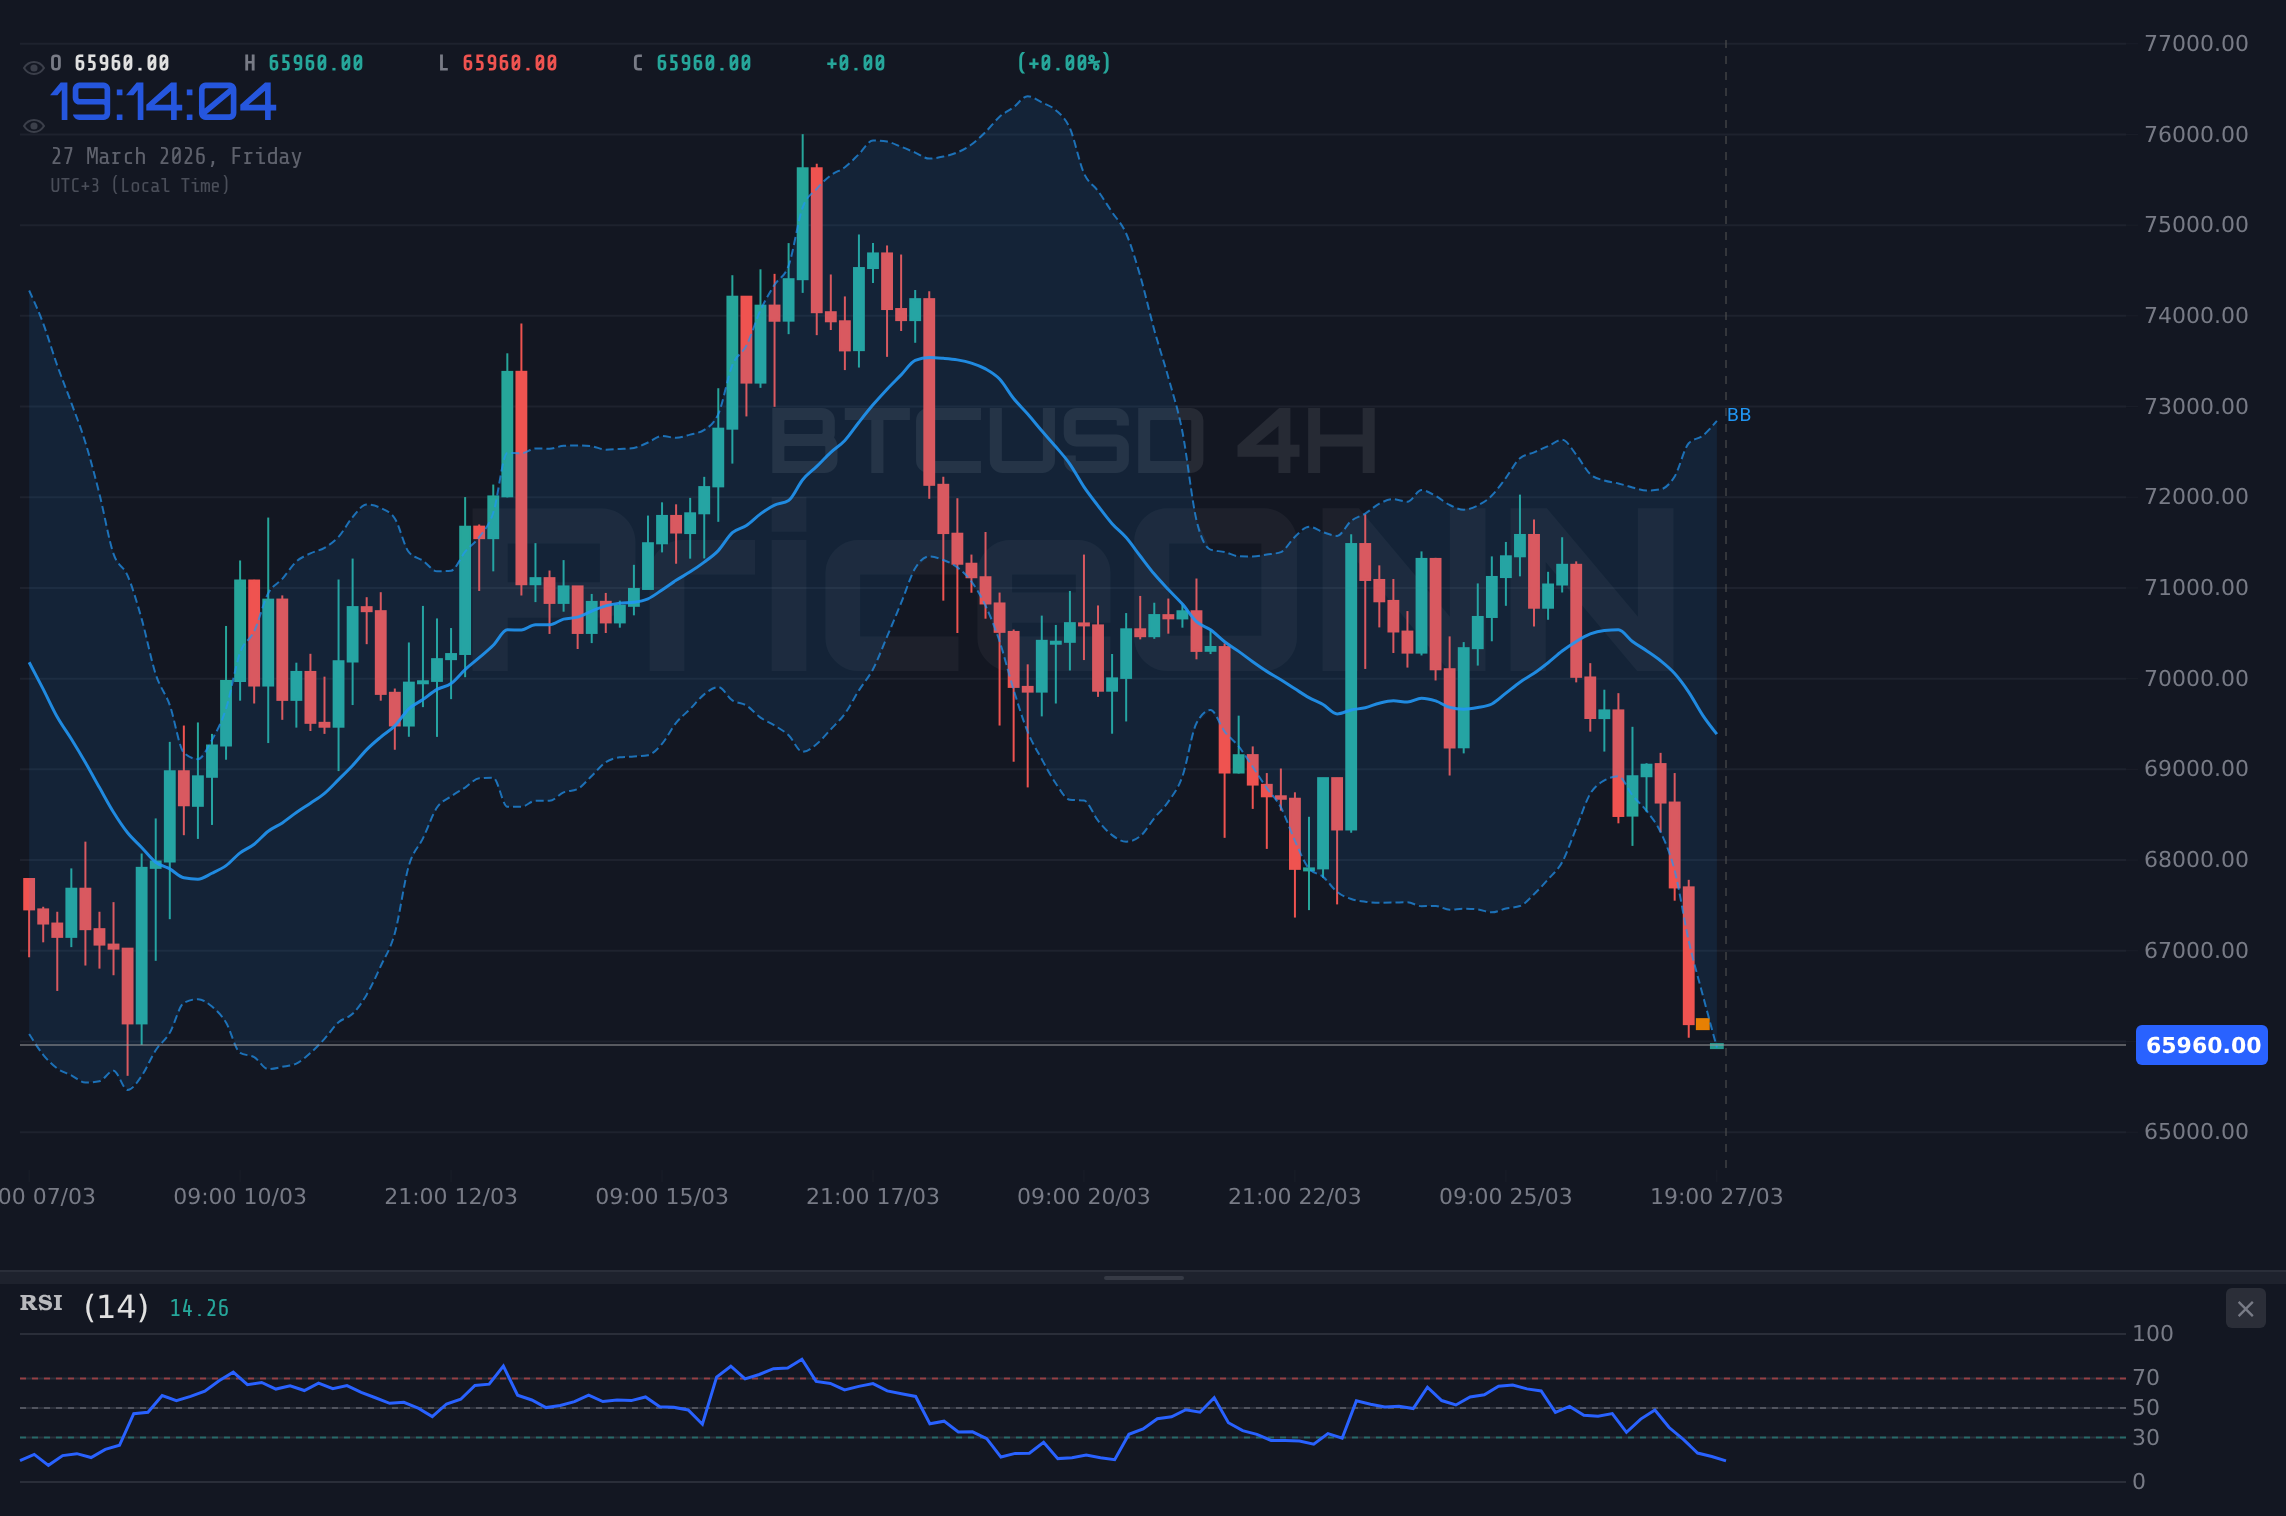
The 4-hour timeframe offers a similar, albeit slightly less severe, picture. The trend is still decidedly bearish (100% strength), with key support levels at $67,180.33, $66,662.67, and $65,773.33. Resistance is seen at $68,587.33, $69,476.67, and $69,994.33. The RSI here is at 28.73, also deep in oversold territory, hinting at potential short-term relief. The MACD remains negative, and Stochastic oscillators are showing extreme oversold conditions. The ADX at 23.54 still points to a significant downtrend. The 'General Signal' across these shorter timeframes leans heavily towards 'SELL', with 6 out of 8 indicators suggesting a bearish outlook, reinforcing the immediate downside pressure.
However, the daily chart for BTCUSD offers a slightly different perspective, presenting a neutral trend with 50% strength. This suggests that while the short-term is bearish, the longer-term picture might be consolidating or waiting for new catalysts. Key support on the daily chart lies at $67,533.67, $66,143.33, and $64,130.67. Resistance levels loom higher at $70,936.67, $72,949.33, and $74,339.67. The RSI at 39.93 is in neutral territory but trending downwards, indicating a lack of buying conviction. The MACD is negative, and Stochastic is showing a bearish signal (%K < %D), but the ADX at 17.08 suggests a weakening trend. This daily chart neutrality implies that the current sharp sell-off might be a deeper correction within a larger range, rather than the start of a sustained bear market, unless key daily levels are breached.
The Fed Factor: Inflation Fears Reignite
The most significant overhang for risk assets, including Bitcoin, remains the evolving stance of the Federal Reserve. Recent economic data, particularly the latest US Purchasing Managers' Index (PMI) figures, have painted a picture of a resilient, albeit slightly cooling, US economy. The fact that the actual services PMI came in at 52.4, exceeding the forecast of 51.5 and the previous reading of 51.6, suggests that economic activity is still expanding. While the manufacturing PMI dipped slightly to 51.1 from 51.7, it remains above the 50 mark, indicating growth in that sector as well. This economic resilience is precisely what could give the Fed pause regarding aggressive rate cuts.
Traders are now pricing in a 52% chance of a Federal Reserve rate hike by year-end, a stark contrast to earlier expectations of multiple cuts. This shift in sentiment is critical. If the Fed indeed pivots back towards a tightening bias, or even just holds rates higher for longer, it would likely increase borrowing costs across the economy and reduce liquidity. This scenario typically spells trouble for speculative assets like Bitcoin, which have benefited immensely from a low-interest-rate environment. The correlation between BTCUSD and the DXY (Dollar Index) is also worth noting. With the DXY currently at 99.86 and showing a bullish trend across multiple timeframes, a stronger dollar typically exerts downward pressure on commodities and cryptocurrencies.
Correlation with Equities and Commodities
The recent sharp decline in major US equity indices like the S&P 500 and Nasdaq is a significant headwind for Bitcoin. Historically, especially in recent years, Bitcoin has shown an increasing correlation with tech-heavy equity markets. When risk appetite wanes and major indices tumble, as they have today, Bitcoin often follows suit. The S&P 500's drop below its daily middle Bollinger Band and RSI falling to 29.02 suggests further downside risk in equities, which likely translates to continued pressure on BTCUSD. The Nasdaq's RSI at 30.59 and ADX at 44.94 also point to a strong downtrend, reinforcing this correlation.
Conversely, the energy markets are showing significant strength. Brent crude is up 4.62% at $108.41, and WTI crude is up 5.02% at $98.68. This surge in oil prices, driven by factors likely including geopolitical tensions and supply concerns, can indirectly impact Bitcoin. Higher energy prices can feed into inflation expectations, which in turn influences central bank policy. If the market perceives rising oil prices as a sign of persistent inflation, it strengthens the case for the Fed to maintain a hawkish stance, creating a dual headwind for Bitcoin: direct selling pressure from risk aversion and indirect pressure from tighter monetary policy expectations.
Key Levels and Price Action Dynamics
The immediate price action for BTCUSD is critical. The current price of $65,953.00 sits precariously close to the first hourly support level at $65,826.33. A decisive break below this level, especially on increasing volume, could trigger a cascade of stop-loss orders, potentially accelerating the decline towards the next support at $65,444.67. On the hourly chart, the ADX reading of 41.94 signifies a strong trend, meaning that once a direction is established, it tends to persist. Therefore, a confirmed break below $65,826.33 would likely signal further downside.
On the resistance side, the $66,498.33 level on the 1-hour chart is the first hurdle for any potential bounce. A sustained move above this, confirmed by increasing volume and a break of the hourly MACD signal line, could pave the way for a test of $66,788.67. However, given the prevailing bearish signals across multiple timeframes and the broader market sentiment, such a bounce might be a temporary correction within a larger downtrend or consolidation phase. The daily chart's neutrality suggests that while the short-term is bearish, a significant catalyst would be needed to break the established range entirely. Until then, price action between the daily support ($67,533.67) and resistance ($70,936.67) may define the medium-term trend.
The Role of Technical Indicators
Examining the technical indicators provides a nuanced view. On the 1-hour chart, the RSI at 16.78 and Stochastic at 8.86/%K are deeply oversold. This often precedes a bounce, but in a strong downtrend, it can remain oversold for extended periods. The MACD's negative momentum and the ADX's strong trend reading (41.94) are more concerning for bulls. On the daily chart, the picture is less extreme: RSI at 39.93 is neutral-down, MACD is negative but less aggressive, and ADX at 17.08 indicates a weakening trend. This divergence between short-term oversold conditions and weaker daily trend strength suggests caution. A bounce is possible, but a sustained recovery needs confirmation from bullish divergences or a break of key resistance levels on higher timeframes.
The conflict between the short-term oversold signals and the overall bearish momentum warrants careful observation. While the RSI and Stochastic on the 1-hour and 4-hour charts scream 'oversold', the MACD and ADX readings on these same charts, along with the daily trend analysis, suggest that the path of least resistance is still downwards. This is a classic scenario where traders look for confirmation. A potential bullish signal would emerge if BTCUSD holds above the $65,826.33 support, rallies above the hourly resistance at $66,498.33, and crucially, sees the MACD turn positive on the 4-hour chart. Conversely, a failure to hold support would invalidate any short-term bullish thesis.
Economic Calendar and Future Catalysts
The economic calendar presents several potential catalysts that could influence BTCUSD's trajectory. The release of the US services PMI figures today, while showing expansion, also highlighted a slight easing in business activity, which could be interpreted in multiple ways. More importantly, upcoming events will be critical. While the specific dates are not provided in the snippet, market participants will be closely watching any further US inflation data (like CPI or PCE), employment figures (NFP), and crucially, any forward guidance from Fed officials. The market is highly sensitive to Fed rhetoric; any hint of a continued hawkish stance or a delay in anticipated rate cuts could trigger further risk-off sentiment.
The recent news about the Fed potentially eyeing a rate hike as inflation surges past 4% is a significant development. If this sentiment hardens, it would likely strengthen the US Dollar (DXY), which is currently showing a strong bullish trend on multiple timeframes. A rising DXY often correlates with a falling BTCUSD. Furthermore, the ongoing strength in energy prices (Brent and WTI crude) could contribute to sticky inflation, reinforcing the Fed's cautious stance. The interplay between inflation data, Fed policy expectations, and the broader risk sentiment will be the dominant theme for Bitcoin in the coming weeks.
Navigating the Current Market Landscape
For traders, the current environment demands a cautious approach. The sharp sell-off in equities and the renewed fears of higher-for-longer interest rates create a challenging backdrop for cryptocurrencies. While short-term oversold conditions might offer opportunities for quick bounces, the overall trend on higher timeframes remains bearish. The critical support level at $65,826.33 on the 1-hour chart is the immediate line in the sand. A break below this could lead to accelerated selling pressure.
On the flip side, for a bullish case to emerge, BTCUSD needs to not only hold the current price levels but also decisively break above near-term resistance, particularly the $66,498.33 level. Confirmation would require a shift in broader market sentiment, a more dovish tone from the Fed, or a clear technical reversal pattern on the daily chart. Until then, the risk of further downside remains elevated. The neutral stance on the daily chart does offer some hope for range-bound trading, but the strong short-term downtrend and bearish signals cannot be ignored. Risk management should be paramount, focusing on defined entry and exit points based on the levels discussed.
Looking Ahead: The Tug-of-War Continues
The battle between inflation fears and the potential for economic slowdown continues to dominate financial markets. For Bitcoin, this translates into a delicate balancing act. On one hand, a strong economy could eventually lead to broader adoption and demand. On the other, a resilient economy might keep the Fed on hold or even prompt further tightening, which is detrimental to risk assets. The current technical setup, with oversold conditions on shorter timeframes but a strong downtrend in place, suggests that the market is looking for direction. The catalyst will likely come from macroeconomic data releases and central bank commentary.
The correlation with equities and the dollar index remains a key driver. If the S&P 500 and Nasdaq continue their descent, and the DXY strengthens further, BTCUSD is likely to face continued selling pressure. Conversely, any sign of stabilization in equities, a dovish shift from the Fed, or a decrease in inflation expectations could provide a much-needed tailwind. For now, the $65,953 level is a psychological and technical pivot point. Its hold or failure will dictate the immediate direction, while the broader macroeconomic narrative will shape the medium to long-term outlook. Patience and disciplined risk management are key as the market digests these conflicting signals.
Frequently Asked Questions: BTCUSD Analysis
What happens if BTCUSD breaks below the $65,826.33 support level?
A break below $65,826.33 on the 1-hour chart, especially with increased volume, would likely trigger further selling pressure. This could accelerate the decline towards the next support at $65,444.67, as stop-loss orders are triggered and bearish momentum intensifies.
Should I buy BTCUSD at current levels around $65,953, given the oversold RSI?
While the RSI at 16.78 is deeply oversold on the 1-hour chart, suggesting potential for a short-term bounce, the overall trend remains bearish. A buy decision would require confirmation, such as holding above $65,826.33 and breaking resistance at $66,498.33, with a probability of success currently below 50% given the prevailing market conditions.
Is the MACD negative momentum on the daily chart a strong sell signal for BTCUSD?
The negative MACD momentum on the daily chart, coupled with an ADX of 17.08 indicating a weakening trend, suggests caution rather than an immediate sell signal. It confirms the lack of strong bullish conviction but doesn't necessarily signal a full-blown bear market reversal on its own. Confirmation would be needed from price action and other indicators.
How will the potential Fed rate hike fears affect BTCUSD this week?
Renewed fears of a Fed rate hike, driven by resilient economic data like the services PMI at 52.4, could strengthen the US Dollar and increase risk aversion. This scenario would likely put further downward pressure on BTCUSD, potentially pushing it towards lower support levels as liquidity tightens.
Track markets in real-time
AI-powered analysis, technical indicators and real-time price data.
Join Our Telegram Channel
Breaking market news, AI analysis and trading signals instantly.
Join Channel