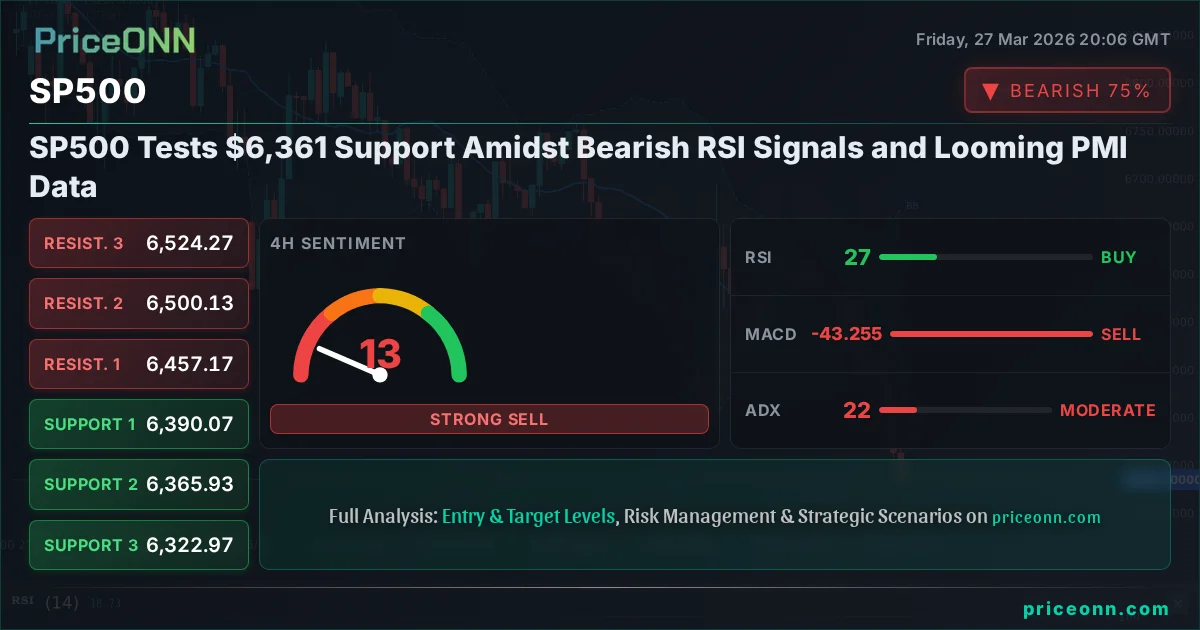
SP500 Tests $6,361 Support Amidst Bearish RSI Signals and Looming PMI Data
The S&P 500 is trading at $6,361.00, testing critical support levels. A bearish RSI divergence and upcoming PMI data add to market uncertainty.
The S&P 500 is currently navigating a challenging period, trading around the $6,361.00 mark. This critical juncture arrives as a bearish divergence on the Relative Strength Index (RSI) flashes a warning sign, while traders brace for the upcoming Purchasing Managers' Index (PMI) data releases. The broader market sentiment remains cautious, influenced by a strengthening US Dollar Index (DXY) and a palpable risk aversion gripping global equities. Understanding the interplay between these factors is crucial for deciphering the S&P 500's next move.
- RSI at 20.3 on the 1-hour chart signals extreme oversold conditions, suggesting potential short-term bounces but overall bearish momentum.
- Critical support for the S&P 500 sits at $6,365.93, a level tested multiple times in the 4-hour timeframe, with a further hold at $6,322.97.
- The MACD histogram shows negative momentum, reinforcing the bearish trend, though stochastic indicators are flashing oversold signals on shorter timeframes.
- Correlation with the strengthening DXY (currently at 99.91) is putting pressure on US equities, highlighting the demand for safe-haven assets.
Navigating the Selloff: Technical Picture Unveiled
The S&P 500's recent sharp decline, pushing the index down to $6,361.00, paints a concerning technical picture, particularly on shorter timeframes. The 1-hour chart reveals an RSI value of 20.3, deep within oversold territory. While oversold conditions can sometimes precede a bounce, the persistent negative momentum indicated by the MACD histogram suggests that any short-term rallies might be temporary. The ADX at 32.68 on this timeframe confirms a strong downtrend is in play, indicating that the bears are firmly in control and the current price action is not merely a shallow dip but a significant bearish move. The stochastic oscillator, with %K at 3.21 and %D at 8.82, further corroborates this oversold state, but in a strong downtrend, these signals often persist before a meaningful reversal occurs.
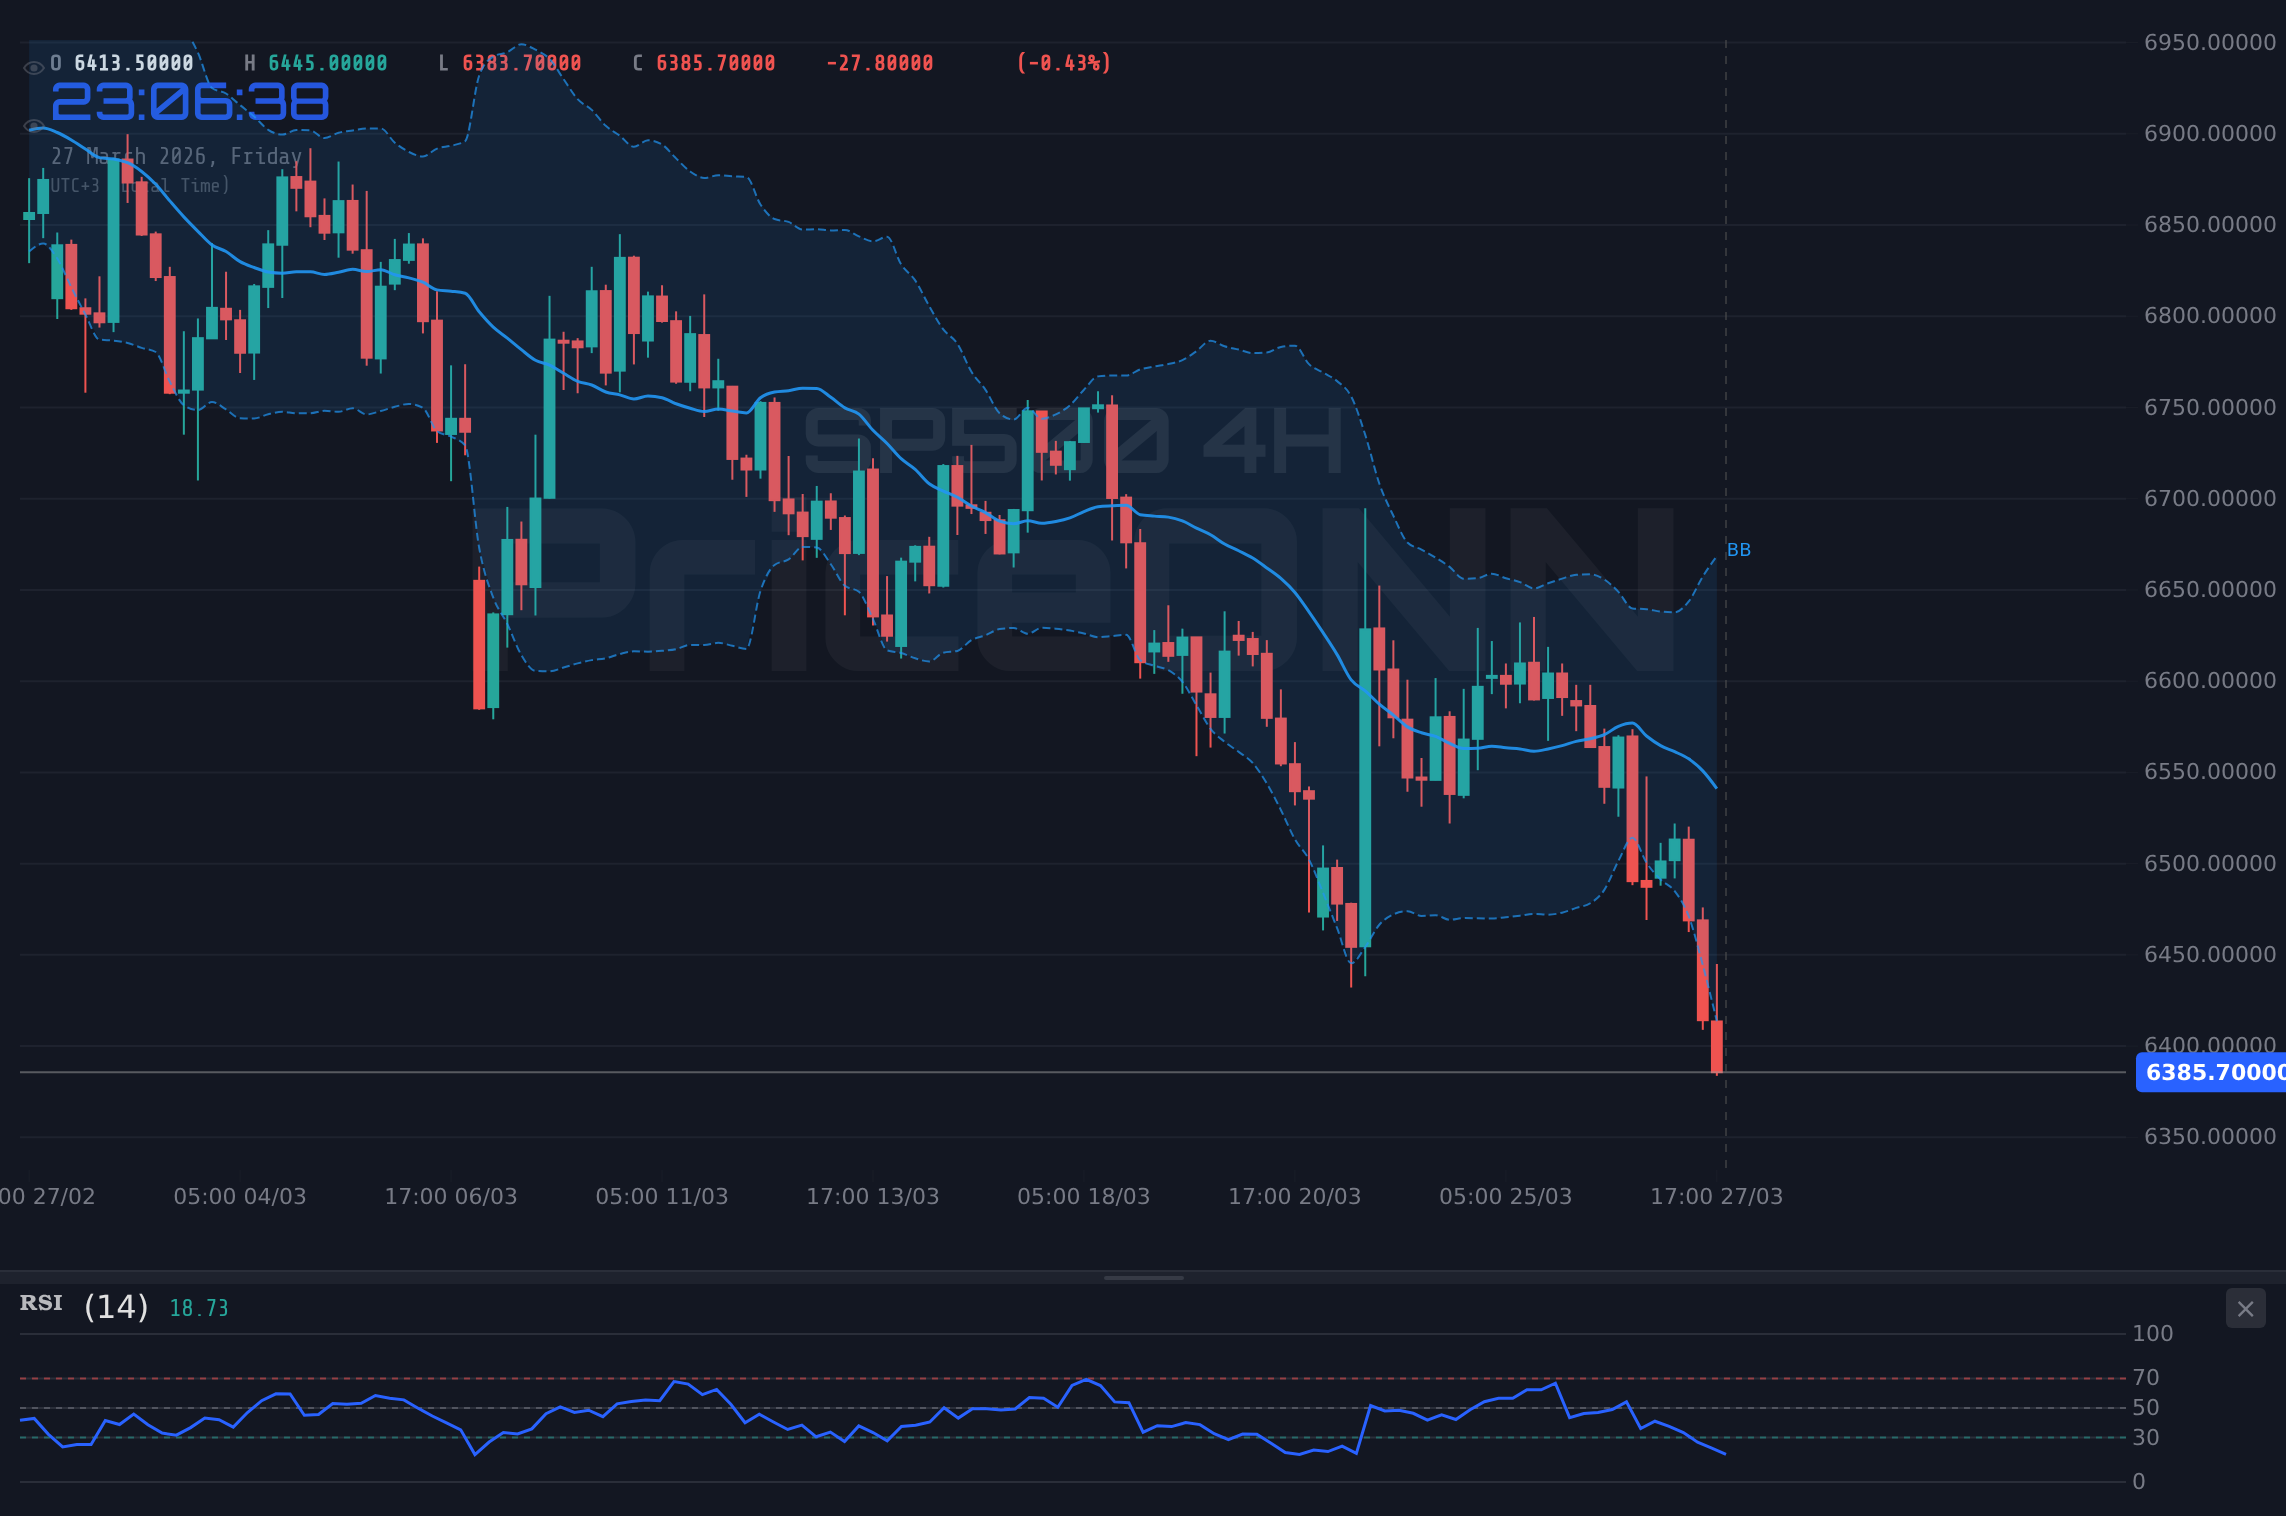
Moving to the 4-hour timeframe, the picture remains decidedly bearish. The S&P 500 is trading below the middle Bollinger Band, with the lower band being tested, a classic sign of strong selling pressure. The RSI here, at 27.13, is still firmly in oversold territory, reinforcing the bearish sentiment. The MACD continues to print negative momentum, and the ADX at 22.33, while slightly weaker than the 1-hour chart, still indicates a solid downtrend. The stochastic's %K at 2.51 and %D at 14.09 amplifies the oversold signal, suggesting that a relief bounce is statistically probable, but the overall trend remains firmly downwards. The current price of $6,361.00 is hovering precariously above the 4-hour support at $6,365.93, and a break below this level could accelerate the decline towards the next significant floor at $6,322.97.
On the daily chart, the S&P 500's trend is unequivocally bearish, with a 100% strength rating. The index is trading at $6,361.00, well below its daily middle Bollinger Band, indicating a strong bearish bias. The RSI sits at 26.86, signaling extreme oversold conditions that have historically preceded periods of consolidation or significant bounces. However, the MACD remains in negative territory, below its signal line, confirming the prevailing downtrend. The ADX reading of 47.64 on the daily chart is particularly noteworthy; it signifies a very strong trend, and in this case, a strong downtrend. This suggests that any potential rebounds might be met with renewed selling pressure until the trend strength begins to wane. The stochastic %K at 22.32 and %D at 30.49 also point to oversold conditions, but the persistent bearish trend indicated by the ADX means traders should remain cautious about anticipating a sharp reversal without further confirmation.
Fundamental Drivers: Inflation Fears and Fed's Dilemma
The relentless upward march of inflation continues to be the dominant narrative shaping market sentiment and, consequently, the performance of the S&P 500. Recent economic data, though mixed, has leaned towards persistent price pressures. While specific figures for the latest PMI releases are not yet out, previous trends and the recent surge in energy prices, with WTI crude oil trading at $100.27 and Brent at $109.77, suggest that inflation may prove more stubborn than initially anticipated. This has created a significant dilemma for the Federal Reserve. Futures traders are now pricing in a notable probability of a rate hike, a stark contrast to earlier expectations of rate cuts. This hawkish pivot, or at least the increased probability of it, directly impacts risk assets like equities. The strengthening US Dollar Index (DXY), currently at 99.91, further exacerbates this pressure on US stocks, as a stronger dollar can reduce the profitability of multinational corporations and signal tighter monetary policy ahead.
The upcoming PMI data will be crucial in providing a clearer picture of the US economic landscape. If the figures come in stronger than expected, it could reinforce the Fed's hawkish stance, potentially leading to further pressure on the S&P 500 as borrowing costs are expected to rise. Conversely, weaker PMI numbers might suggest an economic slowdown, which, while potentially easing inflation concerns, could also dampen corporate earnings expectations, creating a double-edged sword for equity markets. The market's reaction to the latest employment data also remains a key factor. Although the specific 'Actual' numbers for the economic calendar events provided are not fully detailed, the context of previous figures and market expectations for upcoming releases like NFP (Non-Farm Payrolls) and unemployment rates are vital. Any signs of a cooling labor market could offer some respite, but if inflation remains elevated, the Fed's hands might be tied.
Geopolitical tensions also continue to cast a shadow over global markets. The ongoing energy crisis, exacerbated by supply constraints and geopolitical instability, is a significant inflationary driver. India's recent move to slash fuel taxes and curb exports highlights the global struggle to manage soaring energy costs. This environment increases the demand for safe-haven assets, benefiting the US Dollar Index (DXY) and potentially weighing on riskier assets like the S&P 500. The correlation between the DXY and US equities is particularly important here; as the dollar strengthens around 99.91, it often puts downward pressure on the S&P 500, reflecting a global risk-off sentiment. Investors are closely watching how these macro-economic and geopolitical crosscurrents will influence the Fed's next policy decision, which will undoubtedly be a key catalyst for market direction.
Correlation Analysis: DXY, Oil, and the Equity Selloff
The current market environment is characterized by strong correlations that are critical for understanding the S&P 500's movements. The US Dollar Index (DXY), currently trading at 99.91, is acting as a significant headwind for US equities. As the DXY strengthens, it typically implies tighter global liquidity conditions or increased demand for safe-haven assets, both of which are detrimental to riskier investments like stocks. This inverse relationship is evident as the S&P 500 falters. The significant move in oil prices, with WTI at $100.27 and Brent at $109.77, is also a major factor. These elevated energy prices contribute directly to inflation concerns, forcing central banks to consider more aggressive monetary tightening. This, in turn, reinforces the strength of the DXY and puts further pressure on the S&P 500, creating a challenging feedback loop for investors.
The relationship between oil prices, inflation, and interest rate expectations cannot be overstated. When oil prices surge, as they have recently, inflation expectations tend to rise. This prompts market participants to price in higher interest rates from the Federal Reserve. The market is currently assigning a significant probability to a potential rate hike, a sentiment amplified by the hawkish undertones from Fed officials. This anticipation of higher rates strengthens the dollar, as seen with the DXY's rise, and simultaneously makes borrowing more expensive for corporations, potentially impacting future earnings and thus stock valuations. The S&P 500's decline to $6,361.00 is a direct reflection of this complex interplay between energy shocks, inflation, and monetary policy expectations. Traders are essentially repricing assets in a higher-rate, higher-inflation environment.
Furthermore, the broader risk appetite, as indicated by the performance of the Nasdaq 100 (currently at 23,112.94) and Dow Jones Industrial Average (at 45,111.5), reinforces the bearish outlook for the S&P 500. Both indices are experiencing significant downturns, with the Nasdaq showing a 2.14% daily drop and the Dow Jones a 2.01% decline. This widespread selloff across major US indices suggests a systemic risk-off sentiment rather than an isolated event. When major indices move in tandem with such force, it often signals a broader market correction driven by macroeconomic concerns, such as inflation and potential monetary tightening. The S&P 500's price action at $6,361.00 is thus occurring within a context of significant market-wide selling pressure, making a sustained recovery challenging without a clear shift in the underlying fundamental drivers.
The Road Ahead: PMI Data and Potential Catalysts
Looking forward, the upcoming PMI data releases will be critical catalysts for the S&P 500. These indicators offer a timely pulse check on manufacturing and services sector activity, providing valuable insights into the current state of the economy. Traders will be scrutinizing these numbers for signs of economic resilience or a potential slowdown. A strong PMI reading could validate the market's concern about persistent inflation and the Fed's potential to hike rates further, potentially leading to more downside for equities. Conversely, a weaker-than-expected PMI could spark fears of stagflation – a scenario of high inflation coupled with low economic growth – which is also detrimental to stock market performance. The market's reaction will depend heavily on how these numbers influence the Fed's policy outlook and the broader inflation narrative.
Beyond the immediate data releases, investor sentiment will remain heavily influenced by central bank communications. Any further signals from Federal Reserve officials regarding their stance on inflation and interest rates will be closely monitored. The market is highly sensitive to shifts in monetary policy expectations, and any indication of a prolonged period of higher rates could continue to suppress equity valuations. Additionally, ongoing geopolitical developments, particularly concerning energy supplies and global stability, will remain a background risk factor. Unexpected escalations or resolutions in these areas could trigger significant volatility across asset classes, including the S&P 500. The interplay between domestic economic data, central bank policy, and global events will dictate the market's trajectory in the coming sessions.
From a technical standpoint, the S&P 500's ability to hold the $6,361.00 level is paramount. Immediate resistance lies at $6,387.23, followed by $6,396.67. A convincing break above these levels, especially on increased volume, could signal a temporary reprieve for bulls. However, the prevailing bearish sentiment and the strong downtrend indicated by the ADX suggest that such rallies might be short-lived unless accompanied by a fundamental shift. On the downside, the support levels at $6,365.93 and $6,322.97 are critical. A decisive breach of these levels would likely confirm the continuation of the downtrend, opening the door for further declines towards $6,309.37 and potentially lower.
Bearish Scenario: Downside Momentum Continues
70% ProbabilityNeutral Scenario: Consolidation Around Support
20% ProbabilityBullish Scenario: Short-Term Relief Bounce
10% ProbabilityFrequently Asked Questions: S&P 500 Analysis
What happens if the S&P 500 breaks below $6,365.93 support?
A break below $6,365.93 would likely confirm the continuation of the bearish trend, potentially accelerating declines towards the next support at $6,322.97. This would signal further downside pressure driven by macro concerns and risk aversion.
Should I consider buying the S&P 500 at current levels around $6,361.00 given the oversold RSI?
While the RSI is deeply oversold at 20.3, the strong daily downtrend (ADX 47.64) suggests caution. A buy-the-dip strategy is risky without confirmation of trend reversal. Look for consolidation or a clear break of immediate resistance before considering entry.
Is the RSI at 20.3 a strong sell signal for the S&P 500 right now?
An RSI of 20.3 indicates extreme oversold conditions, which typically suggests an asset is technically oversold, not necessarily a direct sell signal. In a strong downtrend, oversold conditions can persist; it might signal a potential for a short-term bounce rather than an immediate reversal.
How will upcoming PMI data affect the S&P 500 this week?
Stronger-than-expected PMI data could reinforce Fed rate hike fears, pressuring the S&P 500 lower. Conversely, weaker data might raise stagflation concerns, also negatively impacting equities. The market's reaction will depend on how the data influences inflation and Fed policy expectations.
The path forward for the S&P 500 hinges on the interplay of technical levels and upcoming economic data. While oversold conditions on shorter timeframes hint at a potential for a relief bounce, the dominant bearish trend and persistent inflation fears suggest caution is warranted. Patience remains a virtue; waiting for clearer signals, whether a confirmed break of resistance or a stabilization above key support levels, will be crucial for navigating these turbulent market conditions. Remember, in volatile markets, disciplined risk management and a clear strategy are your most valuable allies.
Technical Outlook Summary
| Indicator | Value | Signal | Interpretation |
|---|---|---|---|
| RSI (14) | 26.86 | Oversold | Extreme oversold on daily, potential for bounce but trend is strong. |
| MACD Histogram | Negative | Bearish Momentum | Confirms prevailing downtrend. |
| Stochastic | K=22.32, D=30.49 | Oversold | Suggests potential short-term reversal but needs trend confirmation. |
| ADX | 47.64 | Strong Trend | Indicates a very strong downtrend is in force. |
| Bollinger Bands | Below Middle Band | Bearish Bias | Price action confirms bearish pressure. |
Track markets in real-time
AI-powered analysis, technical indicators and real-time price data.
Join Our Telegram Channel
Breaking market news, AI analysis and trading signals instantly.
Join Channel