DowJones30 Weekly Outlook: Bearish Turn at $45,077.50 Amidst Market Headwinds
DowJones30 faces a bearish turn, trading at $45,077.50. Key levels tested as market sentiment shifts. Next week's focus on Fed policy and economic data.
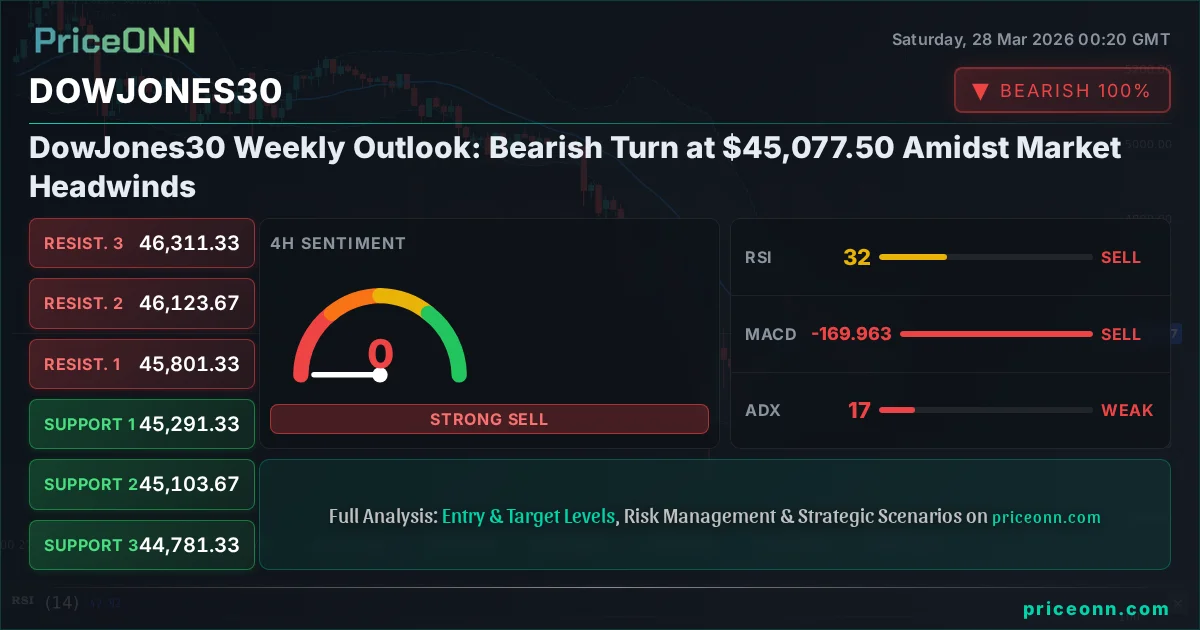
The DowJones30 index has entered a critical juncture, shedding significant ground and closing last week at $45,077.50. This marks a notable bearish turn, as broader market sentiment sours and investors reassess their risk exposure. The sharp decline seen late last week wasn't just a blip; it represented a fundamental shift in market dynamics, driven by a confluence of macroeconomic pressures and technical breakdowns. As we head into a new trading week, understanding the forces at play and the key levels to watch is paramount for navigating what could be a volatile period.
- The DowJones30 closed the week at $45,077.50, signaling a bearish turn with significant momentum.
- Key support at $45,021 was tested, while resistance at $45,352.33 showed strong selling pressure.
- RSI at 22.17 on the 1H chart indicates extreme oversold conditions, suggesting a potential short-term bounce but not a trend reversal.
- The ADX at 28.4 on the 1H chart confirms a strong downtrend, indicating that bearish sentiment is deeply entrenched.
- Correlation with a strengthening DXY (99.91) and falling S&P 500 (-2%) suggests a risk-off environment pressuring the DowJones30.
Navigating the DowJones30's Downturn: A Week in Review
Last week was a stark reminder that market trends are not linear. After showing resilience earlier in the month, the DowJones30 index experienced a significant pullback, culminating in a close at $45,077.50. This move wasn't isolated; it occurred within a broader context of increasing risk aversion across global markets. Major indices like the S&P 500 and Nasdaq also saw substantial declines, with the S&P 500 dropping 2% and the Nasdaq 100 falling 2.23% to 23,092.50. This synchronized selloff underscores a shift away from riskier assets, as investors become more cautious about the economic outlook and the persistent inflationary pressures that central banks are grappling with.
The strength of the US Dollar, as measured by the DXY index, also played a critical role. With the DXY climbing 0.34% to 99.91, it added another layer of pressure on risk assets. A stronger dollar typically makes US exports more expensive and can dampen international investment, contributing to a risk-off sentiment. This correlation is a well-established dynamic in financial markets, and its reassertion last week likely contributed to the Dow's downward trajectory. The interplay between the dollar's strength, equity market performance, and commodity prices like oil, which surged due to geopolitical tensions, paints a complex picture for the week ahead.
Technical Breakdown: What the Charts Are Telling Us
Delving into the technical indicators for the DowJones30 reveals a predominantly bearish picture, especially when examining the shorter timeframes. On the 1-hour chart, the index is firmly in a downtrend, with an ADX value of 28.4 indicating a strong trend. This suggests that the selling pressure is not just a fleeting moment but a committed move by market participants. The Relative Strength Index (RSI) at 22.17 on this timeframe screams oversold conditions, hinting at a potential for a short-term bounce. However, an oversold reading alone is not a buy signal, especially when the broader trend remains firmly down.
The MACD indicator on the 1-hour chart also shows negative momentum, with the MACD line below its signal line and the histogram in negative territory. This reinforces the bearish sentiment, suggesting that downward momentum is building. Similarly, Stochastic Oscillator readings are deep in oversold territory, with %K at 2.52 and %D at 10.07. While this can sometimes precede a bounce, the confluence of these indicators points towards significant downside pressure remaining in place. The Bollinger Bands on the 1-hour chart are also showing the price hugging the lower band, a classic sign of strong selling pressure.
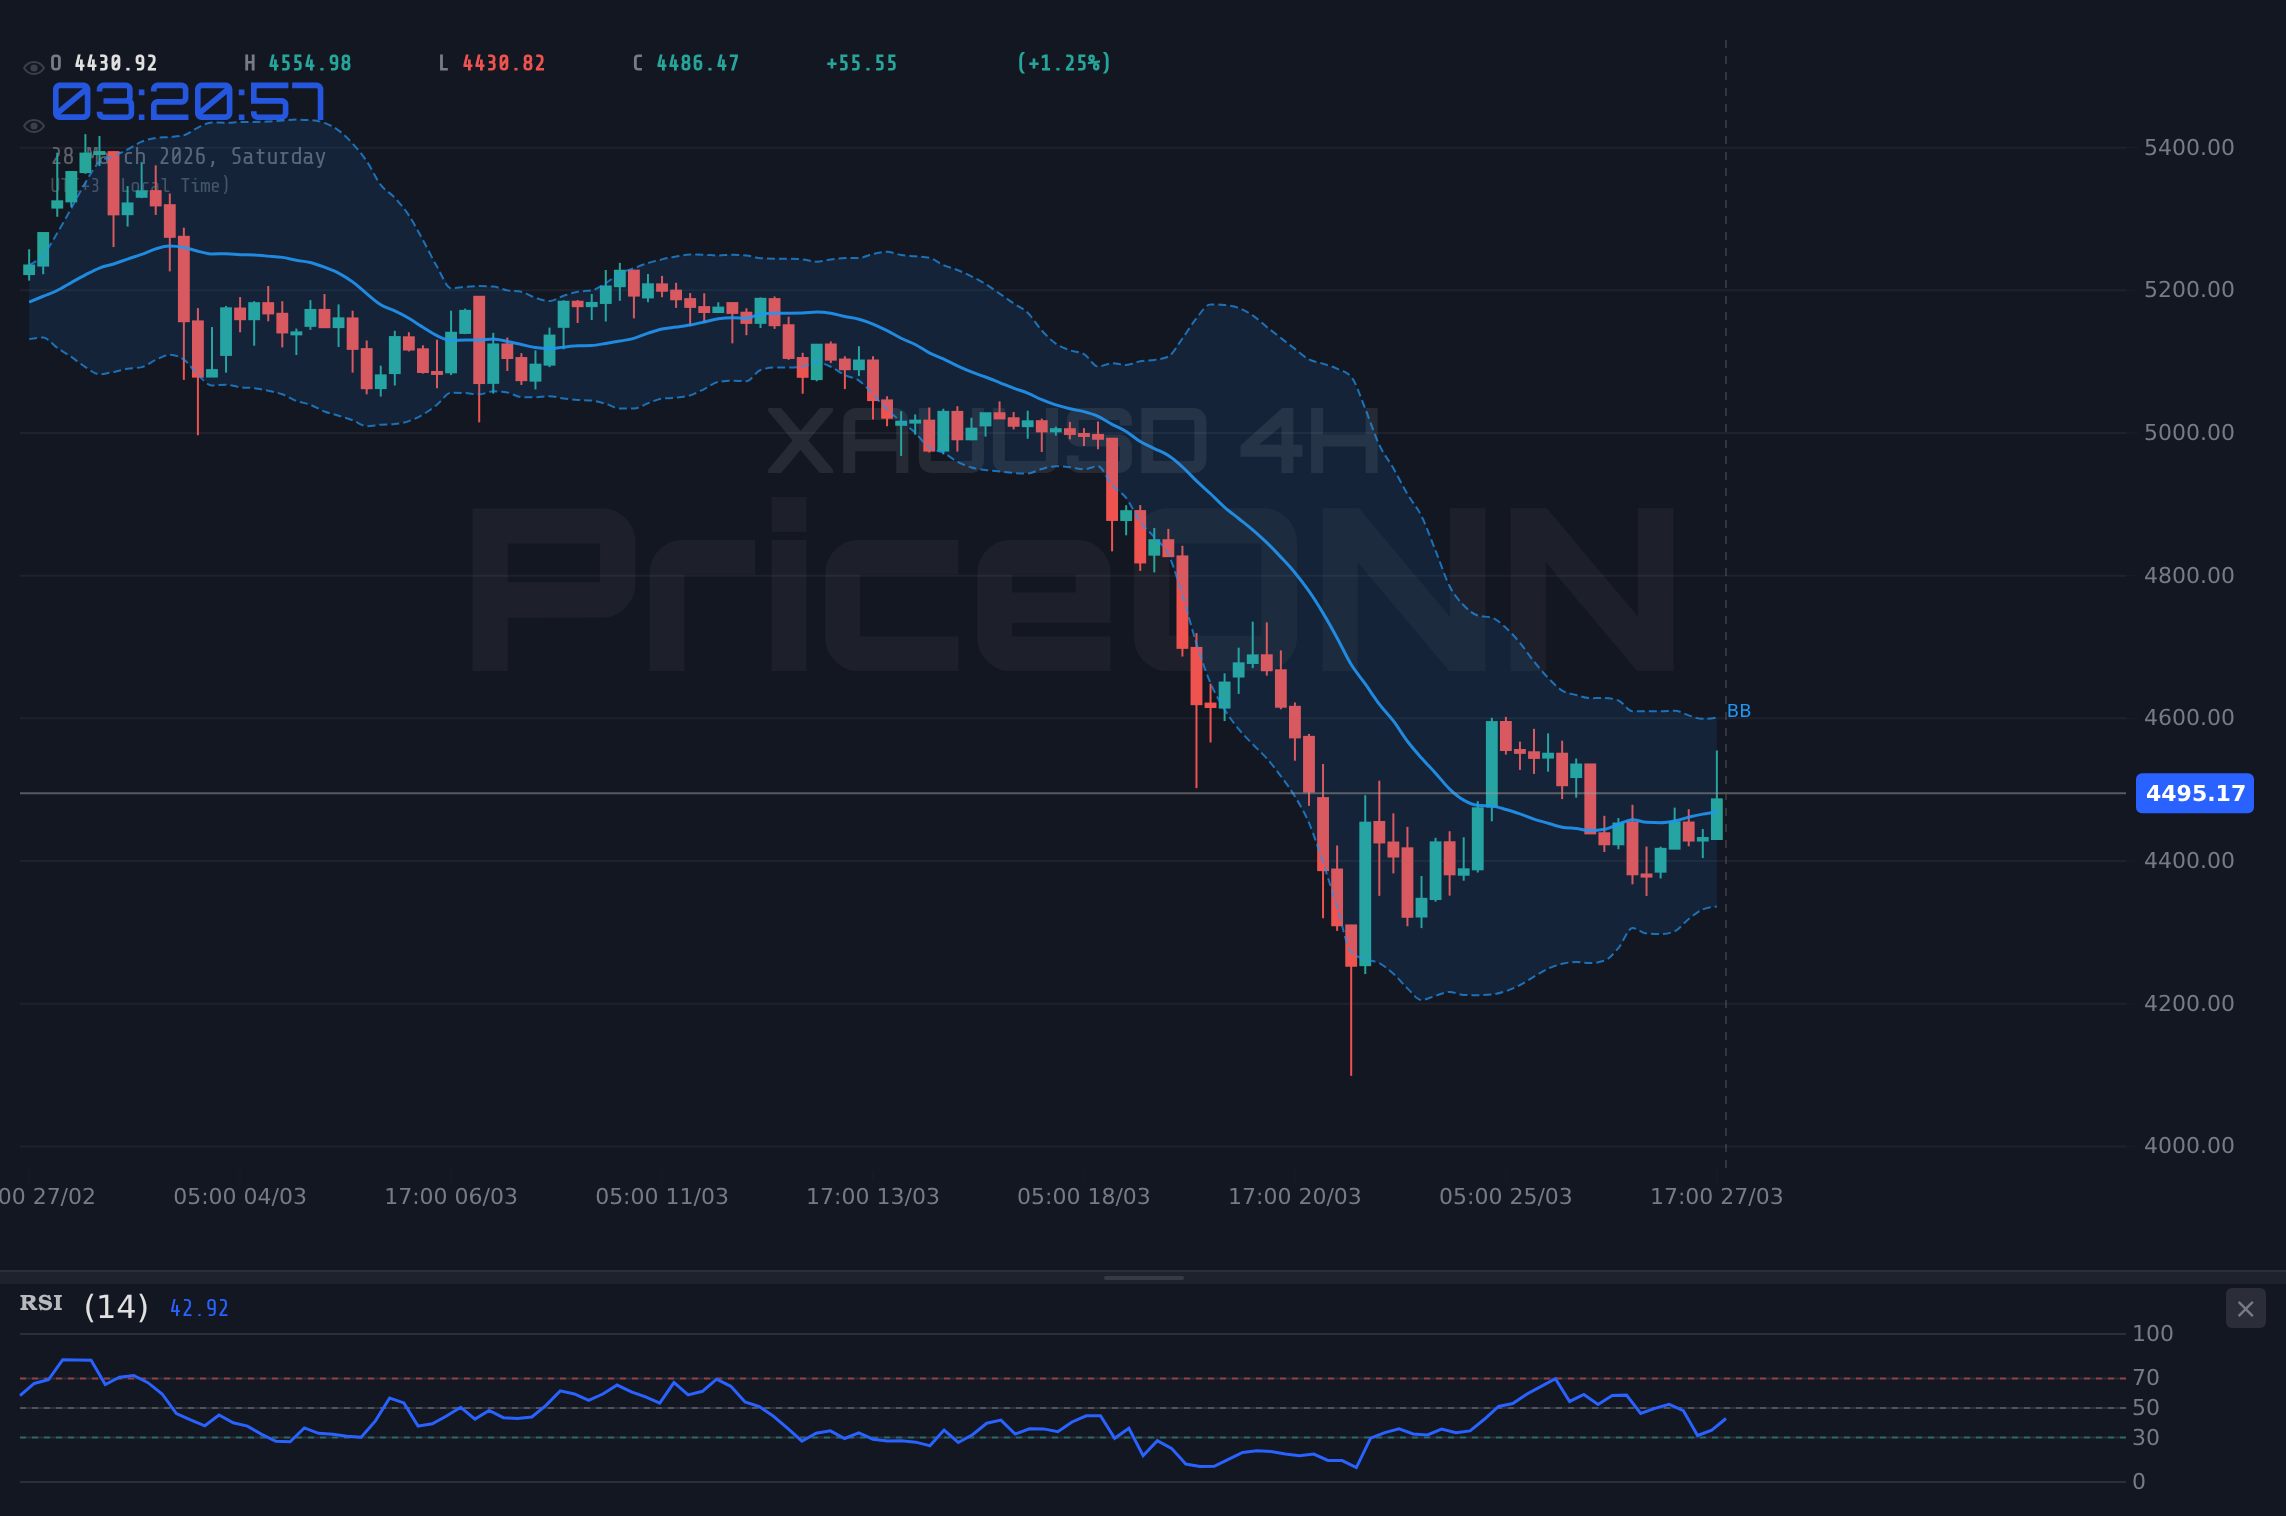
Moving to the 4-hour timeframe, the trend remains decidedly bearish, with a strong trend power indicated by the ADX at 16.8. While this is a weaker trend strength reading compared to the 1-hour chart, it still signifies a directional move. The RSI here is at 31.94, still in oversold territory, but less extreme than on the hourly chart. The MACD on the 4-hour chart also shows negative momentum, confirming the bearish bias. The Stochastic Oscillator readings, with %K at 2.97 and %D at 21.26, remain deeply oversold, suggesting that any bounce could be technically driven but unlikely to reverse the larger trend without further confirmation.
The daily chart presents an even starker picture. The DowJones30 is firmly entrenched in a downtrend, supported by a powerful ADX of 41.99, which signifies a very strong trend. The RSI at 26.8 is deeply oversold, and the MACD is negative, indicating sustained selling pressure. The Bollinger Bands are also showing the price below the middle band, reinforcing the bearish outlook. The Stochastic Oscillator's %K at 32.25 and %D at 33.33, while not as extreme as the shorter timeframes, still suggest further downside potential or consolidation within the existing downtrend. The sheer strength of the daily trend indicators suggests that any short-term bounces might be viewed as opportunities for sellers to re-enter the market rather than the start of a significant recovery.
Key Levels: The Battleground for the DowJones30
Understanding the critical support and resistance levels is crucial for interpreting the DowJones30's price action. Last week, the index tested crucial support around the $45,021 mark. This level has historically acted as a significant floor, and its breach, even if temporary, signals a potential shift in market psychology. If the price fails to reclaim this level decisively, it opens the door for further downside exploration.
On the resistance side, the $45,352.33 level, and more importantly, the $45,399.67 area, proved to be formidable barriers. The inability of buyers to push the index decisively above these points last week suggests that selling interest remains strong at higher prices. For any bullish reversal to gain traction, a sustained move and close above the $45,399.67 resistance, ideally followed by a retest and hold, would be necessary. Until then, the path of least resistance appears to be downwards, with the next significant support levels to monitor being $45,142.33 and then potentially much lower towards $44,781.33 if the bearish momentum continues unabated.
Fundamental Drivers: The Macroeconomic Undercurrents
The recent downturn in the DowJones30 cannot be solely attributed to technical factors. A complex web of macroeconomic fundamentals and geopolitical events is shaping market sentiment. One of the most significant drivers remains the persistent inflation data. While there might be fluctuations, the underlying trend suggests that inflation is proving more stubborn than initially anticipated by some central banks. This has led to a reassessment of interest rate cut timelines, particularly from the US Federal Reserve.
Recent economic calendar data, although not explicitly detailed for the past few days beyond March 27th, likely reflected this inflationary concern. For instance, the reported USD figure of 6.926 for some economic indicator (likely CPI or a related inflation metric, given the context) significantly exceeded the forecast of -1.3 and previous data of 6.156. Such a reading would strongly reinforce the narrative that inflation is not cooling as rapidly as hoped, prompting the Fed to maintain a more hawkish stance or at least delay any easing measures. This expectation of higher-for-longer interest rates has a direct dampening effect on equity markets, as it increases borrowing costs for corporations and makes fixed-income investments relatively more attractive.
Furthermore, the ongoing geopolitical tensions, particularly in the Middle East, continue to exert upward pressure on oil prices. Brent crude, for example, surged 6.77% to $110.64, and WTI crude jumped 7.69% to $101.19. Higher energy costs have a ripple effect across the economy, contributing to inflation and potentially squeezing corporate profit margins. This inflationary component, fueled by supply-side shocks rather than demand-pull, presents a particularly challenging dilemma for central banks. The market's reaction to these factors has been a clear move towards de-risking, which is directly impacting indices like the DowJones30.
The recent news about India slashing fuel taxes and curbing exports amidst a deepening oil crisis, while a regional measure, highlights the global sensitivity to energy prices. This emphasizes how interconnected the global economy is and how localized supply-side issues can have far-reaching consequences, especially when combined with existing geopolitical risks that are already straining supply chains and driving up commodity costs. The market's interpretation of these events is crucial; if investors perceive these as persistent inflationary pressures that central banks cannot easily control, the bearish sentiment towards equities like the DowJones30 is likely to intensify.
Correlation Analysis: The Dollar's Dominance and Equity Selloff
The correlation between the US Dollar Index (DXY) and major equity indices like the DowJones30 has been a dominant theme in recent market movements. Last week, as the DXY climbed to 99.91, we observed a corresponding decline in the DowJones30. This inverse relationship is a critical factor for traders to monitor. A strengthening dollar typically makes US assets less attractive to foreign investors, while also potentially signaling a 'risk-off' environment where global capital flows towards perceived safe havens, including the dollar itself.
The data clearly illustrates this dynamic. With the DXY at 99.91, the DowJones30 is currently under pressure. This is further exacerbated by the broader equity market's decline; the S&P 500's 2% drop and the Nasdaq's 2.23% fall indicate a widespread aversion to risk. When major equity benchmarks are falling sharply, it often spills over into industrial averages like the DowJones30, as investors liquidate positions across the board. The fact that both the DowJones30 and other indices are moving in tandem to the downside, while the dollar strengthens, reinforces the prevailing risk-averse sentiment.
This correlation highlights the importance of the Federal Reserve's monetary policy stance. If the Fed continues to signal a hawkish bias due to persistent inflation, it could lead to further dollar strength and continued pressure on equities. Conversely, any sign of dovishness or a pivot would likely weaken the dollar and could provide a much-needed reprieve for the stock market. The market's interpretation of upcoming economic data, such as employment figures and inflation reports, will be crucial in shaping the direction of both the dollar and equity indices in the coming weeks.
Market Sentiment and Volatility
The prevailing market sentiment has undeniably shifted towards caution, bordering on fear. The sharp decline in the DowJones30, S&P 500, and Nasdaq indicates a significant risk-off sentiment. This is often characterized by investors moving away from growth stocks and cyclical assets towards safer havens like government bonds, gold, and the US dollar. The elevated RSI readings in oversold territory on shorter timeframes, while suggesting a potential for a short-term bounce, do not negate the underlying bearish sentiment that has taken hold.
Volatility has increased, as evidenced by the significant daily ranges seen across major indices. For the DowJones30, the daily range was from $45,021 to $46,241, a swing of over $1,200. This heightened volatility suggests uncertainty and increased speculative activity, with traders trying to capitalize on rapid price movements. The strong ADX values across different timeframes confirm that significant trends, in this case, downwards, are in play, leading to increased price swings as these trends unfold.
The implications of this sentiment shift are profound. It suggests that any positive economic news might be met with skepticism, and any negative news could be amplified. Investors are likely to remain on edge, awaiting clearer signals from central banks and concrete evidence of inflation abating. Until then, the focus will remain on risk management and identifying levels where significant selling or buying pressure might emerge. The current environment demands a disciplined approach, emphasizing capital preservation while looking for high-probability setups.
Looking Ahead: Key Events and Focus for Next Week
As we look towards the upcoming trading week, several key economic events and data releases will be critical in shaping the direction of the DowJones30. The market will be closely scrutinizing any further commentary from Federal Reserve officials regarding interest rate policy. With inflation proving sticky, the Fed's stance on potential rate cuts will remain a central theme. Any indication of a delayed easing cycle could further pressure equity markets.
Upcoming economic data releases will also be in sharp focus. While specific dates for the next week are not detailed in the provided calendar beyond March 27th, typical high-impact releases such as Non-Farm Payrolls (NFP), Consumer Price Index (CPI), and Purchasing Managers' Index (PMI) reports will be eagerly anticipated. For example, if a future NFP report shows a significant deviation from forecasts, similar to the USD indicator reading of 6.926 (vs -1.3 forecast) mentioned previously, it could trigger substantial market volatility. Such data will provide crucial insights into the health of the US economy and the trajectory of inflation, directly influencing Fed policy expectations and, consequently, stock market performance.
Geopolitical developments will continue to be a background factor, particularly concerning energy prices and supply chain stability. Any escalation or de-escalation in global hotspots could impact commodity prices and overall market sentiment. Traders will need to remain vigilant, monitoring these geopolitical narratives alongside the economic data calendar. The interplay between these factors will determine whether the current bearish trend in the DowJones30 continues, finds a bottom, or attempts a significant recovery.
Bearish Scenario: Continued Downside Pressure
70% ProbabilityNeutral Scenario: Consolidation and Indecision
20% ProbabilityBullish Scenario: Short-Term Bounce
10% ProbabilityFrequently Asked Questions: DowJones30 Analysis
What happens if the DowJones30 breaks below the $45,021 support level?
If the DowJones30 closes decisively below $45,021, the bearish scenario gains significant probability. This could trigger a move towards the next support at $44,781.33, as selling momentum is likely to accelerate.
Should I consider buying the DowJones30 at current levels around $45,077.50 given the oversold RSI?
Buying at current levels carries significant risk due to the strong bearish trend indicated by the ADX of 28.4 on the 1H chart. While the RSI is oversold, a confirmed break above $45,399.67 would be needed to signal a potential bullish reversal, making a buy at this stage a low-probability trade.
Is the MACD's negative momentum on the 1H chart a strong sell signal for the DowJones30?
The negative MACD momentum on the 1-hour chart, along with the oversold Stochastic readings, strongly supports the bearish outlook. It suggests that downward pressure is currently dominant and any upward moves may be short-lived corrections within the larger downtrend.
How will upcoming US economic data, like potential inflation figures, affect the DowJones30's trend?
Stronger-than-expected inflation data would likely reinforce the Fed's hawkish stance, potentially leading to further dollar strength and continued pressure on the DowJones30. Conversely, weaker inflation could prompt a reassessment of Fed policy, offering a potential reprieve for the index.
| Indicator | Value | Signal | Interpretation |
|---|---|---|---|
| RSI (14) | 22.17 | Oversold | Extreme oversold conditions on 1H, suggesting potential bounce but not trend reversal. |
| MACD | Negative Momentum | Bearish | Confirms downward pressure on 1H and 4H charts. |
| Stochastic | K=2.52, D=10.07 (1H) | Oversold | Deeply oversold, indicates potential for short-term rebound but within a downtrend. |
| ADX | 28.4 (1H) | Strong Trend | Confirms a strong bearish trend, indicating committed selling pressure. |
| Bollinger Bands | Price below Middle Band | Bearish | Reinforces bearish outlook, indicating downside pressure. |
Track markets in real-time
AI-powered analysis, technical indicators and real-time price data.
Join Our Telegram Channel
Breaking market news, AI analysis and trading signals instantly.
Join Channel