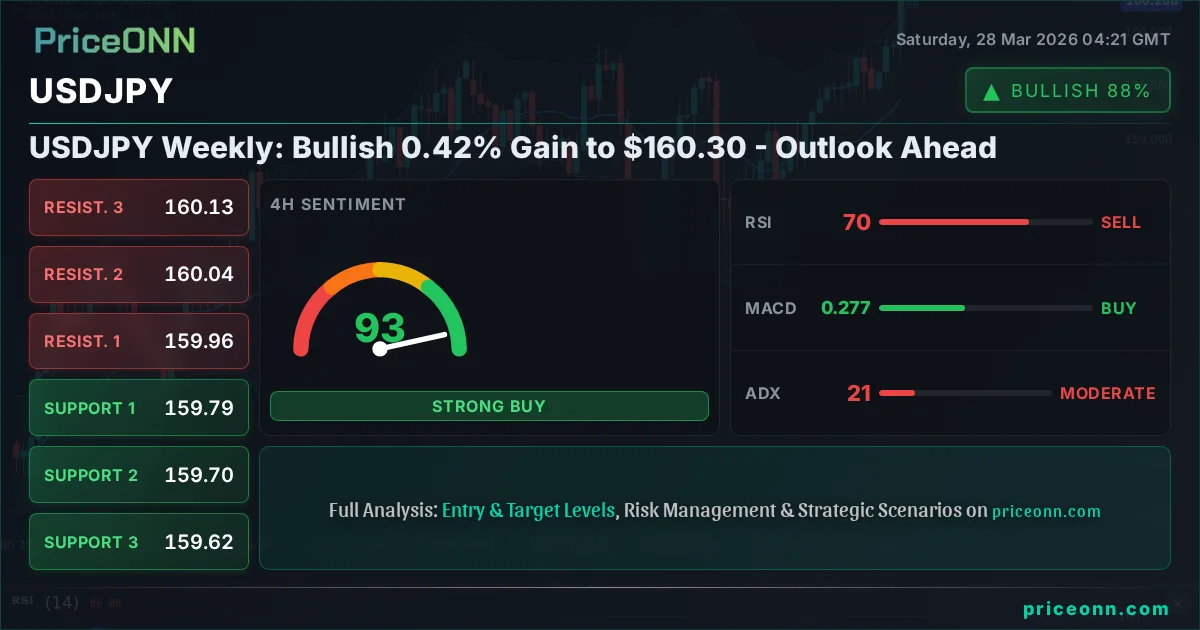
USDJPY Weekly: Bullish 0.42% Gain to $160.30 - Outlook Ahead
USDJPY closed last week at $160.30, up 0.42%. Explore the bull vs. bear case, key levels, and economic drivers shaping the pair's outlook.
The currency markets are abuzz with the ongoing tension surrounding USDJPY. Last week saw the pair close at a significant $160.30, marking a notable 0.42% gain. This level is not just a number; it represents a critical battleground where bulls and bears are fiercely contesting control. As we step into a new trading week, the fundamental underpinnings and technical signals offer a complex, yet compelling, picture. Is this upward momentum sustainable, or are we witnessing a temporary reprieve before a potential reversal? This analysis delves into the core arguments for both sides, scrutinizing the economic data, central bank policies, and geopolitical undercurrents that are shaping the narrative for USDJPY.
- USDJPY closed last week at $160.30, with RSI at 63.12 indicating a neutral-to-bullish leaning on the daily chart.
- Critical resistance is at $160.45, a level that, if breached decisively, could target higher levels; support sits firmly at $159.89.
- The MACD histogram shows positive momentum, suggesting underlying strength, but caution is warranted due to Stochastic's overbought readings at 87.75.
- Fed rate expectations and intervention fears are key drivers, creating a tug-of-war that influences USDJPY's correlation with the DXY.
The narrative for USDJPY has been dominated by the widening interest rate differential between the US and Japan, coupled with persistent intervention fears surrounding the Japanese Yen. Last week's price action, culminating in a $160.30 close, underscores this dynamic. The bulls point to the sheer momentum and the fundamental divergence in monetary policy, while the bears highlight the significant YTD lows the Yen has hit and the increased probability of Japanese authorities stepping in to defend their currency. Understanding this push and pull is crucial for navigating the upcoming trading sessions. The strength of the US Dollar Index (DXY), which ended the week near 99.91, also plays a pivotal role, often exhibiting an inverse correlation with USDJPY's movements, though this relationship can shift based on specific market drivers.
Furthermore, the global risk sentiment, often reflected in major equity indices like the S&P 500 and Nasdaq, provides an essential backdrop. Last week's sharp declines in these indices, with the S&P 500 closing down 2% at 6357.55 and the Nasdaq dropping 2.23% to 23092.5, signaled a potential shift towards risk aversion. Such environments typically favor safe-haven assets, which can, paradoxically, put pressure on currencies like the USD, even as it acts as a safe haven itself. However, the Yen's role as a safe haven is often overshadowed by its sensitivity to interest rate differentials and the threat of intervention. This complex interplay means that a risk-off move doesn't automatically translate to Yen strength if the yield advantage of the US dollar remains dominant.
The energy markets, particularly Brent crude oil at $110.64 and WTI at $101.19, also warrant attention. The significant price jumps in oil last week, driven by geopolitical tensions in West Asia and supply concerns, contribute to broader inflationary pressures. While higher oil prices can weaken currencies in import-dependent nations, they can also strengthen the US dollar through their association with global economic stability and potential Fed tightening. For Japan, a net energy importer, rising oil prices exacerbate its trade deficit, potentially adding further downward pressure on the Yen.
The Bull Case: Momentum and Monetary Policy Divergence
The bullish argument for USDJPY is primarily anchored in the stark contrast between the US Federal Reserve's stance and the Bank of Japan's (BoJ) evolving policy. While the Fed has maintained a hawkish tone, signaling a data-dependent approach but with a clear bias towards keeping rates elevated to combat persistent inflation, the BoJ is in the nascent stages of normalizing its ultra-loose monetary policy. This divergence in interest rate expectations is a powerful driver for carry trades, where investors borrow in a low-yield currency (like the JPY) to invest in higher-yielding assets (like US Treasuries). The 1D RSI for USDJPY stands at 63.12, reflecting a healthy bullish momentum without yet entering the extreme overbought territory that might signal an imminent pullback. This suggests that the upward trend has room to extend, supported by the positive MACD histogram which indicates growing bullish momentum.
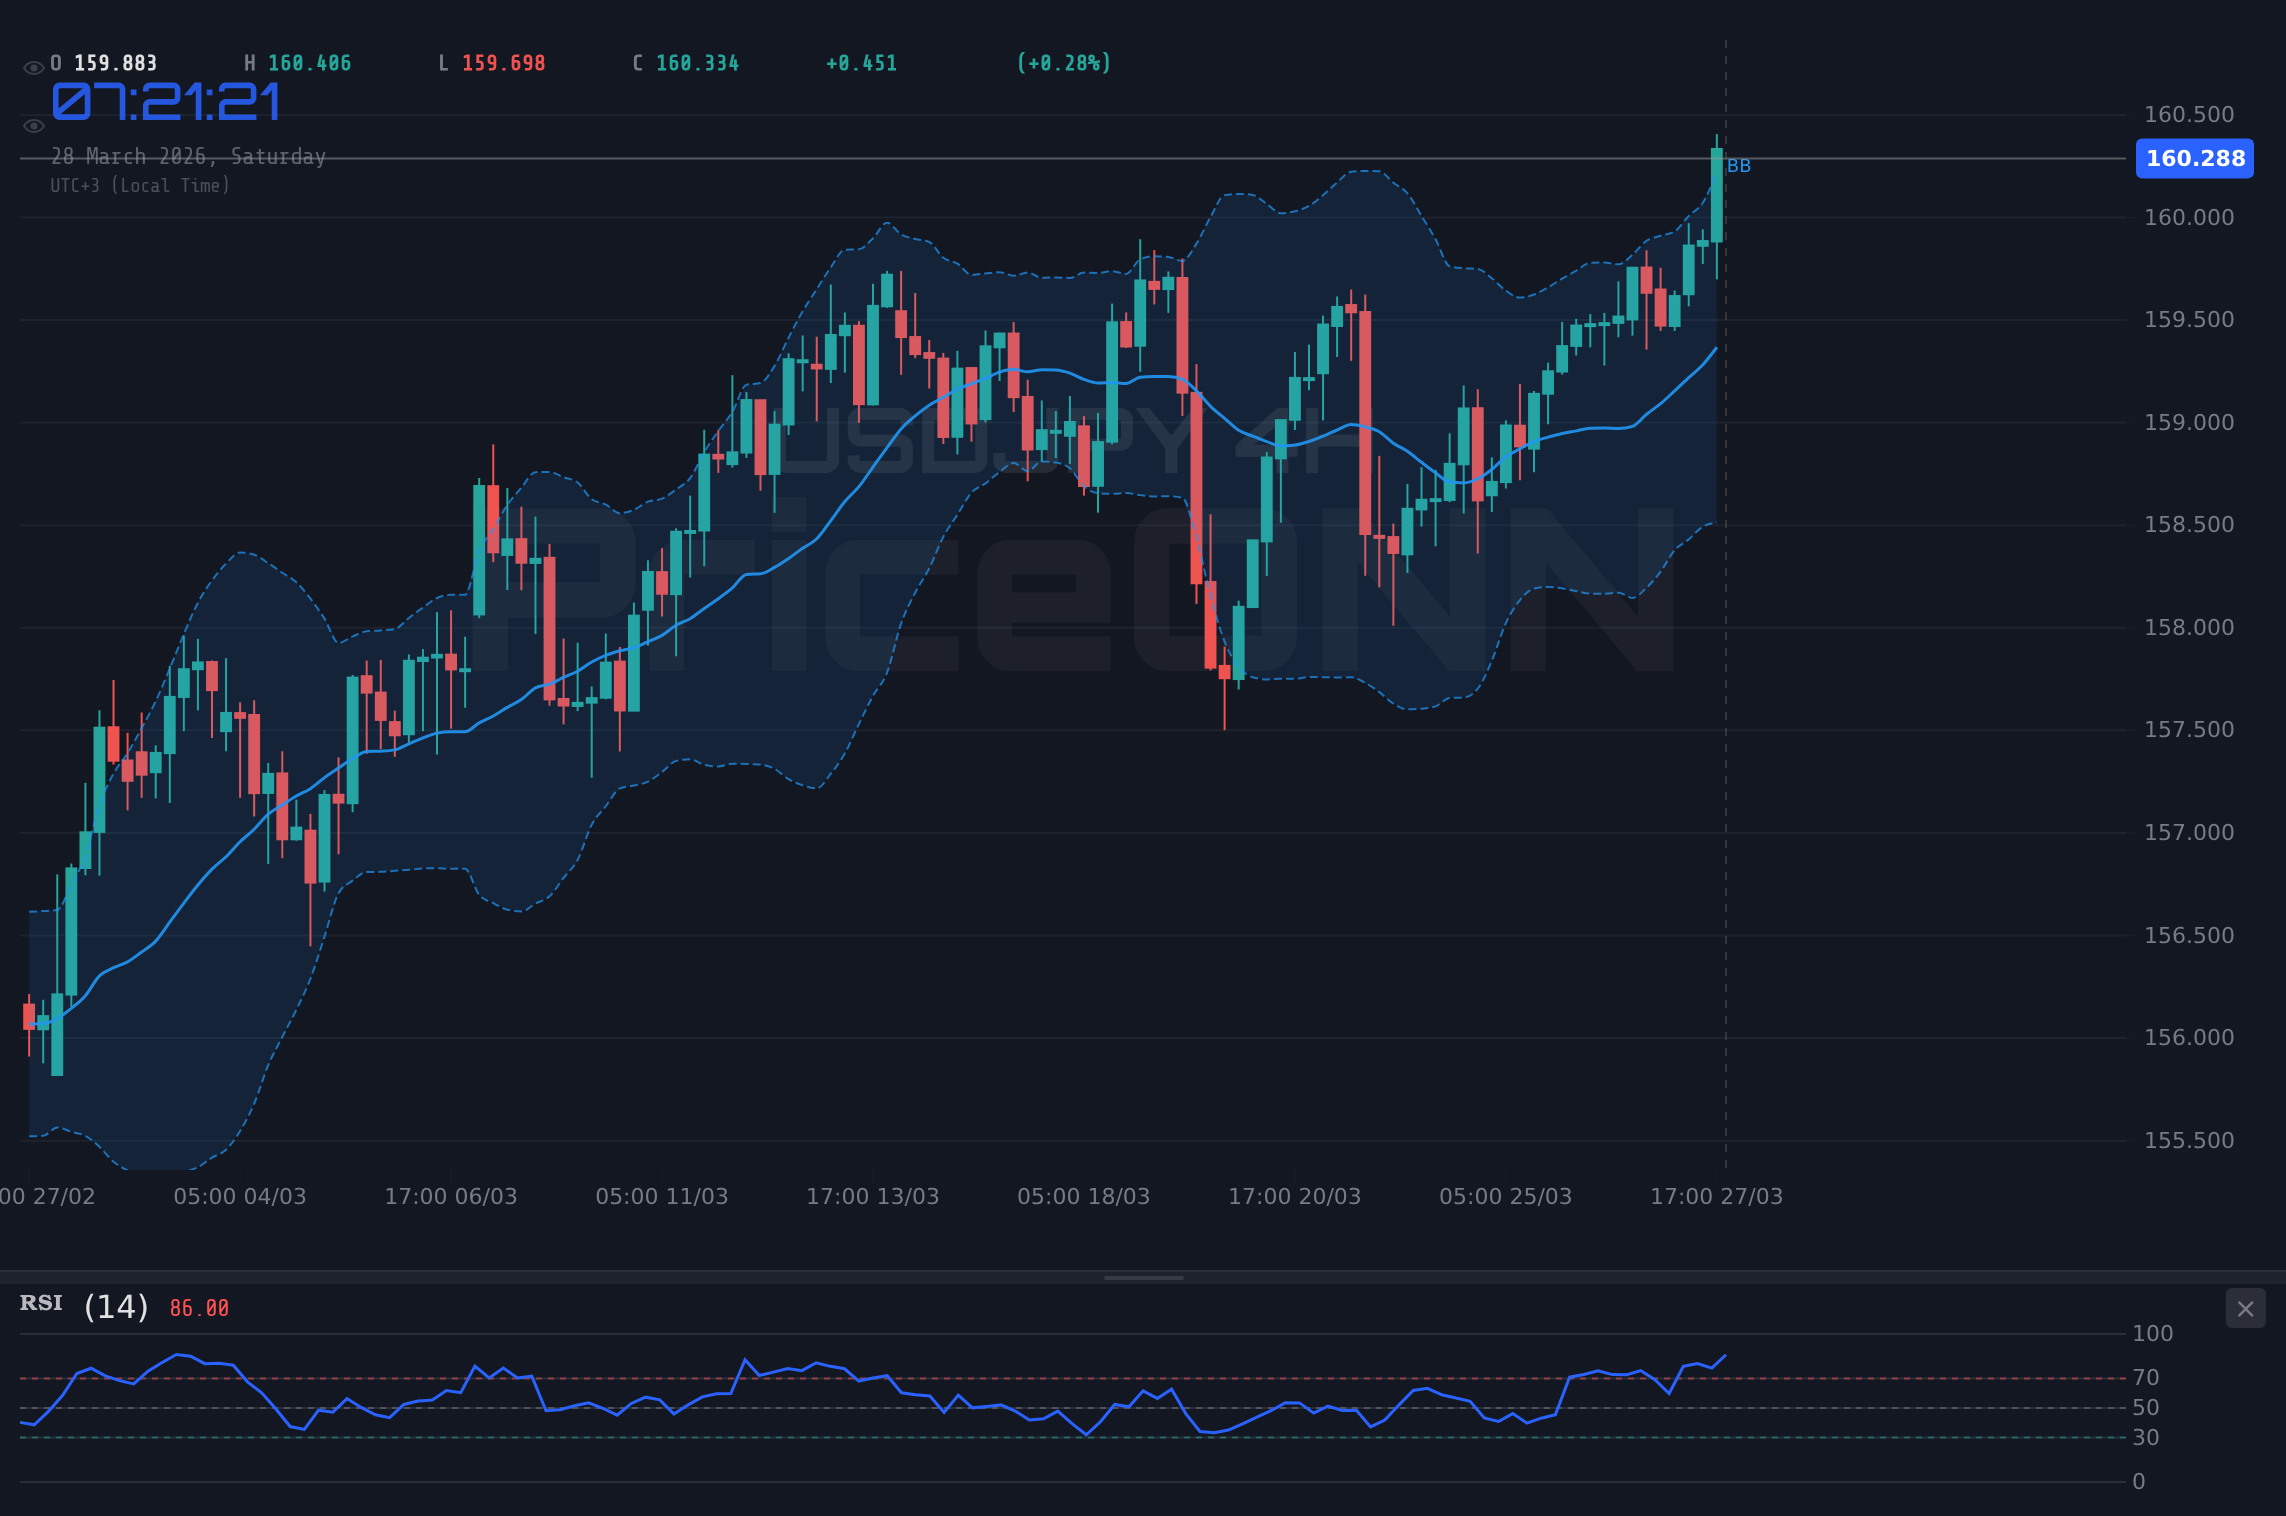
Looking at the 4-hour chart, the ADX at 21.13 confirms a moderate-to-strong uptrend, reinforcing the bullish sentiment. The Stochastic indicator, with %K at 87.36 and %D at 77.93, is in overbought territory, which is a warning sign for the short-term, but in a strong uptrend, these indicators can remain elevated for extended periods. The key is that the %K line has not yet crossed below the %D line in a significant way, so while a consolidation or minor pullback is possible, the overall trend remains bullish. The price action itself, consistently trading above the middle Bollinger Band on the 1D and 4H charts, further supports the idea that buyers are in control, pushing the pair higher.
The recent news flow also leans into the bullish narrative for USDJPY, at least from the perspective of maintaining the rate differential. While there are whispers of potential intervention by Japanese authorities if the Yen weakens too rapidly, the former BoJ Governor Kuroda's recent comments urging the central bank to persist with policy normalization suggest a degree of tolerance for Yen weakness, at least in the short to medium term. This lack of aggressive signaling from the BoJ allows the interest rate differential to remain the dominant factor. Furthermore, the DXY's robust performance, closing the week near 99.91, provides a tailwind. A strong dollar generally supports USDJPY, especially when that strength is driven by higher US interest rate expectations, which is precisely the current macro backdrop.
The Bear Case: Intervention Fears and Yen's Safe-Haven Appeal
Conversely, the bearish case for USDJPY hinges on the extreme speed and magnitude of the Yen's depreciation and the inherent risks associated with such rapid moves. The Yen has hit multi-month, and in some cases, multi-decade lows against the dollar, raising concerns about imported inflation and economic stability in Japan. The Ministry of Finance and the Bank of Japan have been increasingly vocal, hinting at potential intervention if currency moves become too volatile or speculative. While no direct intervention occurred last week, the mere threat can be enough to curb aggressive bullish bets. The fact that USDJPY is hovering near the psychologically significant 160.00 level amplifies these concerns. If Japanese authorities decide to act, we could see a sharp, sudden reversal.
Technically, while the daily chart shows bullish momentum (RSI 63.12, positive MACD histogram), the longer-term picture and shorter-term signals introduce doubt. On the 1-hour chart, the ADX at 44.45 indicates a strong downtrend in the Yen's value, but the RSI at 37.14 and Stochastic's %K below %D suggest that the momentum may be waning or that a short-term bounce is due. More critically, on the 1-day chart, while the overall trend is bullish, the Stochastic indicator is showing %K at 87.75 and %D at 61.64, indicating an overbought condition that historically precedes pullbacks. The ADX at 30.99 on the daily chart, while indicating a strong downtrend in the Yen's value, also suggests that the trend has been in place for some time and could be susceptible to a reversal.
The correlation with risk sentiment also plays into the bear case. Last week's significant sell-off in global equities, with the S&P 500 and Nasdaq experiencing sharp declines, suggests a potential global deleveraging event or a flight to safety. While the US dollar often benefits from such moves, the Yen historically acts as a safe-haven currency. If global economic fears intensify, driven by geopolitical events or a sharp economic slowdown, investors might unwind their Yen-funded carry trades, leading to a rapid appreciation of the Yen and a sharp decline in USDJPY. The fact that Brent crude oil prices surged significantly last week, potentially signaling inflationary pressures that could lead to slower global growth, adds another layer of concern for the bullish USDJPY narrative.
The Battle for $160.30: Levels and Scenarios
The price action around the $160.30 mark is where the battle between bulls and bears will likely be decided in the short term. For the bulls, holding the current levels and pushing higher requires breaking through immediate resistance. The first significant resistance level on the 1-hour chart is at $160.34, followed by $160.44 and $160.49. A decisive break and hold above $160.49 could open the door for a move towards the 4-hour resistance at $160.97, and potentially higher towards $161.13. The bullish scenario is further validated if the DXY remains strong and if Japanese authorities signal continued tolerance for Yen weakness. The 1D RSI at 63.12 provides ample room for further upside before reaching extreme overbought levels.
Conversely, the bears are looking for any sign of weakness to capitalize on the overbought conditions and intervention fears. The immediate support level on the 1-hour chart is $160.19, followed by $160.14 and $160.05. A break below $160.05 could signal a short-term reversal, potentially testing the 4-hour support at $159.79. Further downside could target $159.69 and then $159.62. The daily chart's support levels at $159.33, $159.02, and $158.76 become critical if a more significant reversal takes hold. Bearish confirmation would likely come from vocal warnings from Japanese officials, a sharp uptick in risk aversion globally, or a sustained drop in the DXY. The Stochastic oscillator on the daily chart, nearing overbought territory at 87.75, suggests that a pullback is technically due, even if the trend remains bullish.
The neutral scenario anticipates a period of consolidation around the current $160.30 level as both sides await clearer signals. This could involve trading within a defined range, perhaps between the 1-hour support of $160.05 and resistance of $160.49. In such a scenario, traders would look for confirmation from other indicators or external factors before committing to a directional trade. The ADX on the 1-hour chart at 44.45 suggests a strong trend is in place, making a prolonged consolidation less likely unless there's a significant shift in market drivers. However, if major economic events are scheduled for the coming week, such as key US inflation or employment data, or any significant statements from the BoJ, a period of indecision and range-bound trading is a distinct possibility.
Bearish Scenario: Intervention Fears Loom Large
25% ProbabilityNeutral Scenario: Consolidation Around $160.30
50% ProbabilityBullish Scenario: Momentum Continues
25% ProbabilityEconomic Calendar: Key Catalysts for USDJPY
The economic calendar for the upcoming week holds several high-impact events that could significantly influence the USDJPY pair. On the US side, attention will be keenly focused on inflation data, particularly the upcoming CPI and PCE releases, which will be crucial in shaping the Federal Reserve's future monetary policy decisions. Any indication that inflation remains sticky could bolster the case for higher-for-longer interest rates in the US, thereby strengthening the dollar and pushing USDJPY higher. Conversely, signs of cooling inflation might lead to expectations of earlier rate cuts, potentially weakening the dollar.
The market will also be scrutinizing US employment figures, such as Non-Farm Payrolls (NFP) and Average Hourly Earnings. Stronger-than-expected job growth and wage inflation would reinforce the bullish case for the dollar, while weaker figures could prompt a reassessment of the Fed's rate path. The University of Michigan Consumer Sentiment survey, along with PMI data, will provide further insights into the health of the US economy, impacting risk appetite and dollar demand.
From the Japanese perspective, upcoming data releases, while perhaps less impactful than US inflation figures, will still be closely watched. Any comments or hints from the Bank of Japan regarding their policy normalization path or their stance on Yen weakness will be critical. While no specific high-impact events are listed for Japan in the immediate upcoming week based on the provided data, the ongoing narrative around potential policy shifts and the impact of imported inflation due to Yen weakness remains a key fundamental driver. The market will be looking for any signals that might indicate a shift away from the current ultra-loose policy, which could provide some support for the Yen.
The correlation between USDJPY and the DXY is also a critical factor to monitor. The DXY's movement, influenced by US economic data and Fed expectations, often dictates the broader trend for USDJPY. Last week, the DXY showed strength, ending near 99.91, which aligned with USDJPY's upward move. If the DXY continues its ascent, it will likely provide further support for USDJPY. However, if US data disappoints and leads to a reassessment of Fed policy, the DXY could weaken, putting downward pressure on USDJPY, especially if intervention fears begin to materialize.
Navigating the Volatility: What Traders Should Watch
For traders looking to navigate the complex landscape of USDJPY, a multi-faceted approach is essential. The current technical picture presents conflicting signals across different timeframes. While the daily and 4-hour charts exhibit bullish trends, the shorter-term 1-hour timeframe shows signs of waning momentum and potential for a pullback. The RSI at 63.12 on the daily chart is healthy, but the Stochastic oscillator on the same timeframe reaching 87.75 suggests overbought conditions, signaling caution for aggressive long positions without further confirmation.
The key levels identified - $160.05 as immediate support and $160.49 as immediate resistance on the 1-hour chart - will be critical in dictating the short-term direction. A decisive break above resistance, confirmed by volume and sustained price action, could open the path towards $160.97. Conversely, a break below support, especially if accompanied by dovish shifts in Fed expectations or explicit intervention warnings from Japan, could lead to a rapid decline towards $159.79 and potentially lower.
The threat of intervention cannot be overstated. Japanese authorities have the capacity and the will to step into the market if they deem the Yen's weakness to be excessive and detrimental to the economy. Any official statements or actions signaling such intent could lead to sharp reversals, regardless of the underlying fundamental or technical setup. Therefore, risk management must be paramount. Traders should consider tighter stop-losses and perhaps smaller position sizes when trading around the 160.00 psychological level, especially given the potential for sudden volatility.
The correlation with global risk sentiment is another factor to monitor. Last week's equity market sell-off suggests that risk aversion could be on the rise. If this trend continues, it might not necessarily lead to Yen strength if the interest rate differential remains the primary driver. However, a severe global downturn could trigger a flight to safety that includes unwinding of carry trades, thus benefiting the Yen. Keeping an eye on the S&P 500 and Nasdaq, as well as commodity prices like Brent crude, will provide clues about the prevailing market mood and its potential impact on USDJPY.
| Indicator | Value | Signal | Interpretation |
|---|---|---|---|
| RSI (14) | 63.12 | Neutral | Bullish momentum, but approaching overbought territory on daily. |
| MACD Histogram | Positive | Bullish Momentum | Suggests underlying upward pressure is growing. |
| Stochastic | K=87.75, D=61.64 | Overbought | Daily Stochastic signals potential for a pullback or consolidation. |
| ADX | 31.98 | Strong Trend | Confirms a strong downtrend in Yen value on the daily chart. |
| Bollinger Bands | Middle Band | Watch | Price is above the middle band, indicating bullish bias on daily. |
Frequently Asked Questions: USDJPY Analysis
What happens if USDJPY breaks decisively above the $160.45 resistance level?
A sustained break above $160.45, especially if confirmed by positive economic data and lack of intervention warnings, could trigger further upside towards the 4-hour resistance at $160.97. This would signal continued bullish momentum driven by interest rate differentials.
Should I consider buying USDJPY at current levels around $160.30 given the daily RSI is at 63.12?
Buying at current levels carries risk due to the approaching overbought territory indicated by the daily Stochastic at 87.75. A more prudent approach might be to wait for a pullback towards support around $160.05 or confirmation of a breakout above $160.49, which would offer a better risk-reward ratio.
Is the daily Stochastic reading of 87.75 a strong sell signal for USDJPY right now?
While an RSI of 87.75 indicates an overbought condition, it is not an immediate sell signal in a strong uptrend. It suggests that the pair may be due for a consolidation or a minor pullback. Traders should look for confirmation, such as a bearish MACD crossover or vocal intervention threats, before considering a short position.
How will upcoming US inflation data impact USDJPY this week?
Higher-than-expected US inflation data would likely strengthen the US dollar and push USDJPY higher, reinforcing the Fed's hawkish stance. Conversely, softer inflation figures could lead to expectations of Fed rate cuts, weakening the dollar and potentially causing USDJPY to fall, especially if it coincides with intervention fears.
The path ahead for USDJPY remains a compelling narrative of diverging monetary policies, intervention risks, and shifting global risk sentiment. While the bulls have held the upper hand, closing the week at $160.30, the technical indicators and the sheer psychological significance of the 160.00 level present a formidable challenge. The key will be how market participants digest upcoming US inflation data and any subtle signals from Tokyo regarding currency stability. Patient traders who manage risk diligently and wait for clear confirmation signals will be best positioned to capitalize on the inevitable volatility.
Track markets in real-time
AI-powered analysis, technical indicators and real-time price data.
Join Our Telegram Channel
Breaking market news, AI analysis and trading signals instantly.
Join Channel