SP500 Analysis: $6,357.55 Levels Tested Amidst Steep Weekly Decline
The SP500 closed around $6,357.55 after a significant weekly drop. Key support at $6,309.37 is now in focus as bearish momentum intensifies.
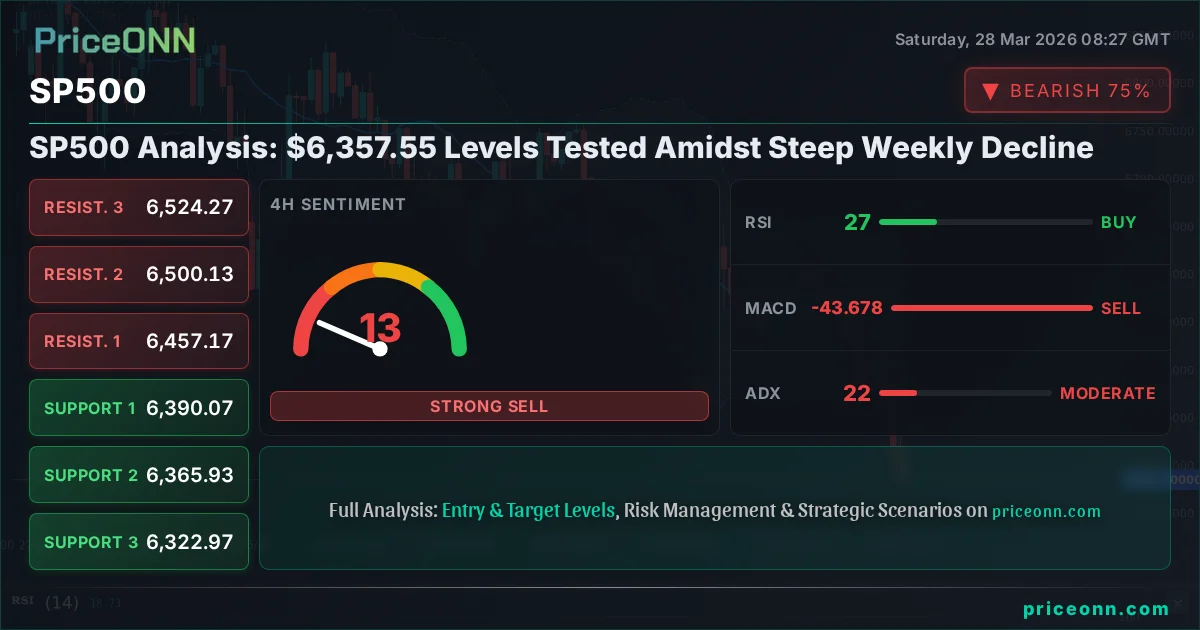
The S&P 500 experienced a brutal week, closing near $6,357.55 following a sharp 2.08% decline on Friday alone. This significant drop, part of a broader market sell-off that saw the index shed approximately 129.75 points, has brought critical support levels into sharp focus for the upcoming trading week. The question on every trader's mind is whether the current levels can hold, or if the downward pressure will continue to build, testing even lower ground. This analysis delves into the technical indicators, fundamental drivers, and geopolitical undercurrents shaping the S&P 500's trajectory, offering a comprehensive outlook for the week ahead.
- The SP500 closed the week at $6,357.55, marking a significant weekly decline driven by bearish momentum.
- Critical support is now observed at $6,309.37, a level that has historically proven significant and is being closely watched.
- The RSI reading of 26.73 on the daily chart indicates extreme oversold conditions, suggesting potential for a short-term bounce, but the strong downtrend signals caution.
- With the DXY strengthening to 99.91 and geopolitical tensions escalating, risk-off sentiment is prevailing, putting further pressure on equity markets.
Navigating the Downturn: A Deep Dive into the SP500's Recent Performance
The Week That Was: A Cascade of Selling Pressure
Last week was undeniably one to forget for S&P 500 investors. The index succumbed to intense selling pressure, culminating in a sharp decline on Friday that erased recent gains and pushed the market into potentially oversold territory. The daily close at $6,357.55 represents a significant psychological and technical level, but the sheer force of the sell-off suggests that this may only be a temporary reprieve. Looking back at the week's price action, we saw a clear rejection from higher resistance levels, followed by a steady erosion of support as the trading week progressed. This wasn't a sudden crash, but rather a consistent, almost methodical, unwinding of positions, indicating a broad-based shift in market sentiment.
The daily range on Friday, from $6,346.5 to $6,522, highlights the intraday volatility traders faced. However, the closing price near the low of the day speaks volumes about the prevailing bearish sentiment. This downward momentum wasn't confined to a single sector; rather, it appeared to be a systemic risk-off event, impacting growth stocks and more defensive names alike. Understanding the drivers behind this sell-off is crucial for positioning oneself for the week ahead. Was it a reaction to macroeconomic data, a geopolitical shockwave, or simply a technical breakdown that triggered algorithmic selling?
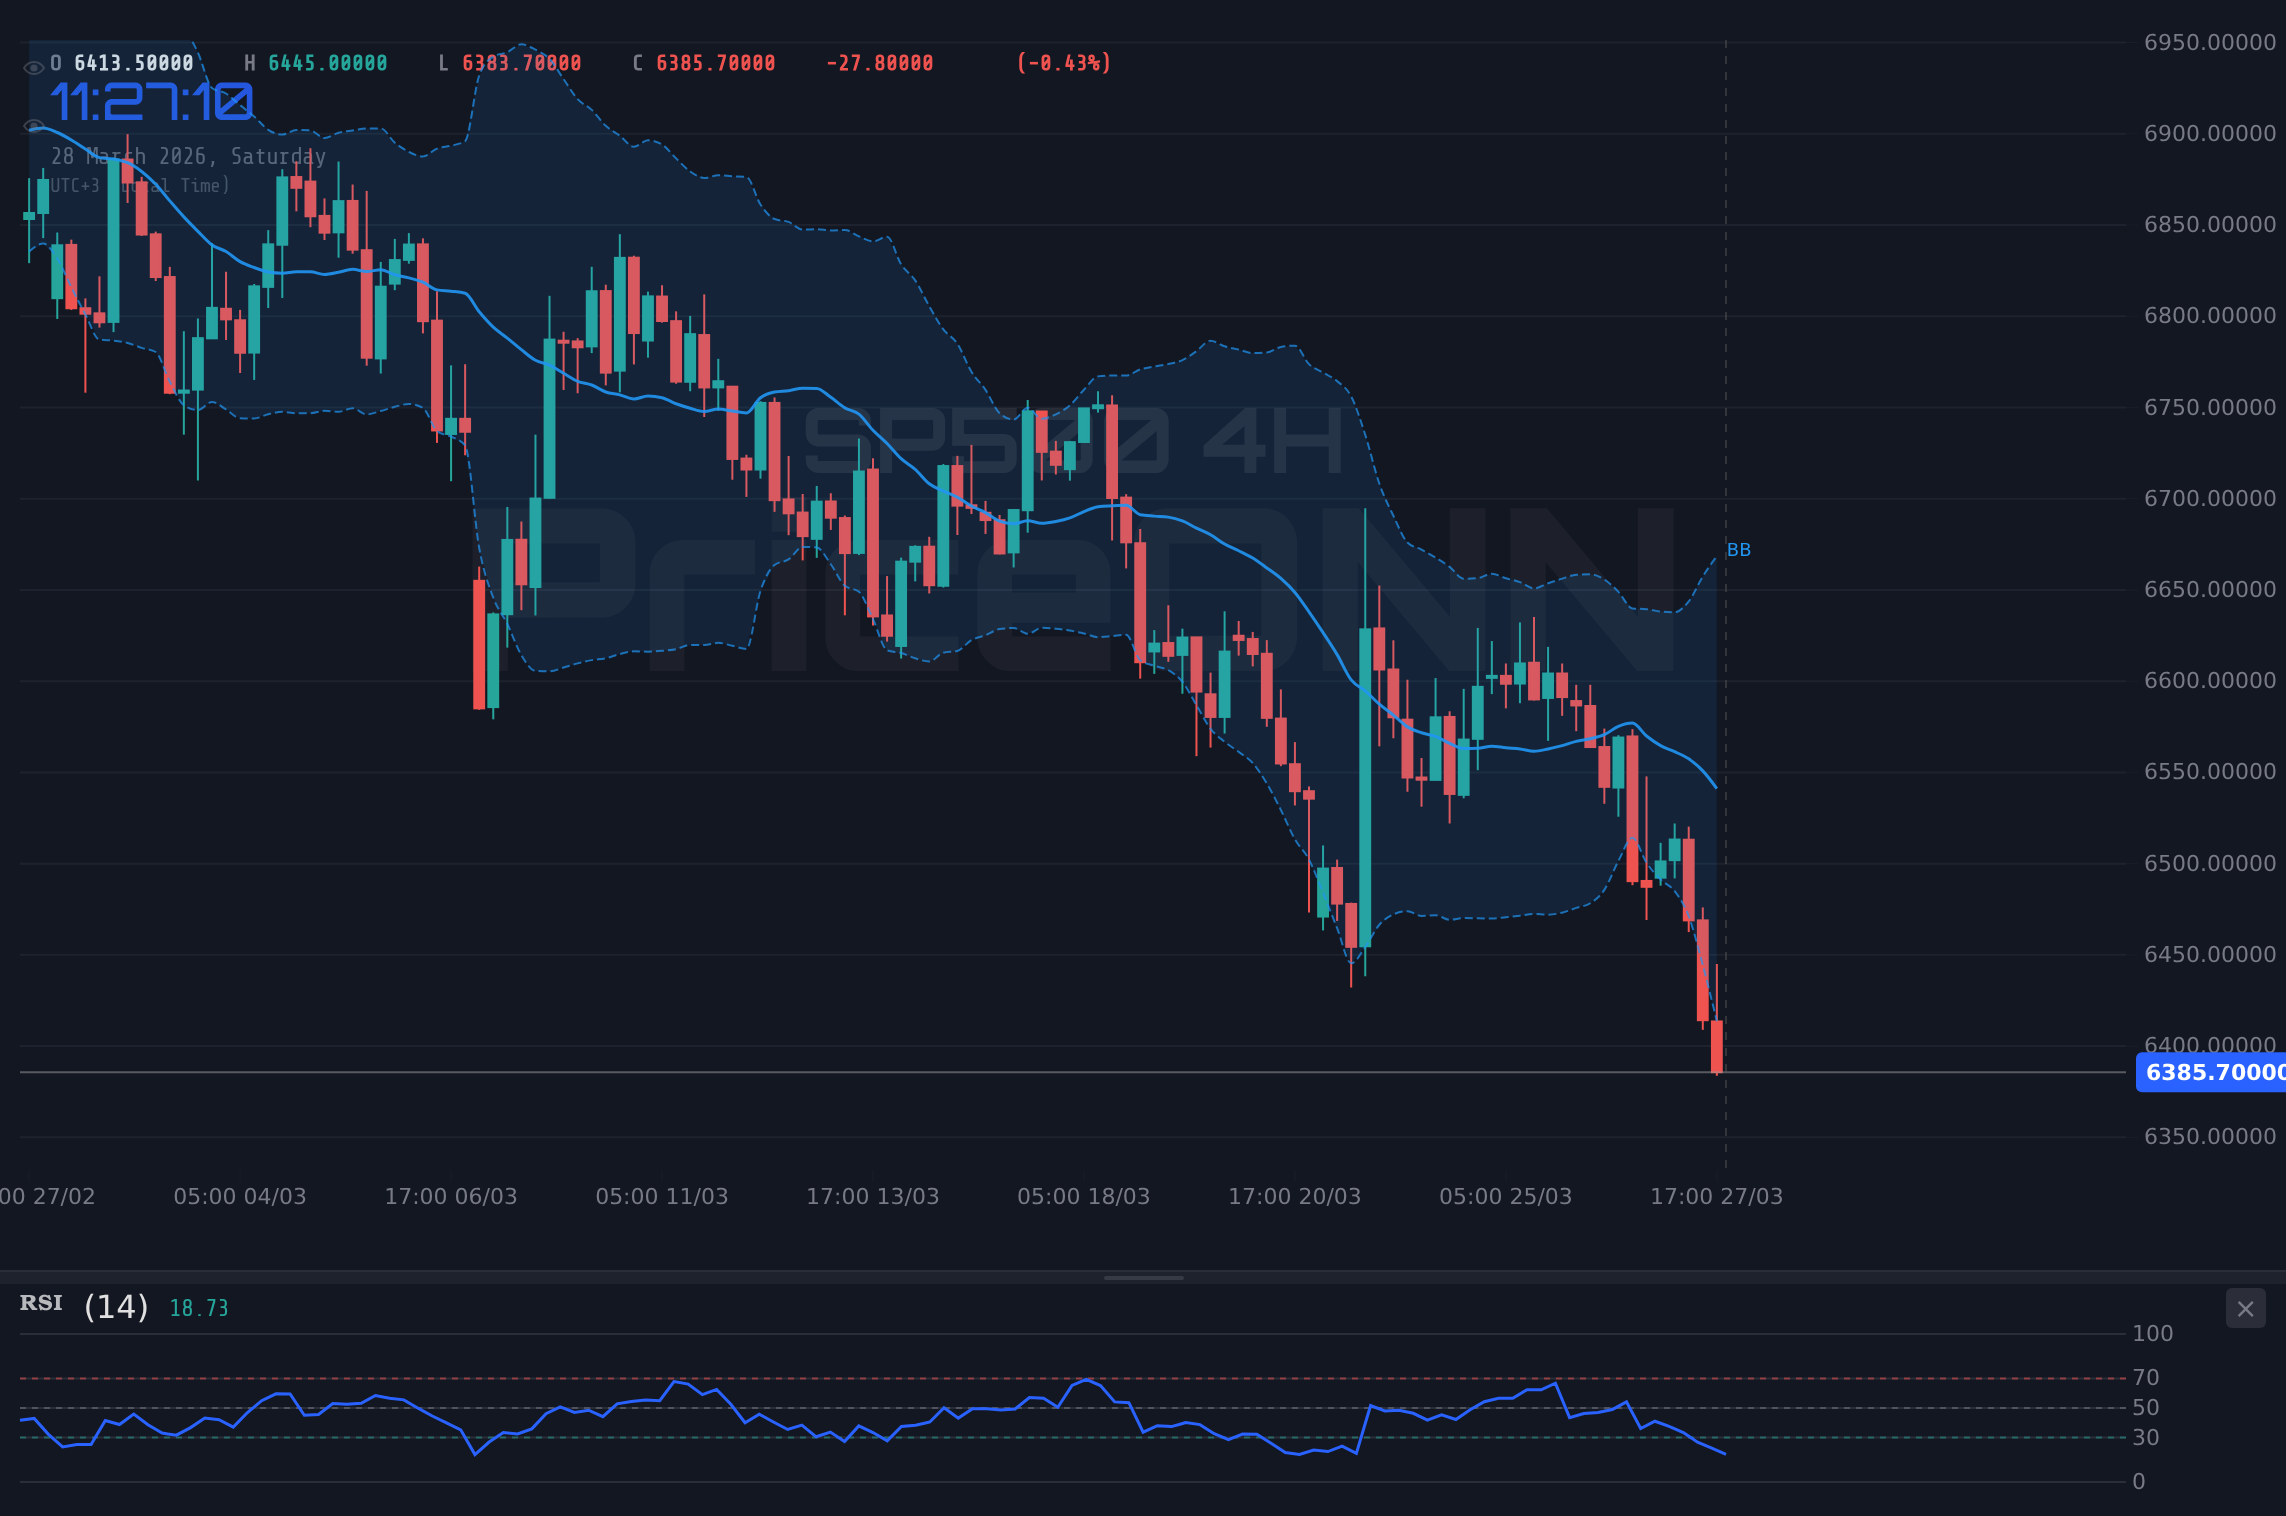
The strength of the downtrend is further underscored by the technical indicators. On the 1-day timeframe, the ADX is a robust 47.68, signaling a very strong downward trend. This isn't the kind of environment where one typically looks for quick reversals. The RSI at 26.73, while technically oversold, can remain in oversold territory for extended periods during strong downtrends. This suggests that while a bounce is possible, it might be short-lived unless key resistance levels are convincingly reclaimed. The MACD histogram, deeply negative and below the signal line, confirms the prevailing bearish momentum.
Key Levels Under Siege: $6,309.37 in Focus
As the market closed on Friday, the S&P 500 found itself hovering precariously above a cluster of important support levels. The most immediate level to watch is $6,309.37, which represents the lower bound of the 1-day support zone. Historically, such levels often act as psychological barriers, but in a strong downtrend, they can quickly become mere waypoints on the path lower. The data shows further support at $6,389.23 and $6,438.27, but Friday's close below these levels means they are no longer acting as floors. The true battleground appears to be around the $6,309 mark.
A decisive break below $6,309.37 would be a significant technical event. It would not only confirm the strength of the prevailing downtrend but also open the door for a rapid descent towards the next major support at $6,107.8. This level, significantly lower, represents a more substantial psychological barrier and a potential area where bargain hunters might step in. However, reaching that point would imply a further 4-5% drop from current levels, a move that could be triggered by any number of escalating macro or geopolitical events.
Conversely, for the bulls to regain any semblance of control, they need to achieve a decisive close back above the $6,389.23 level, ideally followed by a push towards the $6,438.27 resistance. This would signal at least a temporary halt to the selling. However, given the current market structure and the strength of the bearish signals, such a recovery would require a significant catalyst. The immediate focus remains on whether the $6,309.37 support can hold through initial trading next week. Failure here could accelerate the downward move significantly.
The S&P 500's daily chart displays a strong bearish trend (ADX: 47.68) with RSI deeply oversold at 26.73. While oversold conditions suggest a potential for a bounce, the trend strength indicates that such bounces may be short-lived and could fail to break significant resistance levels. Traders should exercise extreme caution and await clear signs of trend exhaustion or reversal before considering long positions.
Fundamental Undercurrents: What's Driving the Sell-Off?
The Dollar's Dominance and its Impact on Equities
The strengthening US Dollar, as indicated by the DXY index climbing to 99.91, is a significant factor contributing to the pressure on the S&P 500. A stronger dollar typically makes US assets more expensive for foreign investors, potentially dampening demand. More importantly, it can signal a global 'risk-off' sentiment, where capital flows towards perceived safe-haven assets like the dollar, away from riskier assets such as equities. The correlation is often inverse: as the dollar strengthens, riskier assets tend to weaken, and vice versa.
The DXY's rise to 99.91 on Friday, a significant move of 0.34%, suggests that global investors are seeking refuge in the greenback. This coincides with escalating geopolitical tensions, which we will discuss later. The fact that the DXY is showing strong upward momentum (ADX 31.98 on the daily chart) indicates this trend might have further room to run, potentially adding to the headwinds facing the S&P 500 in the short term. The RSI on the DXY is at 61.71, indicating a healthy upward trend rather than an overbought condition, suggesting further dollar strength is plausible.
This dynamic creates a challenging environment for US equities. While a strong dollar can sometimes be a sign of a robust US economy, the current context appears to be driven more by global fear than domestic strength. Investors are pricing in the possibility of further global instability, and the dollar is benefiting accordingly. This puts the S&P 500 in a difficult position, as it faces both internal technical breakdowns and external macro pressures from a strengthening currency.
Geopolitical Tensions Simmer: A Catalyst for Risk Aversion
The recent surge in gold prices past $4,500, driven by Iran shutting the Strait of Hormuz amid peace talks, is a stark reminder of how geopolitical events can rapidly shift market sentiment. While the news mentions peace talks, the act of shutting down such a critical chokepoint for global oil supply is inherently destabilizing. This geopolitical instability is a primary driver of the current risk-off sentiment pervading financial markets, directly impacting the S&P 500.
The escalation in the Middle East, with reports of sustained Ukrainian drone attacks threatening Russian oil exports from Baltic ports, further compounds the issue. This dual threat – disruption in the Strait of Hormuz and potential supply disruptions from Russia – is directly contributing to the surge in oil prices (Brent at $110.64, WTI at $101.19). Higher energy prices fuel inflation concerns, which in turn can lead central banks to maintain tighter monetary policies or even consider further tightening, creating a negative feedback loop for equities.
When geopolitical risks rise, investors tend to flee riskier assets like stocks and seek shelter in perceived safe havens. This often includes gold, the US Dollar, and US Treasury bonds. The concurrent strength in the DXY and the surge in gold prices are clear indicators of this 'flight to safety.' For the S&P 500, this means increased selling pressure as capital is reallocated away from equities. The uncertainty surrounding these geopolitical flashpoints makes it difficult for markets to find stable footing, leading to increased volatility and downward pressure.
Economic Calendar Watch: Inflation and Interest Rate Expectations
Looking ahead, the economic calendar presents several high-impact events that could significantly influence market direction. The recent [USD] report showing actual data of 6.926, compared to a forecast of -1.3, highlights a significant deviation in employment figures. While the previous reading was 6.156, this substantial beat suggests a potentially stronger labor market than anticipated, which could complicate the Federal Reserve's stance on interest rates. However, the context of a strong dollar and geopolitical risks might temper the market's reaction to positive economic data.
The upcoming [USD] data release, with an actual figure of 210 against a forecast of 211, indicates a slight miss but remains close to expectations. While not a major deviation, it adds to the complex picture of economic health. The market will be scrutinizing these numbers for any clues about the Fed's future policy path. If inflation remains a concern, or if the labor market continues to show surprising strength, the Fed might be forced to maintain a hawkish stance, which is generally bearish for equities.
Furthermore, upcoming releases for [GBP] and other currencies will provide a broader global economic context. The market's sensitivity to inflation data is particularly high right now. Any indication that inflation is proving 'stubborn', as mentioned in some recent commentary, could lead to renewed fears of higher-for-longer interest rates, further pressuring the S&P 500. Conversely, signs of cooling inflation could offer some relief, but this would need to be substantial enough to override the current geopolitical concerns.
The S&P 500's correlation with the US Dollar Index (DXY) is a critical factor. As the DXY strengthens towards 100 (current price 99.91), it typically exerts downward pressure on equities due to increased foreign exchange costs and a general 'risk-off' sentiment. Investors should monitor the DXY's trajectory closely as a leading indicator for potential shifts in equity market sentiment.
Trading Scenarios for the Week Ahead
The current technical setup for the S&P 500 is overwhelmingly bearish, with strong downward trend signals across multiple timeframes. However, the extremely oversold daily RSI (26.73) presents a dichotomy: while the trend is down, the conditions are ripe for a potential short-term bounce. The key will be discerning whether any bounce is a genuine reversal or merely a pause before further declines.
Bearish Scenario: Continued Downside Pressure
70% ProbabilityNeutral Scenario: Sideways Consolidation and Choppy Action
20% ProbabilityBullish Scenario: Short-Term Bounce and Recovery Attempt
10% ProbabilityThe Road Ahead: What to Watch Next Week
Focus on Key Support and Emerging Trends
The primary focus for the S&P 500 next week will undoubtedly be the $6,309.37 support level. A failure to hold this mark could trigger significant further downside, potentially retesting the $6,107.80 area. Traders will be looking for signs of capitulation or exhaustion, but the current trend strength suggests caution. Any bounce needs to be confirmed by increasing volume and a decisive reclaim of intermediate resistance levels, starting with $6,389.23.
The correlation with the DXY will remain a critical theme. If the dollar continues its ascent towards the 100.00 mark and beyond, it will likely continue to exert pressure on the equity markets. Geopolitical developments will act as wildcards, capable of triggering sharp moves in either direction, but currently, they are fueling a risk-off environment. Investors should be prepared for continued volatility, and any strategy should incorporate robust risk management principles.
The oversold RSI on the daily chart (26.73) does present a glimmer of hope for a short-term technical bounce. However, history shows that in strong downtrends, such bounces can be retracing only a small portion of the prior move before resuming the primary trend. Confirmation will be key: a break above immediate resistance levels, coupled with declining bearish momentum on indicators like MACD and ADX, would be necessary to signal a potential shift.
For those looking to enter the market, patience appears to be the most prudent strategy. Waiting for a clear trend confirmation or a significant technical setup, rather than trying to catch a falling knife, is advisable. The market is currently driven by fear and uncertainty, and while opportunities will eventually emerge, they are likely to be found after the dust settles and a clearer picture of the economic and geopolitical landscape emerges. The $6,309.37 level is the immediate line in the sand; its fate will dictate the near-term trajectory.
Frequently Asked Questions: SP500 Analysis
What happens if the SP500 breaks below the $6,309.37 support level?
A break below $6,309.37 would confirm the strength of the current bearish trend and likely trigger further selling pressure. The next significant support level to watch would be $6,107.80, representing a potential further decline of approximately 4-5% from current levels.
Should I consider buying the SP500 at current levels around $6,357.55 given the oversold RSI of 26.73?
While the daily RSI at 26.73 indicates oversold conditions, suggesting a potential for a bounce, the strong daily downtrend (ADX 47.68) makes this a high-risk entry. A more prudent approach would be to wait for confirmation of a trend reversal or a clear break above immediate resistance levels like $6,389.23 before considering long positions.
Is the MACD histogram's negative momentum at -5.2 a strong sell signal for the SP500?
The negative MACD histogram reading of -5.2, coupled with the MACD line being below the signal line, strongly reinforces the prevailing bearish momentum. While not a standalone buy signal, it confirms the downward pressure and suggests that rallies may face selling pressure, making it a significant indicator for short-term bearish outlooks.
How will the strong DXY at 99.91 and geopolitical tensions affect the SP500 next week?
The strengthening DXY at 99.91, driven by escalating geopolitical tensions, is creating a risk-off environment. This typically leads to capital flowing out of equities and into safe-haven assets, which will likely continue to exert downward pressure on the SP500. Expect continued volatility unless these macro factors show signs of abating.
Track markets in real-time
AI-powered analysis, technical indicators and real-time price data.
Join Our Telegram Channel
Breaking market news, AI analysis and trading signals instantly.
Join Channel