Nasdaq100 Analysis: Bears Rule at $23,092.50 as Global Tensions Escalate
Nasdaq100 faces significant headwinds at $23,092.50 amid rising geopolitical risks and a strengthening dollar. Key levels to watch as bears tighten their grip.
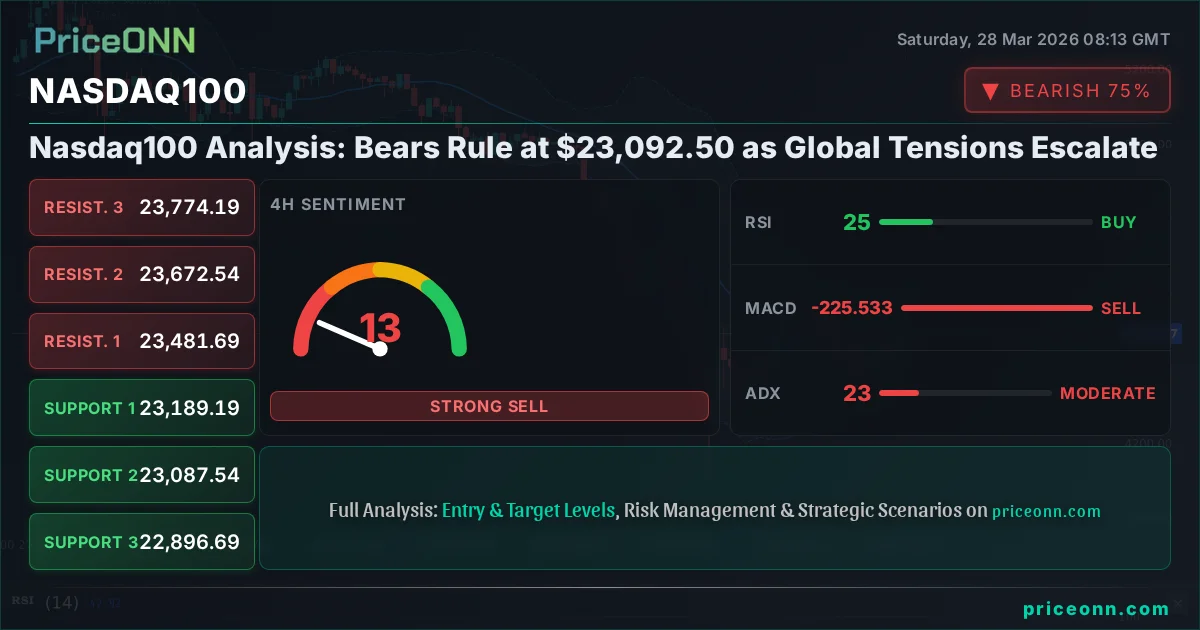
The Nasdaq100, a bellwether for the tech-heavy Nasdaq index, is currently battling significant selling pressure, trading at $23,092.50. This downturn is not occurring in a vacuum; it's deeply intertwined with a complex web of escalating geopolitical tensions, a strengthening US Dollar Index (DXY), and a palpable shift in global risk appetite. As traders and investors grapple with these crosscurrents, understanding the interplay between these macro factors and the technical landscape of the Nasdaq100 becomes paramount for navigating the choppier waters ahead. The recent surge in gold prices past $4,500, fueled by Iran's actions in the Strait of Hormuz and broader inflation fears, underscores the prevailing uncertainty. This risk-off sentiment is directly impacting growth-oriented assets like tech stocks, pushing the Nasdaq100 into a defensive posture. The question on many minds is whether this is a temporary correction or the start of a more sustained bear market. This analysis delves into the drivers behind the current price action, examines key technical indicators, and outlines the critical levels to monitor as we look towards the coming week.
- Nasdaq100 is trading at $23,092.50, showing strong bearish signals across multiple timeframes.
- The RSI at 20.41 on the 1-hour chart indicates extreme oversold conditions, potentially signaling a short-term bounce but not a trend reversal.
- Critical support for the Nasdaq100 is identified at $23,061.21, with further levels at $23,000 and below.
- A strengthening DXY, currently at 99.91, is exerting downward pressure on risk assets like the Nasdaq100.
- Geopolitical tensions, particularly concerning oil prices and supply routes, are contributing to a risk-off environment, impacting tech stocks negatively.
The Geopolitical Storm Brewing: A Macroeconomic Anchor for the Nasdaq100's Plunge
Escalating Tensions and the Flight to Safety
The financial markets are currently navigating a treacherous geopolitical landscape, marked by heightened tensions in the Middle East and a renewed focus on global supply chain vulnerabilities. Iran's declaration of control over the Strait of Hormuz, a critical chokepoint for global oil supply, has sent shockwaves through commodity markets, pushing Brent crude past $110 and WTI towards $101. This surge in energy prices, a key driver of inflation, is a significant concern for central banks globally, particularly the US Federal Reserve. The immediate impact is a heightened sense of uncertainty, leading investors to shed riskier assets and seek refuge in perceived safe-haven assets. Gold, a traditional beneficiary of such turmoil, has surged past $4,500, reflecting this flight to safety. This broader risk-off sentiment directly weighs on growth-oriented sectors and indices like the Nasdaq100, which are more sensitive to economic cycles and investor confidence. The tech-heavy nature of the Nasdaq100 means it often leads market downturns when sentiment sours, as companies reliant on consumer spending and business investment face headwinds.
The correlation between geopolitical events and market movements has become increasingly pronounced. When global stability is threatened, capital tends to flow away from equities, especially those with higher valuations and growth-dependent narratives, towards assets perceived as more secure. This dynamic is clearly playing out as the Nasdaq100 experiences significant declines. The fear of supply disruptions, potential inflation spikes, and the subsequent uncertainty about central bank responses create a challenging environment for growth stocks. Furthermore, the market's reaction to these events is often amplified by algorithmic trading and high-frequency strategies that can exacerbate price swings. The $23,092.50 level for the Nasdaq100 is currently being tested under intense selling pressure, and the lack of immediate de-escalation in global flashpoints suggests that this sentiment may persist in the short term. Understanding these macro drivers is not just about observing headlines; it's about recognizing how they translate into tangible market flows and impact the valuation of technology companies.
The Dollar's Dominance: A Headwind for Global Equities
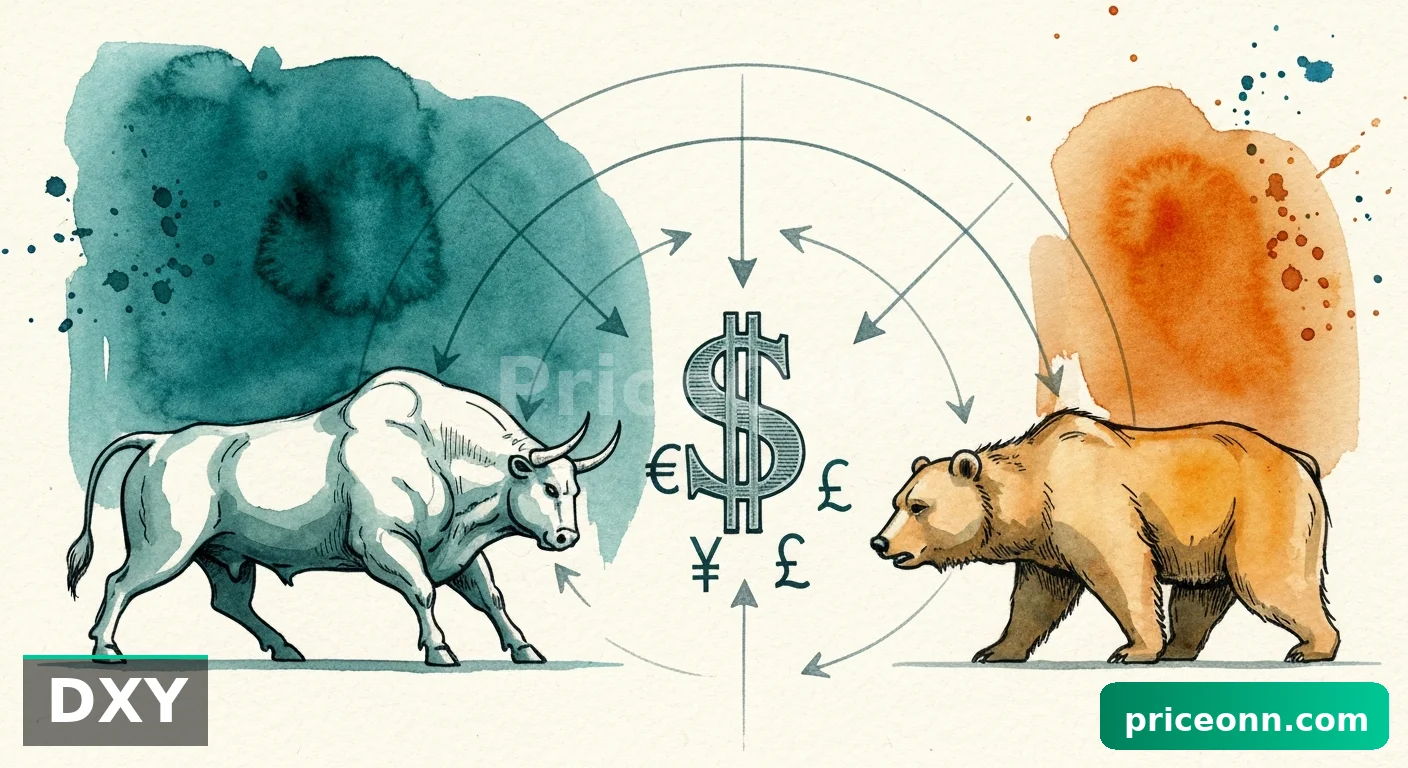
Compounding the geopolitical pressures is the strengthening US Dollar Index (DXY), which has climbed to 99.91. A robust dollar typically exerts downward pressure on global assets priced in other currencies, including major indices like the Nasdaq100. When the dollar strengthens, US exports become more expensive for foreign buyers, potentially hurting the revenue of multinational corporations. More importantly, a stronger dollar can signal a shift towards risk aversion or expectations of higher US interest rates, both of which are detrimental to growth stocks. For investors holding assets outside the US, a stronger dollar means their investments are worth less when converted back into their local currency. This effect can be particularly pronounced for companies with significant international operations, many of which are constituents of the Nasdaq100. The current DXY reading suggests a clear preference for dollar-denominated assets, potentially at the expense of global equity markets.
The interplay between the DXY and the Nasdaq100 is a critical aspect of today's market analysis. While not always a perfect inverse correlation, a rising dollar often coincides with falling equity prices, especially for growth stocks. This is partly because a stronger dollar can make it more expensive for foreign investors to buy US assets, and it can also be a precursor to tighter monetary policy, which increases borrowing costs and reduces the present value of future earnings – a key valuation metric for tech companies. The fact that the DXY is showing strong upward momentum across multiple timeframes, with a 1H signal of 'AL' and a 1D trend strength of 96%, indicates that dollar strength is a dominant theme. This reinforces the bearish outlook for risk assets like the Nasdaq100, which is currently trading at $23,092.50. For scalpers and short-term traders, monitoring the DXY's immediate moves against key currency pairs like EURUSD (currently at 1.15089 and falling) and USDJPY (at 160.297 and rising) can provide valuable intraday signals. For longer-term investors, the sustained dollar strength may signal a period of deleveraging and a rotation into value or defensive assets.
Technical Breakdown: Nasdaq100 at a Critical Juncture
Shattered Supports and Fading Momentum
The technical picture for the Nasdaq100 is undeniably bearish across the board, painting a grim outlook for the immediate future. On the 1-hour chart, the trend is decisively 'Düşüş' (Down) with a strength of 100%, and the RSI is languishing at a mere 19.92, deep in oversold territory. This extreme reading suggests that while a short-term bounce is possible – a relief rally is almost inevitable after such a sharp decline – the underlying momentum is overwhelmingly to the downside. The MACD histogram is deeply negative, and the Stochastic Oscillator is showing K=2.13 and D=8.64, both indicating extreme oversold conditions and a potential for a brief upward correction, but not a sustained recovery. The ADX at 32.68 confirms a strong downtrend is in play. The immediate support level to watch is $23,061.21, followed by $23,000. A break below these levels would open the floodgates for further downside, with the next significant psychological support potentially around $22,500.
The 4-hour timeframe offers a similar, albeit slightly less extreme, bearish narrative. The trend remains 'Düşüş' (Down) with 96% strength, RSI is at 26.9, and Stochastic is showing K=2.51, D=14.09, both still firmly in oversold territory. The ADX at 22.36 indicates a moderate trend strength, suggesting that the downward momentum is still building. The key support levels here are $23,000, $22,896.69, and further down to $22,500. The resistance levels, which are critical for short-term traders looking for bearish continuation setups, are around $23,100, $23,194.49, and $23,261.13. A failure to reclaim these resistance levels on any bounce will reinforce the bearish thesis. For swing traders, the inability of the index to find a firm footing above the $23,000 mark is a major red flag, suggesting that the path of least resistance remains to the downside. The sheer volume of bearish signals across these shorter timeframes highlights the immediate pressure on the Nasdaq100.
The Daily Chart's Grim Prognosis
Looking at the daily chart, the picture becomes even more stark. The trend is unequivocally 'Düşüş' (Down) with 100% strength. The RSI stands at 26.73, signaling extreme oversold conditions that have historically preceded significant, albeit often sharp and short-lived, bounces. However, the MACD is deeply negative, with its histogram well below the signal line, indicating strong bearish momentum. The Stochastic Oscillator, with K=22.76 and D=30.56, also points towards oversold territory, but the fact that %K is still below %D suggests that the downward pressure has not yet abated. The ADX at 47.68 is exceptionally high, confirming a very strong and established downtrend. This is not a market where one should be looking for long entries based solely on oversold indicators; confirmation is key.
The critical support levels on the daily chart are $23,000, $22,896.69, and below that, $22,500. The resistance levels are clustered around $23,100, $23,194.49, and $23,261.13. For long-term investors, the current price of $23,092.50 represents a significant psychological level, and a decisive close below $23,000 could trigger further panic selling. The sustained strength in the DXY (currently 99.91) and the continued rise in oil prices are fundamentally supporting this bearish technical outlook. The narrative for the Nasdaq100 has shifted from growth expectations to risk aversion, and until there are clear signs of de-escalation in geopolitical conflicts or a shift in central bank rhetoric, the path of least resistance appears to be lower. Even with oversold indicators, the strength of the downtrend suggested by the ADX implies that any bounces may be met with renewed selling pressure as traders look to exit positions.
Correlation Analysis: The Interconnected Market Ecosystem
DXY, Oil, and the Nasdaq100's Dance
The relationship between the US Dollar Index (DXY), oil prices, and the Nasdaq100 is a crucial element for understanding the current market dynamics. As observed, the DXY is strengthening, currently trading at 99.91 with a strong upward trend across all timeframes. Simultaneously, Brent crude is surging, trading at $110.64, and WTI is pushing $101.19, both indicating significant upward momentum. This scenario - a rising dollar coupled with soaring oil prices - typically spells trouble for growth assets like the Nasdaq100. The higher oil prices contribute to inflationary pressures, which in turn can lead to expectations of tighter monetary policy from the Federal Reserve. A stronger dollar makes US assets more attractive to global investors, drawing capital away from other markets, including equities. For the Nasdaq100, trading at $23,092.50, this combination creates a double whammy: reduced risk appetite and increased cost of capital.
The implications for different trading horizons are significant. Scalpers might look for intraday opportunities on bounces, perhaps as the RSI briefly cools from extreme oversold levels, but must be wary of the dominant downtrend. Swing traders will be watching for any failure to hold key support levels like $23,000, using any failed bounces as confirmation to enter short positions targeting lower levels. Long-term investors, while potentially seeing oversold indicators as a long-term buying opportunity, must acknowledge the prevailing macroeconomic headwinds. The historical precedent shows that periods of high oil prices and dollar strength often coincide with equity market corrections or bear markets, especially for growth-oriented sectors. The current ADX readings on the daily charts for both DXY (31.98) and Nasdaq100 (47.68) highlight the strength of these opposing trends. The Nasdaq100's bearish signal (Al: 1, Sat: 6, Nötr: 0 on daily) confirms this dynamic.
Equities, Bonds, and the Search for Stability
The selloff in the Nasdaq100 is mirrored, to varying degrees, across other major equity indices. The S&P 500 is trading at $6,357.55, down 2%, with its daily chart showing a strong downtrend (ADX 47.68) and oversold RSI (26.73). Similarly, the Dow Jones Industrial Average is at $45,077.50, also experiencing a significant drop. This broad-based decline in US equities suggests a systemic risk-off sentiment rather than sector-specific issues. Investors are rotating out of equities and potentially seeking refuge in other asset classes. While the DXY is strengthening, the bond market's reaction will be crucial. Typically, a flight to safety would see Treasury yields fall as prices rise. However, persistent inflation fears driven by high oil prices could complicate this picture, potentially leading to higher yields and further pressure on equities. The current data doesn't provide specific bond yield information, but the expectation is that if inflation fears dominate, bond yields might remain elevated or even rise, creating a challenging environment for both stocks and bonds.
The correlation between the Nasdaq100 and other risk assets like Bitcoin (BTCUSD) is also worth noting. Bitcoin is currently trading around $66,524, showing a mixed picture with a neutral trend on the daily chart but bearish signals on shorter timeframes. While crypto can sometimes act as a risk-on asset, periods of extreme market stress can see it correlate more closely with other high-risk equities, or even act as a liquidity drain. The fact that Bitcoin is not showing a strong bullish divergence against the Nasdaq100's decline suggests that the broader risk-off sentiment is encompassing most speculative assets. For traders, this interconnectedness means that a developing narrative in one market can quickly spill over into others. For instance, if the Federal Reserve signals a more hawkish stance due to inflation fears (exacerbated by oil prices), this could strengthen the dollar, pressure the Nasdaq100, and potentially lead to outflows from riskier cryptocurrencies as well. The lack of clear positive correlation between Nasdaq100 and Bitcoin in this environment is a bearish signal for risk assets overall.
Navigating the Week Ahead: Strategy for Different Trader Types
For the Scalper: Riding the Short-Term Waves
Scalpers thrive on volatility and short-term price swings, and the current market conditions for the Nasdaq100 at $23,092.50 certainly offer opportunities. The key is to focus on the 1-hour and 4-hour charts, using the extreme oversold RSI readings (around 20 on 1H, 27 on 4H) as potential triggers for quick, short-lived long trades, especially if they coincide with a test of immediate support levels like $23,061.21 or $23,000. However, these must be scalping trades with very tight stop-losses, as the overarching trend is strongly bearish. The invalidation for such a trade would be a decisive close below the entry support level, signaling a continuation of the downtrend. Scalpers should also monitor the Stochastic Oscillator's crossovers in oversold territory (K crossing above D) as a potential confirmation signal, but always with the caveat that the ADX readings (32.68 on 1H, 22.36 on 4H) indicate a persistent trend that can quickly overwhelm short-term bounces. The high probability remains for bearish continuation, so any long scalps should be viewed as counter-trend trades requiring extreme caution and quick profit-taking.
Conversely, scalpers can also capitalize on the bearish momentum by looking for retests of resistance levels on any bounces as opportunities to enter short positions. For example, if the Nasdaq100 rallies to test $23,100 or $23,194.49 and shows signs of stalling (e.g., bearish candlestick patterns, RSI failing to break higher, MACD divergence), a short entry could be considered. The target for such a trade would be the nearest support level, such as $23,061.21 or $23,000. The invalidation would be a clear break and hold above the resistance level being tested. The key for scalpers is to remain agile, use small position sizes, and have predefined exit strategies for both profit and loss. The strong daily trend (ADX 47.68) suggests that short-term opportunities will likely arise from failed attempts to reverse the trend, rather than from sustained upward momentum.
For the Swing Trader: Waiting for Confirmation
Swing traders typically operate on a 4-hour to daily timeframe and require more confirmation than scalpers before entering a trade. Given the current data, the primary focus for swing traders should be on identifying potential shorting opportunities rather than long entries. The bearish signals on the 4-hour (RSI 26.9, Stochastic K=2.51, D=14.09) and daily charts (RSI 26.73, ADX 47.68) suggest that a sustained downtrend is likely. A swing trader might wait for a failed bounce attempt. For instance, if the Nasdaq100 rallies towards the $23,100-$23,200 resistance zone and fails to break convincingly, especially if it forms a bearish reversal pattern on the daily chart, this could present a high-probability short entry. The target would be the next major support level, potentially $22,500, with a stop-loss placed above the invalidated resistance zone.
Alternatively, swing traders might look for a break and hold below the $23,000 psychological level. A daily close below this mark would serve as a strong bearish signal, confirming the continuation of the downtrend. The invalidation for this short position would be a decisive move back above $23,000, preferably on increasing volume. The current price of $23,092.50 is hovering precariously above this key psychological level. Given the confluence of bearish technical indicators and negative macroeconomic factors like dollar strength and geopolitical uncertainty, the risk/reward for shorting on a confirmed breakdown below $23,000 appears favorable. However, patience is crucial; waiting for the market to provide clear signals rather than trying to anticipate the exact bottom of any short-term bounce is the hallmark of successful swing trading in such volatile conditions. The current 'SAT' signal across most timeframes reinforces this cautious, bearish approach.
For the Long-Term Investor: Assessing Value and Risk
Long-term investors, often focused on a timeframe of months to years, face a different set of considerations. While the current sharp decline in the Nasdaq100 to $23,092.50 might appear alarming, it could also present potential long-term buying opportunities for those with a higher risk tolerance and a belief in the fundamental resilience of the technology sector. The oversold RSI readings on daily charts (26.73 for Nasdaq100, 26.9 for S&P 500) suggest that the market may be becoming technically oversold, which historically can precede periods of recovery. However, the strength of the current downtrend, indicated by high ADX values (47.68 for Nasdaq100), means that catching a falling knife is a significant risk.
Long-term investors should focus on the fundamental narrative. Are the underlying drivers of technology growth still intact? While geopolitical tensions and inflation are short-to-medium term concerns, the long-term outlook for innovation, digitalization, and AI remains strong. However, the immediate threat of sustained higher oil prices and a strong dollar could impact corporate earnings and valuations in the medium term. Investors might consider a dollar-cost averaging strategy, gradually accumulating positions as the market potentially falls further, rather than trying to time the absolute bottom. Key levels to watch for potential accumulation zones would be significant psychological barriers and historical support areas, such as $22,500 and potentially lower if the bearish trend persists. The invalidation of a long-term bullish thesis would be a sustained break below these major support areas, coupled with a fundamental deterioration that suggests a prolonged economic downturn rather than a cyclical correction. For now, caution and a focus on quality companies with strong balance sheets are advisable.
Historical Context: Past Crashes and Recoveries
Lessons from Previous Tech Selloffs
The current Nasdaq100 decline, while sharp, is not unprecedented. Historically, periods of heightened geopolitical risk, like those we are seeing now with the Strait of Hormuz tensions and escalating global conflicts, have often triggered significant equity market corrections. The dot-com bubble burst in 2000-2002, the 2008 Global Financial Crisis, and the COVID-19 pandemic crash in early 2020 all serve as stark reminders of how quickly market sentiment can shift and how vulnerable growth-oriented sectors can be during times of systemic stress. During the dot-com bubble, many tech stocks, including those that formed the early Nasdaq index, experienced declines of 70-90% or more. The recovery was slow and selective, favoring companies with solid fundamentals over speculative ventures.
In 2008, the financial crisis led to a broad market selloff, with the Nasdaq100 experiencing a significant drawdown. However, the recovery that followed, fueled by quantitative easing and a renewed focus on innovation, was also substantial. More recently, the COVID-19 crash saw an incredibly rapid decline followed by an equally swift and powerful recovery, largely driven by unprecedented monetary and fiscal stimulus. What these historical episodes teach us is that while sharp selloffs can be terrifying, they often present opportunities for long-term investors. However, the nature of the trigger matters. Geopolitical events and inflation fears, as seen now, can lead to more prolonged periods of uncertainty compared to sharp, V-shaped recoveries seen during the pandemic, which was primarily a health crisis met with massive stimulus. The current price of $23,092.50 is a level that, if broken decisively, could echo some of the more severe historical corrections, necessitating a patient, fundamentally-driven approach for long-term players.
The Role of Central Banks and Inflation
Central bank policy has always been a critical factor in market recoveries and downturns. During the post-COVID era, the ultra-loose monetary policies of central banks like the Federal Reserve were instrumental in fueling the rally in growth stocks. However, the current inflationary environment, exacerbated by rising energy prices, has forced central banks to adopt a more hawkish stance. The market is pricing in a significant probability of interest rate hikes or a prolonged period of higher rates, which directly impacts the valuation of tech companies. The historical precedent shows that rising interest rate environments are typically challenging for growth stocks, as the discount rate applied to future earnings increases, making those future profits less valuable today. The Nasdaq100's current price of $23,092.50 is being tested against this backdrop of potential monetary tightening. Investors are closely watching economic data releases, such as upcoming employment figures and inflation reports, for clues on the Fed's next move. A persistently high inflation rate, driven by energy costs and supply chain issues, could force the Fed's hand, leading to more aggressive tightening and further pressure on the Nasdaq100.
The correlation between bond yields and equity markets is also key. As inflation expectations rise, bond yields tend to increase, making fixed-income investments more attractive relative to equities. This can lead to a rotation of capital out of stocks and into bonds. The Nasdaq100, being heavily weighted towards growth stocks with long-duration earnings profiles, is particularly sensitive to changes in interest rate expectations. If yields continue to climb due to persistent inflation concerns, the Nasdaq100 may struggle to find a bottom. Conversely, if inflation proves transitory and central banks can pivot back to more accommodative policies, it could provide a catalyst for a recovery. For now, the market is pricing in a scenario where inflation remains a concern, supporting the current bearish sentiment around the Nasdaq100. The interplay between geopolitical events (driving oil prices), inflation data, and central bank responses will dictate the path forward.
Key Levels and Scenarios for the Week Ahead
The Bearish Scenario: Continued Descent
The most probable scenario, given the current technical and fundamental confluence, is a continuation of the bearish trend. The trigger for this scenario would be a decisive close below the critical psychological support level of $23,000 on the daily chart. This would confirm the breakdown of previous consolidation patterns and signal further capitulation. Invalidation of this scenario would occur if the Nasdaq100 manages to reclaim and hold above the $23,261.13 resistance level, suggesting a potential reversal or at least a significant pause in the downtrend. The immediate downside targets would be $22,896.69 (S3) and potentially extending towards $22,500, a significant psychological level that hasn't been tested recently. This outlook is supported by the strong bearish signals across all timeframes, the persistent strength in the DXY, and the elevated geopolitical risk premium reflected in oil prices.
The Bullish Scenario: A Fleeting Bounce?
A bullish scenario, while less likely in the short term, cannot be entirely dismissed, especially given the extremely oversold readings on shorter timeframes. The trigger for a potential bullish move would be a strong bounce from current levels, perhaps initiated by positive news regarding de-escalation of geopolitical tensions or a less hawkish-than-expected inflation report. For this scenario to gain traction, the Nasdaq100 would need to decisively break above the immediate resistance at $23,100 and, more importantly, reclaim the $23,194.49 and $23,261.13 levels. Invalidation of this bullish thesis would be a failure to hold above $23,000, reinforcing the bearish case. The first target for a sustained bullish move would be the $23,500 area, followed by a potential retest of the $23,700-$23,800 range. However, without a significant shift in macro sentiment or a clear technical reversal pattern, any upside move is likely to be met with selling pressure.
The Neutral Scenario: Consolidation and Uncertainty
A neutral scenario implies a period of consolidation or range-bound trading as the market digests the recent volatility and awaits clearer signals. The trigger for this scenario would be the Nasdaq100 failing to break decisively below $23,000 and also failing to rally convincingly above $23,100-$23,200. This would likely result in a period of choppy trading within a defined range, possibly between $23,000 and $23,150. Invalidation of this neutral phase would be a clear breakout above the upper resistance range or a breakdown below the lower support level. This scenario is plausible if geopolitical news remains mixed or if upcoming economic data provides conflicting signals about inflation and the Fed's policy path. During such consolidation, volatility might decrease, but the underlying trend would remain uncertain, making it difficult for traders to establish clear directional positions.
Bearish Continuation: The Bears' Grip Tightens
65% ProbabilityBullish Rebound: A Short-Lived Relief Rally?
20% ProbabilityConsolidation: Waiting for Clarity
15% ProbabilityFrequently Asked Questions: Nasdaq100 Analysis
What happens if the Nasdaq100 breaks below the $23,000 support level?
A decisive break below $23,000 would validate the bearish scenario, likely triggering further selling pressure. The next significant support level to watch would be $22,896.69, with potential downside extending towards $22,500 as psychological barriers are tested.
Should I consider buying the Nasdaq100 at current levels around $23,092.50 given the oversold RSI?
While the RSI at 20.41 on the 1H chart suggests oversold conditions, the strong daily downtrend (ADX 47.68) indicates that buying here carries significant risk. Long-term investors might consider dollar-cost averaging, but short-term traders should wait for confirmation of a trend reversal or a clear bounce setup.
Is the MACD histogram's negative momentum a strong sell signal for the Nasdaq100 right now?
The negative MACD histogram indicates bearish momentum is dominant, reinforcing the downtrend. While not a standalone buy/sell signal, it confirms the prevailing weakness. Traders should look for confirmation from price action and other indicators before making a decision.
How will the strengthening DXY at 99.91 and rising oil prices impact the Nasdaq100 this week?
The combination of a strengthening dollar and higher oil prices creates a risk-off environment, which is typically bearish for growth assets like the Nasdaq100. This macro backdrop suggests that any upward moves in the index may face significant selling pressure as investors prioritize safety.
Track markets in real-time
AI-powered analysis, technical indicators and real-time price data.
Join Our Telegram Channel
Breaking market news, AI analysis and trading signals instantly.
Join Channel