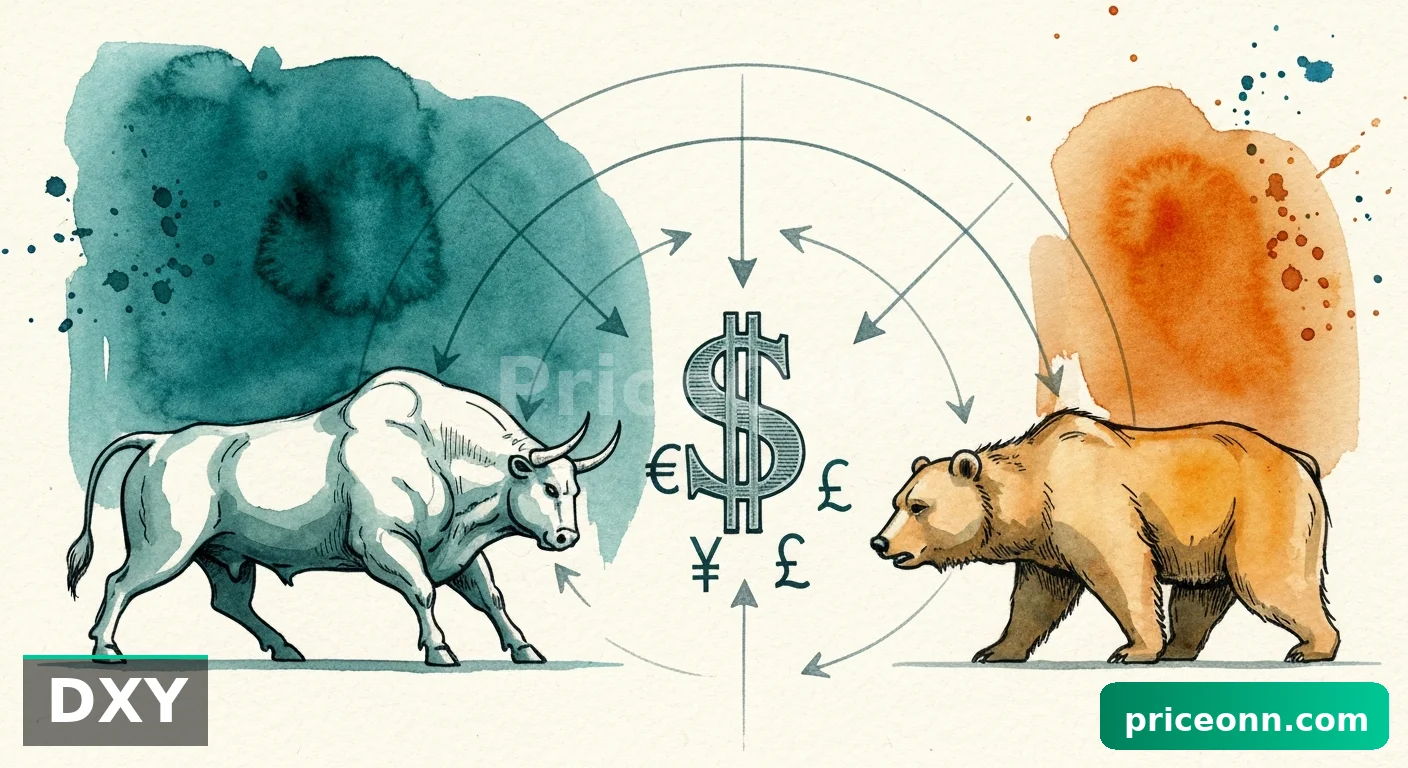
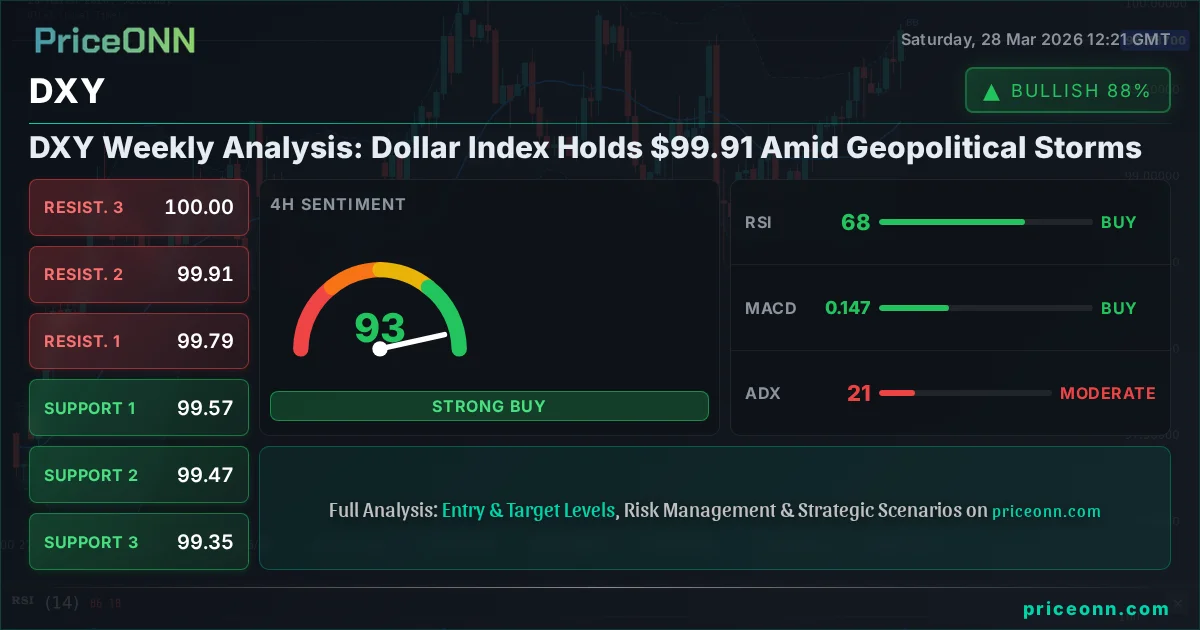
DXY Weekly Analysis: Dollar Index Holds $99.91 Amid Geopolitical Storms
The US Dollar Index (DXY) finished last week near $99.91. Escalating Middle East tensions and upcoming economic data remain key drivers.
The US Dollar Index (DXY) closed last Friday at $99.91, a level that has become a focal point amid a turbulent geopolitical landscape and a crucial week for economic data releases. While the price action reflects a modest weekly gain, the underlying currents suggest a market grappling with conflicting forces: the safe-haven appeal of the dollar versus the potential for shifting central bank policies and evolving global growth prospects. This past week, the narrative was dominated by escalating tensions in the Middle East, which, paradoxically, bolstered the dollar's safe-haven status, even as broader market sentiment showed signs of strain. As we look towards the coming week, the focus sharpens on key economic indicators and their potential to either reinforce the dollar's strength or signal a shift in market dynamics.
- The US Dollar Index (DXY) closed the week at $99.91, holding steady above key psychological levels.
- Escalating geopolitical tensions in the Middle East provided a tailwind, boosting the dollar's safe-haven appeal.
- Technical indicators on the 1-hour chart show mixed signals, with RSI at 69.84 indicating strong upward momentum but nearing overbought territory.
- Upcoming economic data, including employment figures and inflation readings, will be critical in determining the DXY's next move.
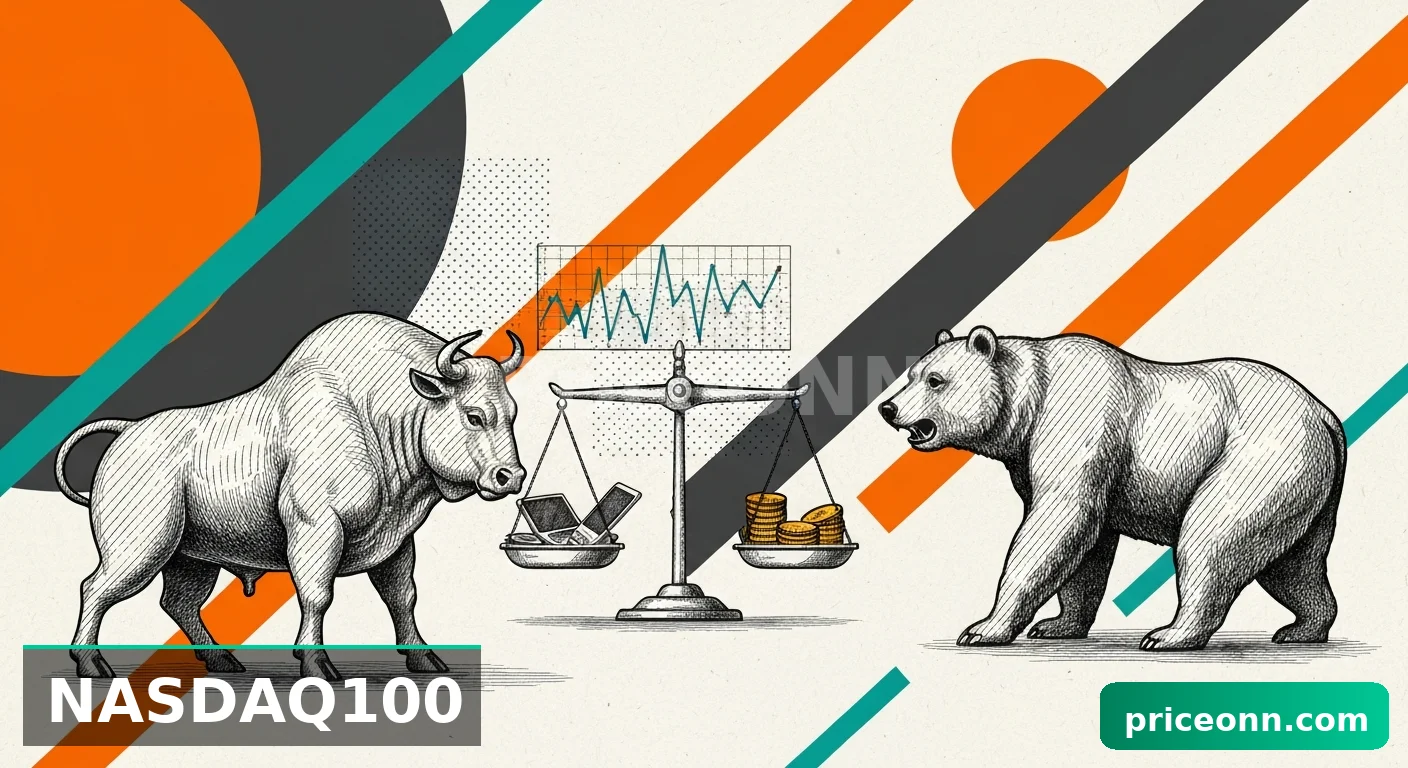
- The correlation with risk assets like the S&P 500, which saw a significant drop to 6357.55, highlights the dollar's role as a preferred safe haven in times of uncertainty.
Navigating Geopolitical Headwinds: Dollar's Safe-Haven Bid
The past week's price action for the US Dollar Index (DXY) was heavily influenced by escalating geopolitical risks, particularly in the Middle East. As news emerged of Iran asserting control over the Strait of Hormuz and drone strikes threatening Russian oil exports, a familiar pattern unfolded: heightened global uncertainty typically fuels demand for safe-haven assets, and the US dollar remains at the forefront of this demand. This dynamic was evident as the DXY managed to eke out a 0.34% gain, closing at $99.91. The surge in crude oil prices, with Brent crude climbing past $110 and WTI nearing $101, served as a stark reminder of the inflationary pressures and supply chain disruptions that geopolitical instability can unleash. These factors collectively tend to weigh on risk appetite, pushing investors towards perceived havens like the dollar.
The correlation between risk assets and the dollar became particularly pronounced. The S&P 500 experienced a significant decline, shedding 2% to close at 6357.55, while the Nasdaq 100 also saw a substantial drop of 2.23% to 23092.5. This broad-based sell-off in equities reinforced the dollar's appeal. Investors, faced with increasing uncertainty about global economic stability and the potential for further supply shocks, shifted capital away from riskier assets and into the perceived safety of US dollar-denominated instruments. This flight to safety is a well-established market phenomenon, and the DXY's resilience above the 99.50 mark, as noted in recent PriceONN market news, underscores its continued role as a primary beneficiary of such global anxieties. The narrative driving the dollar's strength is thus intrinsically linked to the volatility observed in other markets, creating a clear inverse relationship in times of heightened fear.
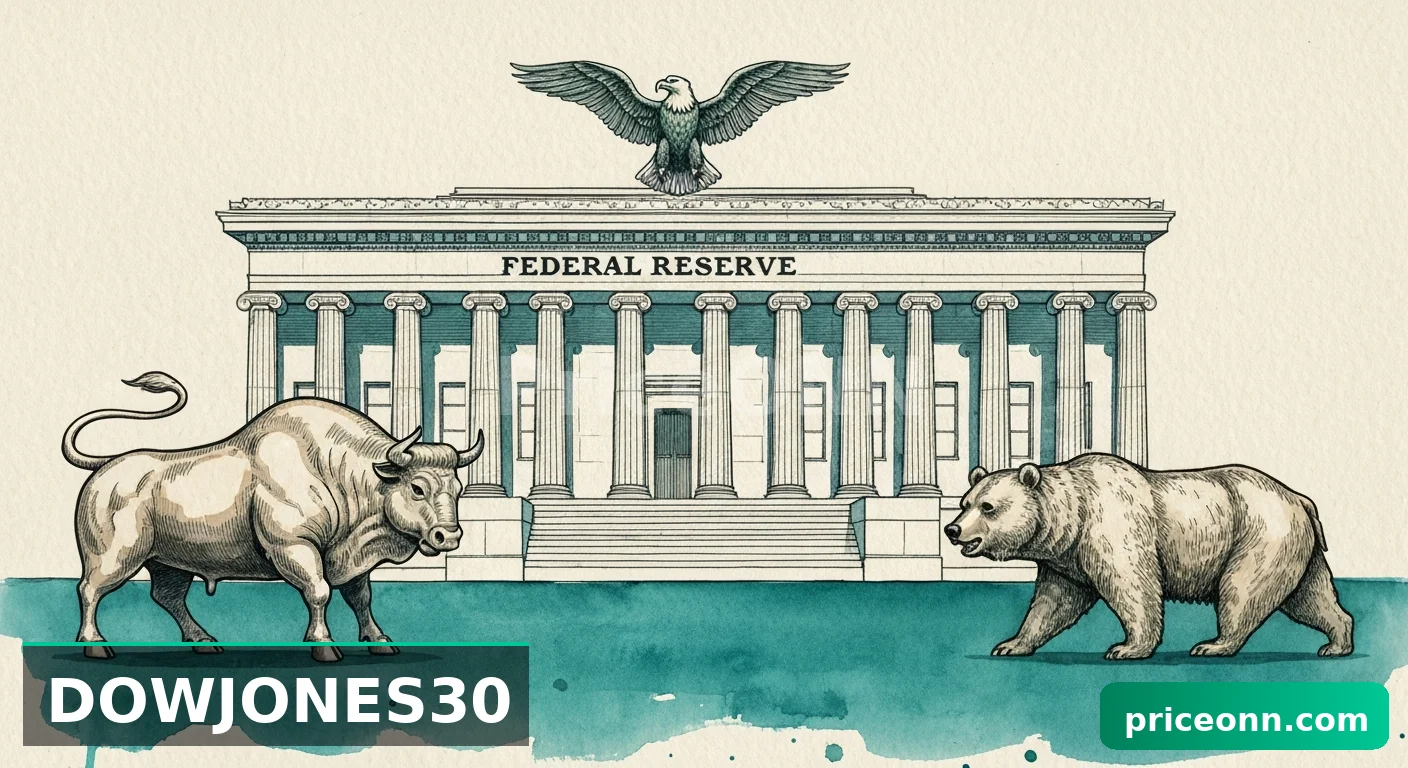
However, the dollar's strength is not solely a function of external shocks. Underlying fundamental factors, particularly concerning the US economy and Federal Reserve policy, also play a significant role. While geopolitical events provide immediate catalysts, the long-term trajectory of the DXY will ultimately be shaped by domestic economic data and the Fed's monetary policy stance. The market is constantly weighing the implications of inflation, employment, and growth figures against the Fed's stated objectives. This delicate balance between global risk sentiment and domestic economic fundamentals creates a complex trading environment for the DXY, where short-term price movements can be driven by headlines, but sustained trends require a solidifying economic backdrop.
Technical Picture: Mixed Signals at the $99.91 Level
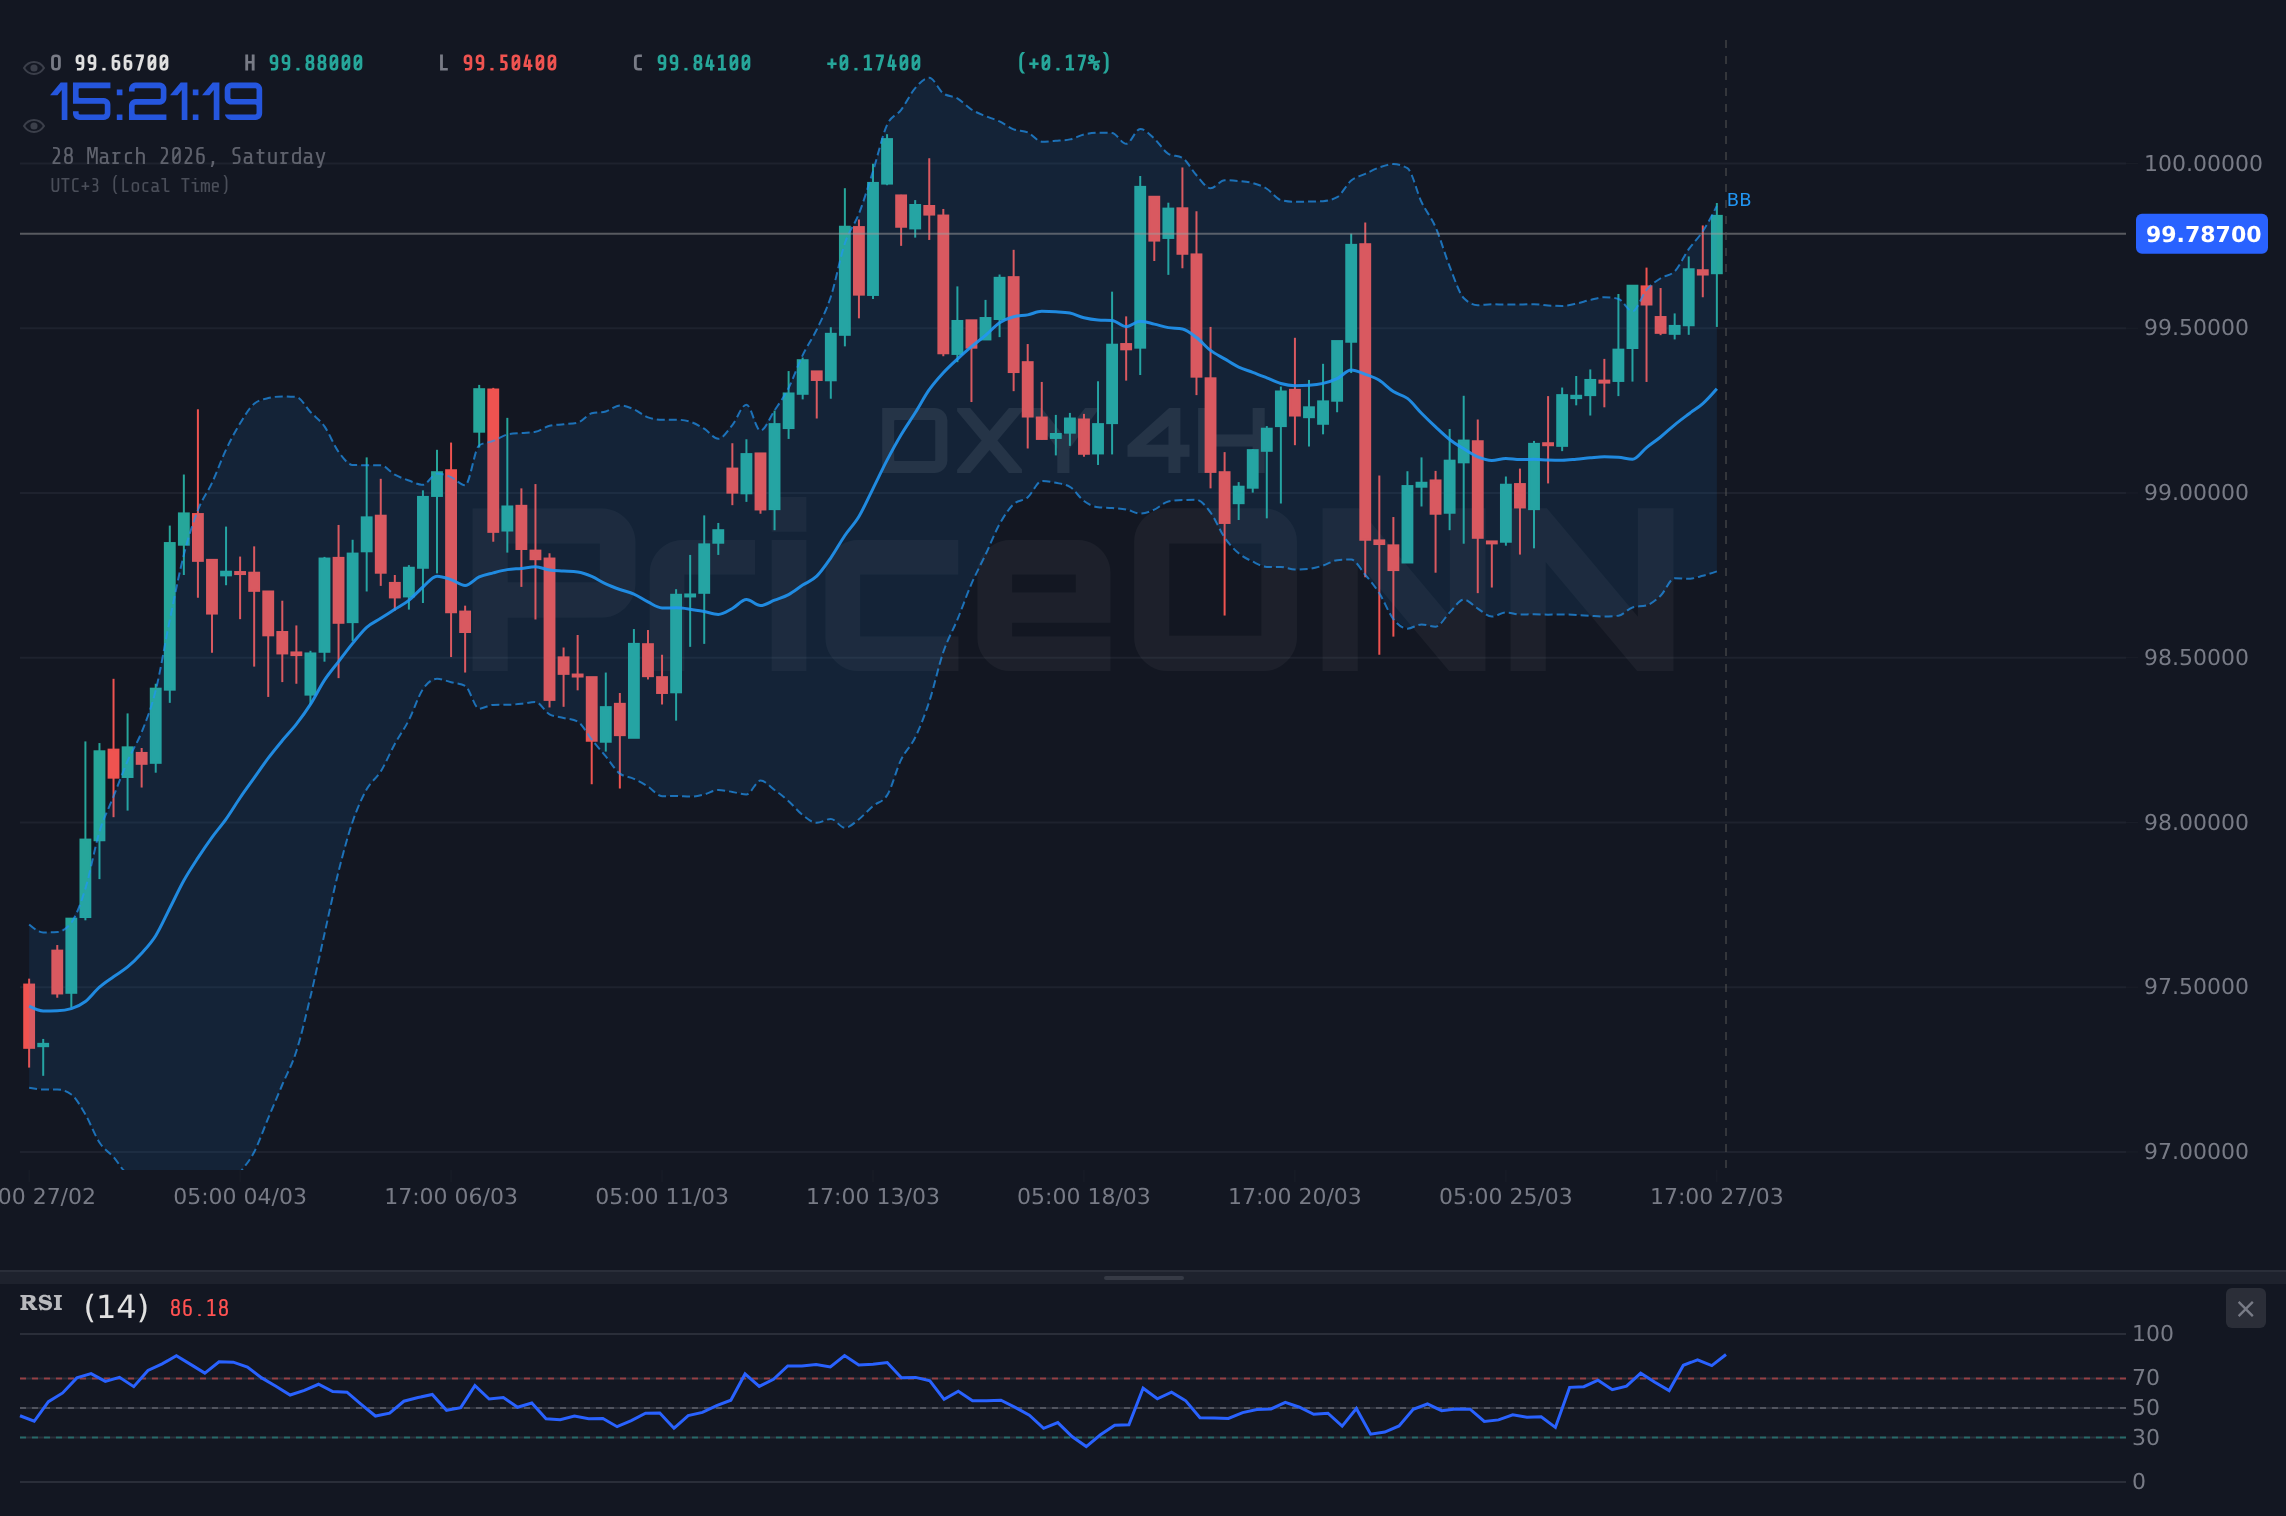
From a technical standpoint, the DXY's consolidation around the $99.91 level presents a nuanced picture. On the 1-hour timeframe, indicators offer a somewhat mixed outlook. The Relative Strength Index (RSI(14)) stands at 69.84, signaling strong upward momentum and approaching the overbought threshold, suggesting that the recent rally might be losing steam or could be due for a pause. This is further supported by the Stochastic Oscillator, where the %K line at 90.81 is above the %D line at 72.47, also indicating an overbought condition. The MACD (Moving Average Convergence Divergence) shows positive momentum, with the MACD line above the signal line, confirming the recent bullish push. However, the ADX (Average Directional Index) at 22.17 suggests a moderately strong trending environment, but not one that screams imminent parabolic moves. The Bollinger Bands are trading above the middle band, indicating a bullish bias on this shorter timeframe.
The 4-hour chart paints a slightly more robust bullish picture, though still with caveats. The trend is identified as bullish with a power of 95%, and the RSI(14) at 67.59 continues to show upward momentum without being excessively overbought yet. The Stochastic Oscillator here also shows %K (88.7) above %D (82.07), reinforcing the bullish sentiment. The ADX at 20.81 indicates a moderate uptrend, consistent with the 1-hour view. The Bollinger Bands are hugging the upper band, which can sometimes signal an overheated market, but in a strong trend, it can also indicate continuation. The general signal for the 4-hour chart leans towards 'BUY' based on the majority of indicators, reflecting the recent upward price action and the prevailing risk-off sentiment that benefits the dollar.
However, the daily timeframe provides a crucial counterpoint, highlighting potential headwinds for the dollar's advance. The trend is strongly bullish (96% power), but the RSI(14) at 61.71, while in bullish territory, is not excessively extended. More importantly, the MACD is showing positive momentum with the MACD line above the signal line, and the ADX at 31.98 indicates a strong uptrend. The Stochastic Oscillator's %K (71.8) above %D (48.78) also supports the bullish bias. Yet, the context of the broader market sell-off, particularly in equities, must be considered. While a strong dollar is often associated with a risk-off environment, the extreme readings on the 1-hour and 4-hour charts, coupled with the potential for short-term profit-taking, suggest that the path higher might not be entirely smooth. The key support levels at $99.76, $99.31, and $99.05 become critical watchpoints should any profit-taking accelerate.
Economic Data: The Key to the Dollar's Next Move
Looking ahead, the DXY's trajectory will likely hinge on a series of critical economic data releases scheduled for the upcoming week. The market's sensitivity to inflation and employment data remains exceptionally high, given the Federal Reserve's dual mandate and the ongoing debate about the timing and pace of potential policy shifts. Last week's figures provided a mixed picture: while the US managed to report a stronger-than-expected Non-Farm Payroll (NFP) number of 210,000 (against a forecast of 211,000, with the previous reading at 205,000), other indicators suggest underlying economic complexities. The actual reported NFP figure was slightly below the forecast, but the overall trend of job creation remains robust, which typically supports a stronger dollar. However, the market's reaction to such data is increasingly nuanced, often factoring in expectations and forward-looking guidance.
The upcoming release of inflation data, such as the Consumer Price Index (CPI) and Personal Consumption Expenditures (PCE) price index, will be particularly crucial. Persistent inflation, even if showing signs of moderation, could reinforce expectations of a hawkish stance from the Federal Reserve, thereby supporting the DXY. Conversely, any significant deceleration in inflation could fuel speculation about earlier or more aggressive interest rate cuts, potentially weighing on the dollar. The market will be dissecting these numbers not just for their headline figures but also for their underlying components, seeking clues about the stickiness of inflation and the underlying health of the economy. The gap between actual and forecast figures, along with revisions to previous data, will be closely scrutinized for their impact on Fed policy expectations.
Furthermore, other high-impact economic events, such as Gross Domestic Product (GDP) growth figures and Purchasing Managers' Index (PMI) surveys, will provide a broader economic context. Strong GDP growth and robust PMI readings would reinforce the narrative of a resilient US economy, offering further support to the dollar. Conversely, signs of economic slowdown or contraction could prompt a reassessment of the Fed's policy path and potentially lead to dollar weakness. The interplay between these various data points will create a dynamic environment for the DXY, where traders will be constantly adjusting their positions based on the evolving economic outlook. The dollar's ability to maintain its strength will depend on the US economy consistently outperforming its global peers and the Federal Reserve maintaining a comparatively tighter monetary policy stance.
Correlations and Market Sentiment: A Wider Lens
Understanding the DXY's movements requires looking beyond its direct price action and considering its intricate relationships with other major markets. The inverse correlation with risk assets like the S&P 500 and Nasdaq 100 is a primary example. As previously mentioned, the significant drop in US equities last week, with the S&P 500 falling to 6357.55 and the Nasdaq 100 to 23092.5, provided a clear boost to the dollar. This risk-off sentiment is a powerful driver, pushing capital towards perceived safety. When fear dominates, the DXY often strengthens, while riskier currencies and commodities tend to weaken.
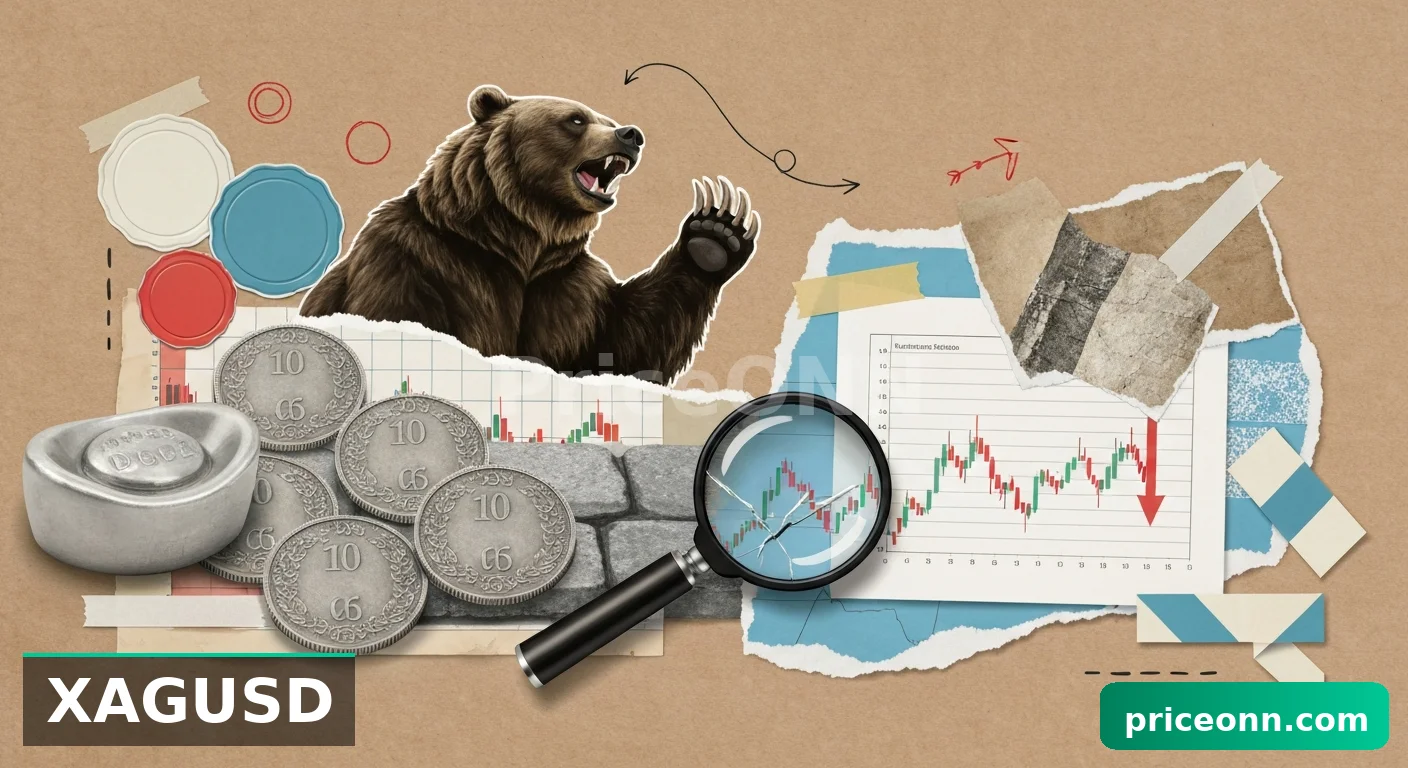
The relationship with gold (XAUUSD) is also noteworthy. Gold, currently trading around $4495.44, has seen substantial gains, partly driven by the same geopolitical tensions that support the dollar. While typically an inverse relationship is expected, in scenarios of extreme global uncertainty, both gold and the dollar can act as safe havens simultaneously, albeit for different reasons. Gold's surge past $4,500, as reported by commodities news outlets, highlights its role as a hedge against inflation and geopolitical risk, while the dollar's strength is more tied to global liquidity and the perceived stability of the US financial system. This divergence or simultaneous strength can create complex trading environments, requiring careful analysis of the prevailing market narrative.
Similarly, the performance of major currency pairs like EUR/USD, GBP/USD, and USD/JPY offers valuable insights. EUR/USD is trading around 1.15089, showing a bearish trend on the daily chart, partly influenced by the dollar's strength and potential economic divergences within the Eurozone. GBP/USD, at 1.32699, also exhibits a bearish trend, reflecting concerns about the UK economy and potential policy divergence with the US. Conversely, USD/JPY is pushing higher, trading near 160.297, driven by the interest rate differential and the yen's weakening safe-haven status in the current environment. These cross-currency dynamics provide a richer tapestry of market sentiment and highlight the global forces impacting the DXY.
The DXY's current position near the 100.00 psychological level, coupled with strong bullish momentum on shorter timeframes but mixed signals on the daily, suggests a critical juncture. A decisive break above 100.11 could signal further upside, potentially targeting 100.21, driven by sustained risk aversion. However, any sign of easing geopolitical tensions or a surprisingly dovish economic data surprise could trigger a pullback, with $99.76 acting as the first key support.
Trade Scenarios for the DXY
Bearish Scenario: Dollar Reversal Looming?
25% ProbabilityConsolidation Scenario: Waiting Game
45% ProbabilityBullish Scenario: Dollar Strength Continues
30% ProbabilityFrequently Asked Questions: DXY Analysis
What happens if DXY breaks decisively above the $100.11 resistance level?
A sustained break above $100.11 would invalidate short-term bearish signals and likely trigger further upside momentum. This could see the DXY targeting the $100.21 resistance level, and potentially push towards the 100.50 psychological mark, especially if geopolitical fears continue to escalate and economic data remains supportive of a hawkish Fed stance.
Should I consider buying DXY at current levels around $99.91 given the mixed technical signals and geopolitical uncertainty?
Buying at current levels requires careful risk management. While the 1-hour and 4-hour charts show bullish momentum, the daily chart and RSI readings suggest caution. A prudent approach would be to wait for confirmation, perhaps a break above $100.11 or a pullback to a key support like $99.76, before committing. The probability of a continuation scenario is around 30%, suggesting risk is tilted towards a sideways or slightly bearish move in the short term.
Is the RSI at 69.84 on the 1-hour chart a direct sell signal for DXY right now?
An RSI reading of 69.84 is indeed approaching overbought territory, which historically can precede a pause or reversal. However, it's not an immediate sell signal on its own, especially with positive MACD momentum. It indicates that the upward move has been strong and may be due for consolidation or a minor pullback. Traders should look for further confirmation, such as bearish divergence or a break below the 1-hour support at $99.73, before acting on it as a sell signal.
How will upcoming US employment and inflation data impact the DXY's trend around the $99.91 level?
Stronger-than-expected employment or inflation figures would likely reinforce the DXY's bullish trend, potentially pushing it above $100.11 as it supports a hawkish Federal Reserve outlook. Conversely, weaker data could trigger a correction, with the DXY potentially testing support levels like $99.76 and $99.31, as it might fuel expectations of sooner Fed rate cuts. The current price at $99.91 is highly sensitive to these releases.
The DXY's journey through the coming week will be a compelling watch, shaped by the interplay of global risk sentiment and domestic economic forces. While geopolitical tensions currently favor the dollar's safe-haven status, the critical economic data releases loom large, holding the potential to recalibrate market expectations regarding Federal Reserve policy. Traders will be keenly observing whether the dollar can consolidate its gains above $99.91 or if a shift in economic fundamentals will lead to a reassessment. Patience and risk management remain paramount as the market navigates these complex dynamics.
| Indicator | Value | Signal | Interpretation |
|---|---|---|---|
| RSI (14) | 69.84 | Neutral | Approaching overbought territory on 1H, strong momentum on 4H. |
| MACD Histogram | Positive | Bullish | Positive momentum across timeframes, confirming recent uptrend. |
| Stochastic Oscillator | K=90.81, D=72.47 | Bearish | Overbought conditions on 1H suggest potential for short-term pullback. |
| ADX | 22.17 | Bullish | Moderate trend strength on 1H, indicating an established but not extreme trend. |
| Bollinger Bands | Upper Band | Bullish | Price trading above middle band on 1H/4H, indicating upward pressure. |
Bearish Scenario: Dollar Reversal Looming?
25% ProbabilityConsolidation Scenario: Waiting Game
45% ProbabilityBullish Scenario: Dollar Strength Continues
30% ProbabilityTrack markets in real-time
AI-powered analysis, technical indicators and real-time price data.
Join Our Telegram Channel
Breaking market news, AI analysis and trading signals instantly.
Join Channel