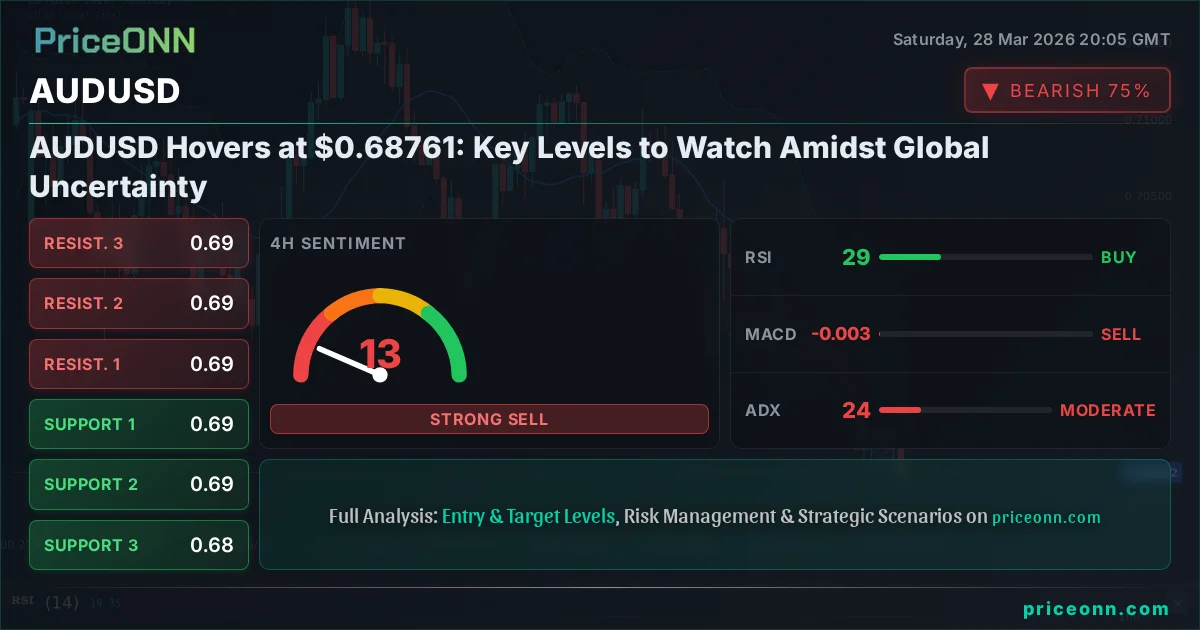
AUDUSD Hovers at $0.68761: Key Levels to Watch Amidst Global Uncertainty
AUDUSD trading at $0.68761, facing resistance at $0.69368. Key events to watch include upcoming US data releases and geopolitical developments.
The Australian Dollar (AUD) against the US Dollar (USD) has found itself in a tight range, trading around the $0.68761 mark as the week draws to a close. This consolidation phase for AUDUSD comes amidst a complex global backdrop, where escalating geopolitical tensions and resurgent inflation fears are creating a tug-of-war between risk-on and risk-off market sentiment. Traders are meticulously watching key technical levels and upcoming economic data, seeking clarity on the next directional move for this major currency pair. The current price action suggests a market in a holding pattern, awaiting a significant catalyst to break the stalemate.
- AUDUSD is consolidating around $0.68761, with critical resistance at $0.69368 and support at $0.68557.
- The DXY is showing strength, trading at 99.79, which typically puts pressure on AUDUSD.
- RSI(14) on the 1D chart sits at 37.44, indicating a bearish trend, while ADX at 24.76 suggests a moderate downtrend.
- Upcoming US economic data, particularly employment figures, will be crucial for shaping the AUDUSD's trajectory next week.
Last week's price action for AUDUSD painted a picture of indecision, with the pair failing to establish a clear trend. While there were attempts to push higher, notably testing resistance levels, the overarching sentiment has been one of caution. The Australian Dollar remains sensitive to global risk appetite, which has been volatile. Escalating geopolitical concerns, particularly in the Middle East, have intermittently fueled demand for safe-haven assets, often at the expense of riskier currencies like the AUD. Conversely, any signs of easing tensions or positive economic data from Australia could provide a temporary reprieve, but the global macroeconomic environment continues to cast a long shadow.
The interplay between the US Dollar Index (DXY) and AUDUSD remains a critical factor. With the DXY currently trading at 99.79 and showing a strong upward trend on the daily timeframe, the greenback is demonstrating resilience. This strength in the dollar typically acts as a headwind for currency pairs like AUDUSD, making Australian exports more expensive for dollar-based buyers and increasing the relative cost of servicing dollar-denominated debt. The daily ADX for DXY at 31.93 confirms a robust uptrend, suggesting that the dollar's strength is a significant force that AUDUSD traders cannot ignore. Any further strengthening of the DXY could exert additional downward pressure on AUDUSD.
Looking at the technical indicators for AUDUSD, the picture is mixed, reflecting the current consolidation phase. On the 1-hour chart, the trend is neutral with moderate strength (ADX: 21.96), suggesting a lack of strong directional conviction in the short term. However, the RSI(14) at 37.27 on the 1-hour chart indicates a bearish leaning, and the Stochastic oscillator (%K: 19.15, %D: 29.39) is deep in oversold territory, hinting at potential short-term bounces. The MACD histogram shows negative momentum, aligning with the bearish sentiment. This short-term picture suggests that while oversold conditions might offer brief opportunities for upside, the overall momentum is tilted downwards.
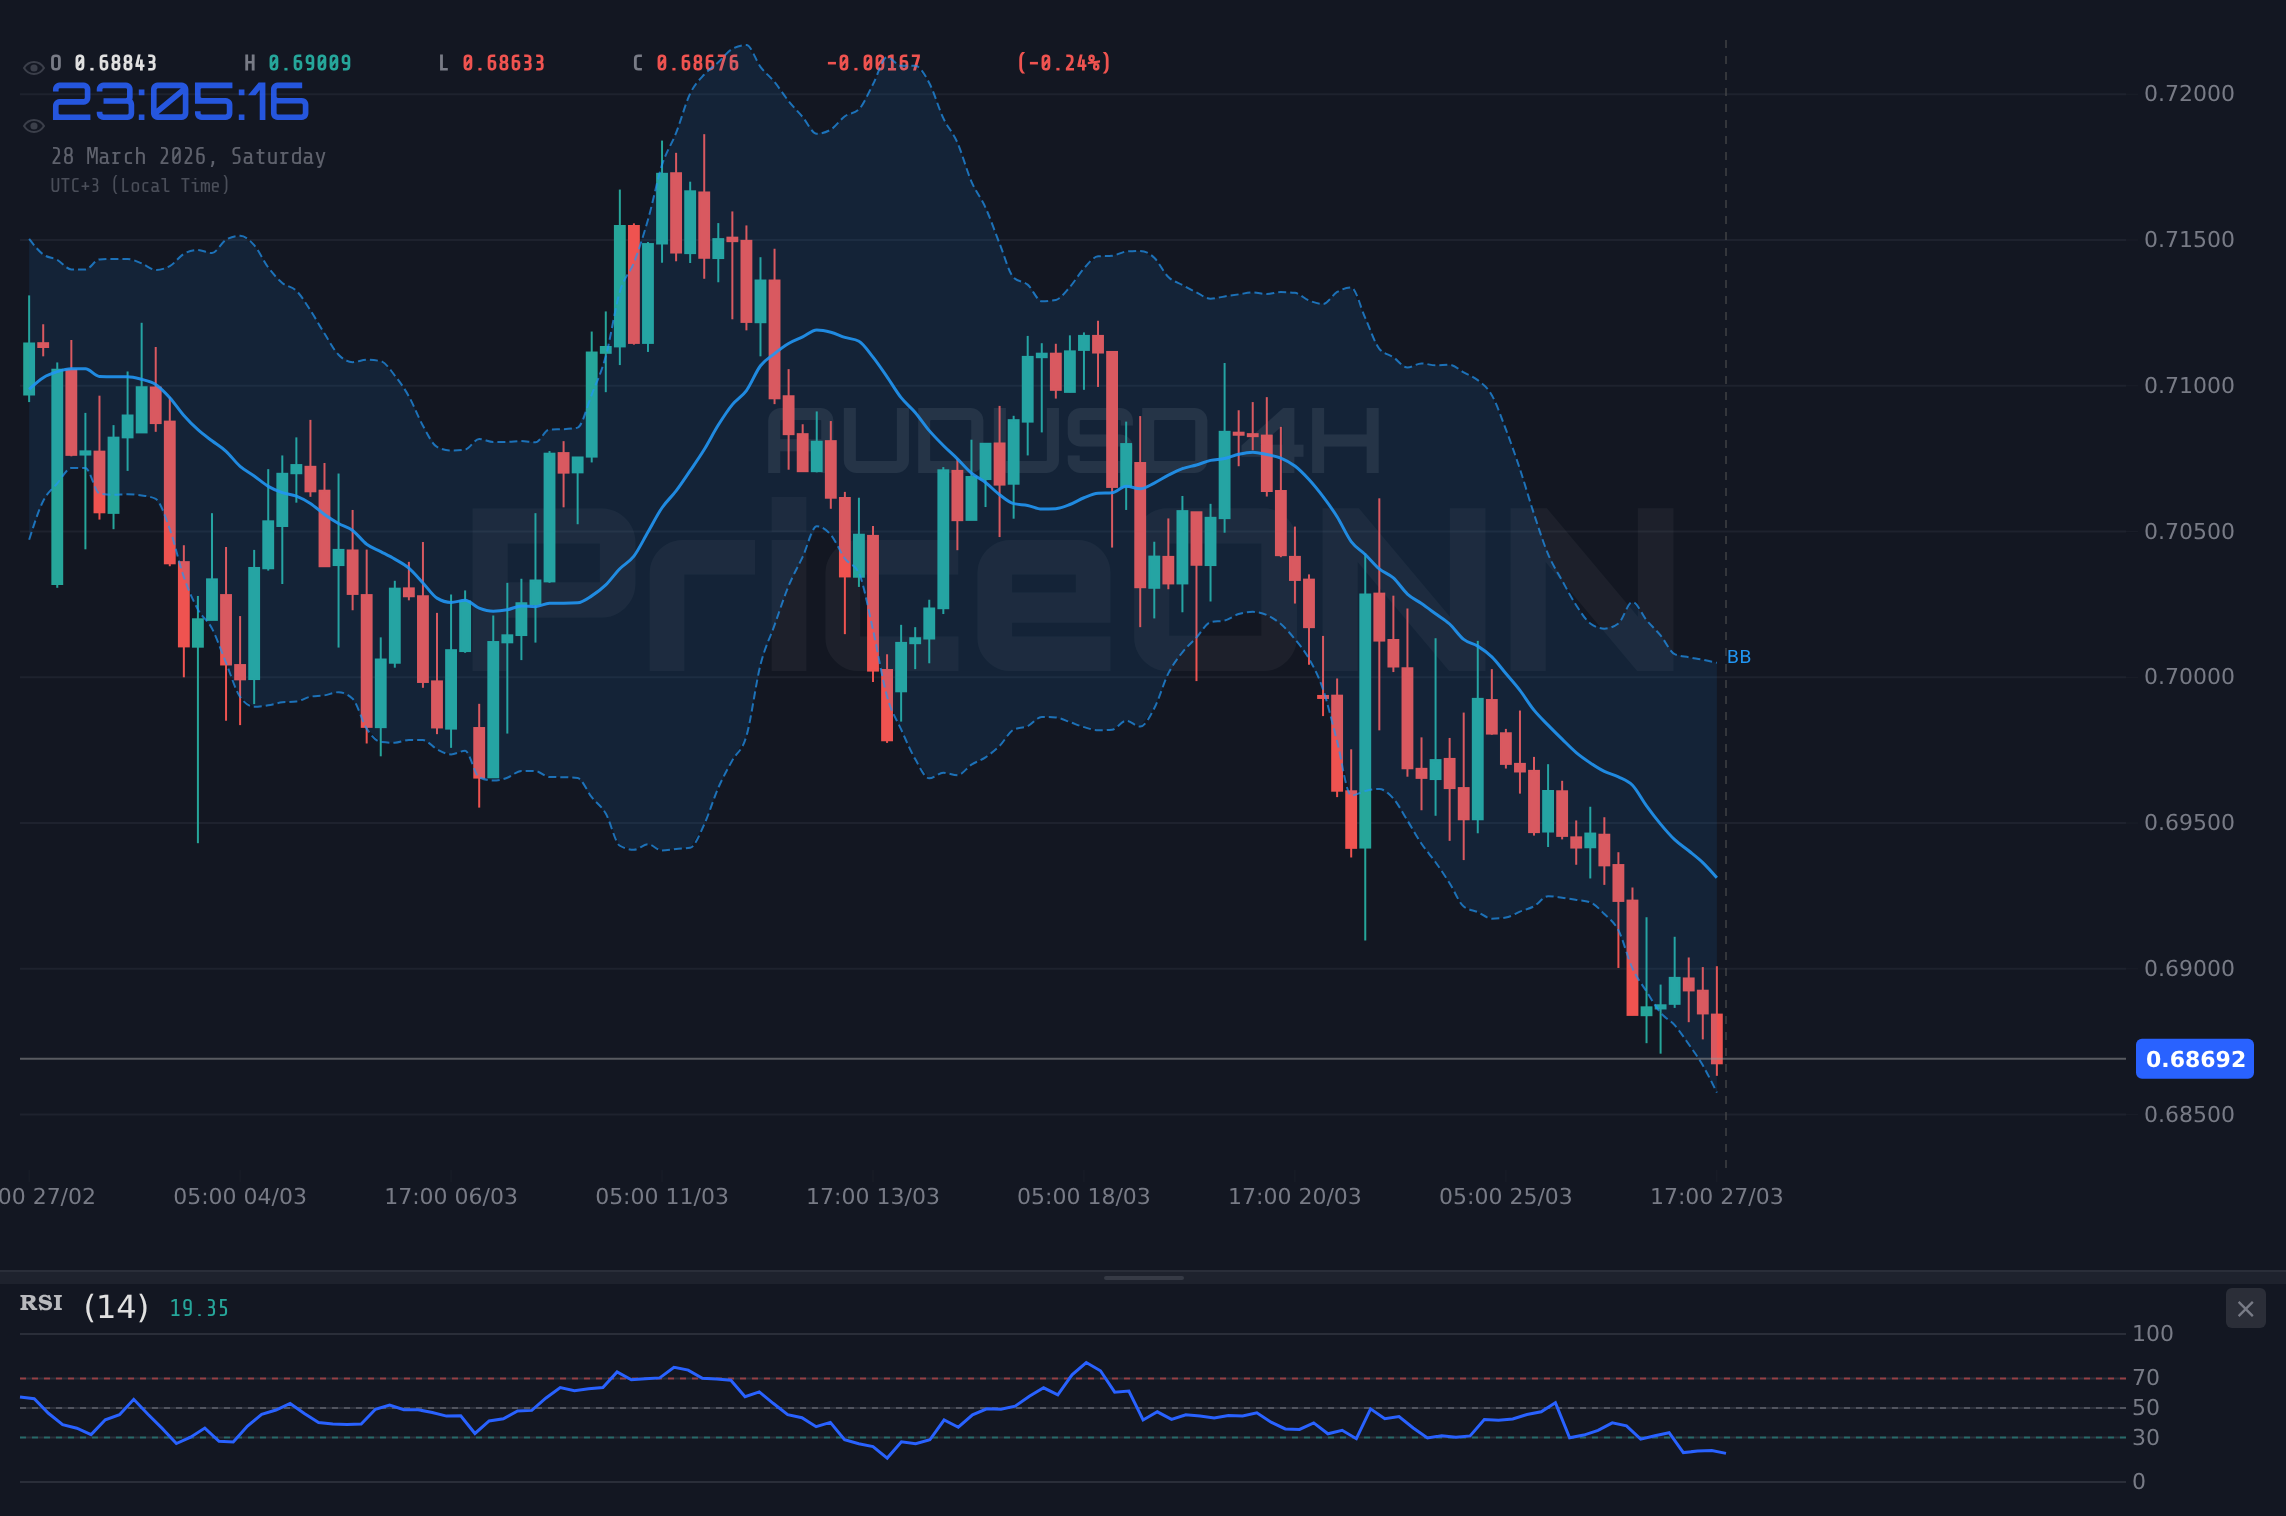
The 4-hour timeframe for AUDUSD presents a more bearish outlook. The trend is firmly in the 'Düşüş' (Downtrend) category with high strength (ADX: 24.01). The RSI(14) at 29.27 is firmly in oversold territory, suggesting that a bounce might be on the cards, but the prevailing trend remains a significant force. The Stochastic oscillator (%K: 15.59, %D: 17.31) also indicates oversold conditions, potentially signaling an imminent reversal or at least a pause in the downtrend. However, the MACD is showing negative momentum, reinforcing the bearish bias. This timeframe suggests that any upward movements might be corrective rather than indicative of a sustained trend reversal, especially if the daily trend remains dominant.
On the daily chart, the AUDUSD trend is currently neutral with moderate strength (ADX: 24.76), but the indicators paint a predominantly bearish picture. The RSI(14) at 37.44 is in the lower half of the neutral zone, leaning towards oversold, and the Stochastic oscillator (%K: 8.04, %D: 25.87) is also deeply oversold, suggesting that the pair is potentially due for a rebound. However, the MACD is showing negative momentum, and the Bollinger Bands are positioned below the middle band, indicating a bearish bias. The overall signal on the daily chart leans towards 'SAT' (Sell), with only 1 'AL' (Buy) signal against 7 'SAT' signals, underscoring the prevailing bearish sentiment despite potential oversold conditions.
The key levels to watch for AUDUSD are critical for understanding its potential path. On the downside, immediate support is seen at $0.68557, followed by $0.68245, and then a more significant level at $0.67746. A break below $0.68557 would likely accelerate selling pressure, targeting the lower support levels. On the upside, resistance is firmly placed at $0.69368. A decisive move above this level would be necessary to challenge the bearish narrative and potentially signal a shift in momentum. Further resistance lies at $0.69867 and $0.70179. The current price of $0.68761 sits precariously between these key levels, highlighting the importance of these price points as potential turning points.
The economic calendar provides crucial context for the upcoming week's potential movements. While today is a Saturday, the past few days and the upcoming week hold several high-impact events that could significantly influence AUDUSD. Notably, there are upcoming US data releases, including employment figures which are always a major market mover. The actual figures for a USD event on the calendar were 6.926 compared to a forecast of -1.3, indicating a significant beat that could strengthen the dollar. While specific dates are not provided for all events, the general expectation is that strong US data will continue to support the dollar, while any signs of weakness could provide AUDUSD with some breathing room. Conversely, Australian data, if any significant releases occur, will also play a role, though currently, the focus seems more heavily weighted towards US economic performance and global geopolitical events.
Geopolitical tensions continue to be a dominant theme influencing currency markets, including AUDUSD. The ongoing situation in the Middle East, with its direct impact on oil prices, creates a complex environment. Brent crude futures have seen substantial increases, driven by these tensions, which can indirectly affect the Australian Dollar through commodity prices and global inflation expectations. While Australia is a major commodity exporter, the immediate impact of rising oil prices on AUDUSD can be mixed, depending on the broader risk sentiment. If oil price surges lead to fears of global stagflation, it typically favors safe-haven assets and the US Dollar, putting downward pressure on AUDUSD. The news that US energy policy is shifting towards fossil fuels, as indicated by a $1 billion offer to halt offshore wind projects, adds another layer of complexity to the energy market outlook, potentially impacting global supply dynamics and price stability.
The correlation between AUDUSD and broader market sentiment, particularly equity markets, is another factor traders are closely monitoring. With the SP500 down 2% and Nasdaq down 2.23% on the day, risk appetite appears to be waning. This decline in major US stock indices suggests a 'risk-off' environment, which typically leads investors to seek refuge in perceived safe-haven assets. The US Dollar often benefits from such shifts, potentially reinforcing its strength against the Australian Dollar. While gold prices have surged significantly (XAUUSD up 2.68%), indicating a broader flight to safety, the simultaneous weakness in equities and strength in the DXY creates a nuanced picture. This divergence suggests that while some investors are hedging against inflation and geopolitical risks, others might be prioritizing the liquidity and perceived safety of the US Dollar.
The historical performance of AUDUSD during periods of global uncertainty often reveals a pattern of depreciation. When geopolitical risks escalate and inflation concerns mount, the US Dollar tends to outperform as a safe haven. This has been observed in recent weeks, with the US Dollar showing strength. The fact that AUDUSD is trading near its support levels, while facing resistance, indicates that the market is weighing these global factors heavily. The 'aud usd 0.7200 target' query, while currently distant and representing a significant upward move, highlights a potential longer-term aspiration for the pair, but the immediate fundamentals and technicals do not support such a target in the current environment. The focus remains on navigating the immediate price action around the $0.68761 level.
Fundamental analysis of AUDUSD requires a keen eye on the economic policies of both the Reserve Bank of Australia (RBA) and the US Federal Reserve. While specific RBA commentary on interest rates isn't detailed in the provided data, the general market expectation often revolves around the pace of monetary policy normalization. Any hints of a more hawkish stance from the RBA could support the Australian Dollar, whereas a dovish tone would likely weigh on it. Similarly, the Federal Reserve's stance on inflation and interest rates remains paramount. With the DXY showing strength and US economic data appearing robust, the Fed might be inclined to maintain a cautious or even hawkish outlook, which would continue to favor the US Dollar against the AUD. Traders will be dissecting every piece of commentary and data from both central banks for clues.
The 1D ADX for AUDUSD at 24.76 indicates a moderately strong downtrend, suggesting that the prevailing bearish momentum has some conviction behind it. This is corroborated by the RSI(14) at 37.44, which, while approaching oversold territory, is still well within the bearish range. The Stochastic oscillator, with %K at 8.04 and %D at 25.87, is deeply oversold, signalling potential for a short-term bounce. However, the MACD's negative momentum and the position of the price below the middle Bollinger Band point to underlying weakness. This confluence of indicators on the daily timeframe suggests that any rallies might be met with selling pressure, making it crucial to monitor the $0.69368 resistance level.
The concept of 'audusd fundamentals' is multifaceted, encompassing everything from commodity prices and interest rate differentials to geopolitical risks and global growth prospects. Currently, the fundamental picture is clouded by uncertainty. Rising oil prices, while beneficial for some commodity currencies, are also fueling inflation fears, which could lead to tighter monetary policy globally, potentially slowing growth. This creates a dilemma for currencies like the AUD, which are sensitive to global economic health. The strength of the US Dollar, driven by safe-haven demand and robust US economic data, further complicates the fundamental outlook, suggesting that the path of least resistance for AUDUSD might continue to be downwards in the short to medium term, unless a significant shift in global risk sentiment or central bank policy occurs.
Scenario Analysis for AUDUSD: Navigating the Uncertainty
Bearish Scenario: Downside Pressure Mounts
65% ProbabilityNeutral Scenario: Range-Bound Consolidation Continues
25% ProbabilityBullish Scenario: Rebound from Support
10% ProbabilityThe path forward for AUDUSD appears to be heavily influenced by external factors. The strength of the US Dollar, driven by safe-haven flows and a potentially robust US economy, remains a primary concern. Geopolitical developments and their impact on oil prices and global inflation expectations will continue to create volatility. For traders, patience and risk management will be paramount. Monitoring the key levels of $0.68557 support and $0.69368 resistance will be crucial. A decisive break through either of these levels, especially on significant volume and in conjunction with shifts in broader market sentiment, could signal the next significant move. Until then, expect choppy trading conditions.
Frequently Asked Questions: AUDUSD Analysis
What happens if AUDUSD breaks below the $0.68557 support level?
A break below $0.68557 would likely signal a continuation of the bearish trend, invalidating the neutral outlook. This could accelerate selling pressure, with traders targeting the next support level at $0.68245. This scenario gains probability if global risk aversion intensifies or US economic data remains strong, reinforcing the DXY.
Should I consider buying AUDUSD at current levels around $0.68761 given the oversold RSI?
While the RSI(14) at 37.44 on the daily chart and Stochastic deep in oversold territory suggest potential for a short-term bounce, buying at current levels carries significant risk. The prevailing bearish trend, strong DXY, and geopolitical uncertainties mean that any rally could be short-lived. A more prudent approach would be to wait for confirmation, such as a confirmed break above $0.69368 resistance, or a clear bullish divergence on higher timeframes, before considering long positions.
Is the ADX reading of 24.76 on the daily chart a strong sell signal for AUDUSD?
An ADX value of 24.76 indicates a moderately strong downtrend, confirming that the bearish momentum has some conviction. While not an absolute sell signal on its own, it reinforces the bearish bias suggested by other indicators like the RSI and MACD. This suggests that the market is trending downwards, and any counter-trend rallies are likely to face resistance, making it a challenging environment for buyers.
How will upcoming US employment data potentially affect AUDUSD next week?
Stronger-than-expected US employment figures, especially Non-Farm Payrolls (NFP), could significantly boost the US Dollar (DXY) due to increased expectations for Fed hawkishness or a resilient US economy. This would likely put further downward pressure on AUDUSD, potentially pushing it towards the $0.68557 support level. Conversely, weaker data could lead to a dollar pullback and a relief rally for AUDUSD, possibly testing resistance near $0.69368.
The AUDUSD pair is currently navigating a complex landscape, characterized by conflicting signals and external market pressures. While oversold conditions on shorter timeframes might hint at a potential for short-term bounces, the broader technical picture and fundamental drivers, particularly the strength of the US Dollar and geopolitical risks, suggest that downside risks remain elevated. Traders should remain vigilant, focusing on the key support and resistance levels identified. Patience and disciplined risk management will be essential in navigating the choppiness that is likely to persist until a clearer directional catalyst emerges.
Technical Outlook Summary
| Indicator | Value | Signal | Interpretation |
|---|---|---|---|
| RSI (14) | 37.44 | Bearish | Nearing oversold, but trend remains down. |
| MACD Histogram | -0.001 | Bearish | Negative momentum persists. |
| Stochastic | 8.04 / 25.87 | Bearish | Deeply oversold, potential for bounce but trend is down. |
| ADX | 24.76 | Bearish Trend | Moderately strong downtrend. |
| Bollinger Bands | Below Middle Band | Bearish | Price under downward pressure. |
Track markets in real-time
AI-powered analysis, technical indicators and real-time price data.
Join Our Telegram Channel
Breaking market news, AI analysis and trading signals instantly.
Join Channel