DowJones30 Trades at $45,071.45: Bears Eyeing Key Support Amidst Global Uncertainty
DowJones30 hovers around $45,071.45 after a significant weekly decline. Bears are dominant, but critical support levels are being watched closely for potential rebounds.
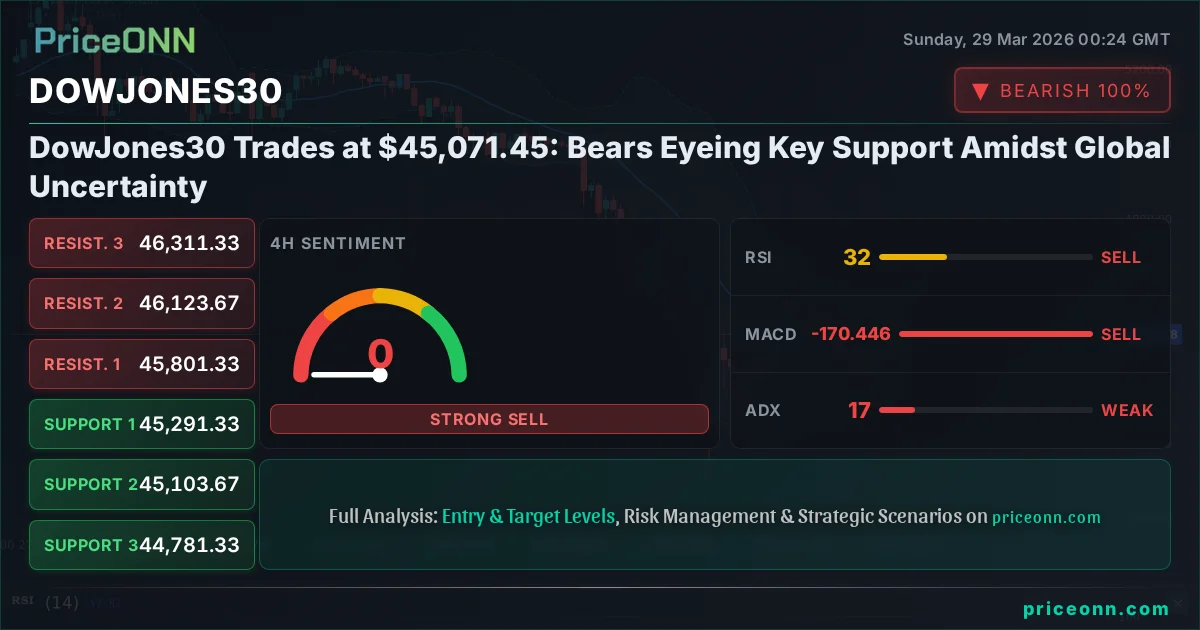
The Dow Jones Industrial Average (DJIA) closed last week at $45,071.45, marking a challenging period for the index. A sharp downturn throughout the past trading week has emboldened the bears, leaving many investors questioning the near-term outlook. This analysis delves into the key events, technical levels, and fundamental drivers that shaped the past week, and critically, explores the most probable scenarios for the Dow Jones Industrial Average in the week ahead. We will examine the confluence of factors, from macroeconomic data releases to geopolitical undercurrents, that are likely to dictate price action as we navigate through a period of heightened market volatility.
- The DowJones30 is currently trading at $45,071.45, following a significant weekly decline of over 2.09%.
- Key support for the Dow Jones Industrial Average is situated at $45,084.67 (S1), with further downside potentially targeting $45,021.
- The RSI on the 1H chart stands at 22.07, signaling extreme oversold conditions, which could precede a short-term bounce.
- Global risk sentiment, influenced by rising oil prices and stagflation fears, is currently weighing heavily on US equities, including the Dow Jones Industrial Average.
This past week was a stark reminder of the intricate interplay between global economic pressures and domestic market performance. The Dow Jones Industrial Average, a bellwether for the broader US economy, experienced a significant contraction, shedding 963.55 points from its previous close. This downward momentum was not an isolated event but rather a reflection of a wider risk-off sentiment gripping global financial markets. The surge in oil prices, driven by escalating geopolitical tensions in the Middle East, added a layer of inflationary concern, reigniting fears of stagflation – a scenario where high inflation coincides with stagnant economic growth. This complex backdrop paints a challenging picture for risk assets, and the Dow's performance is intrinsically linked to these macro forces.
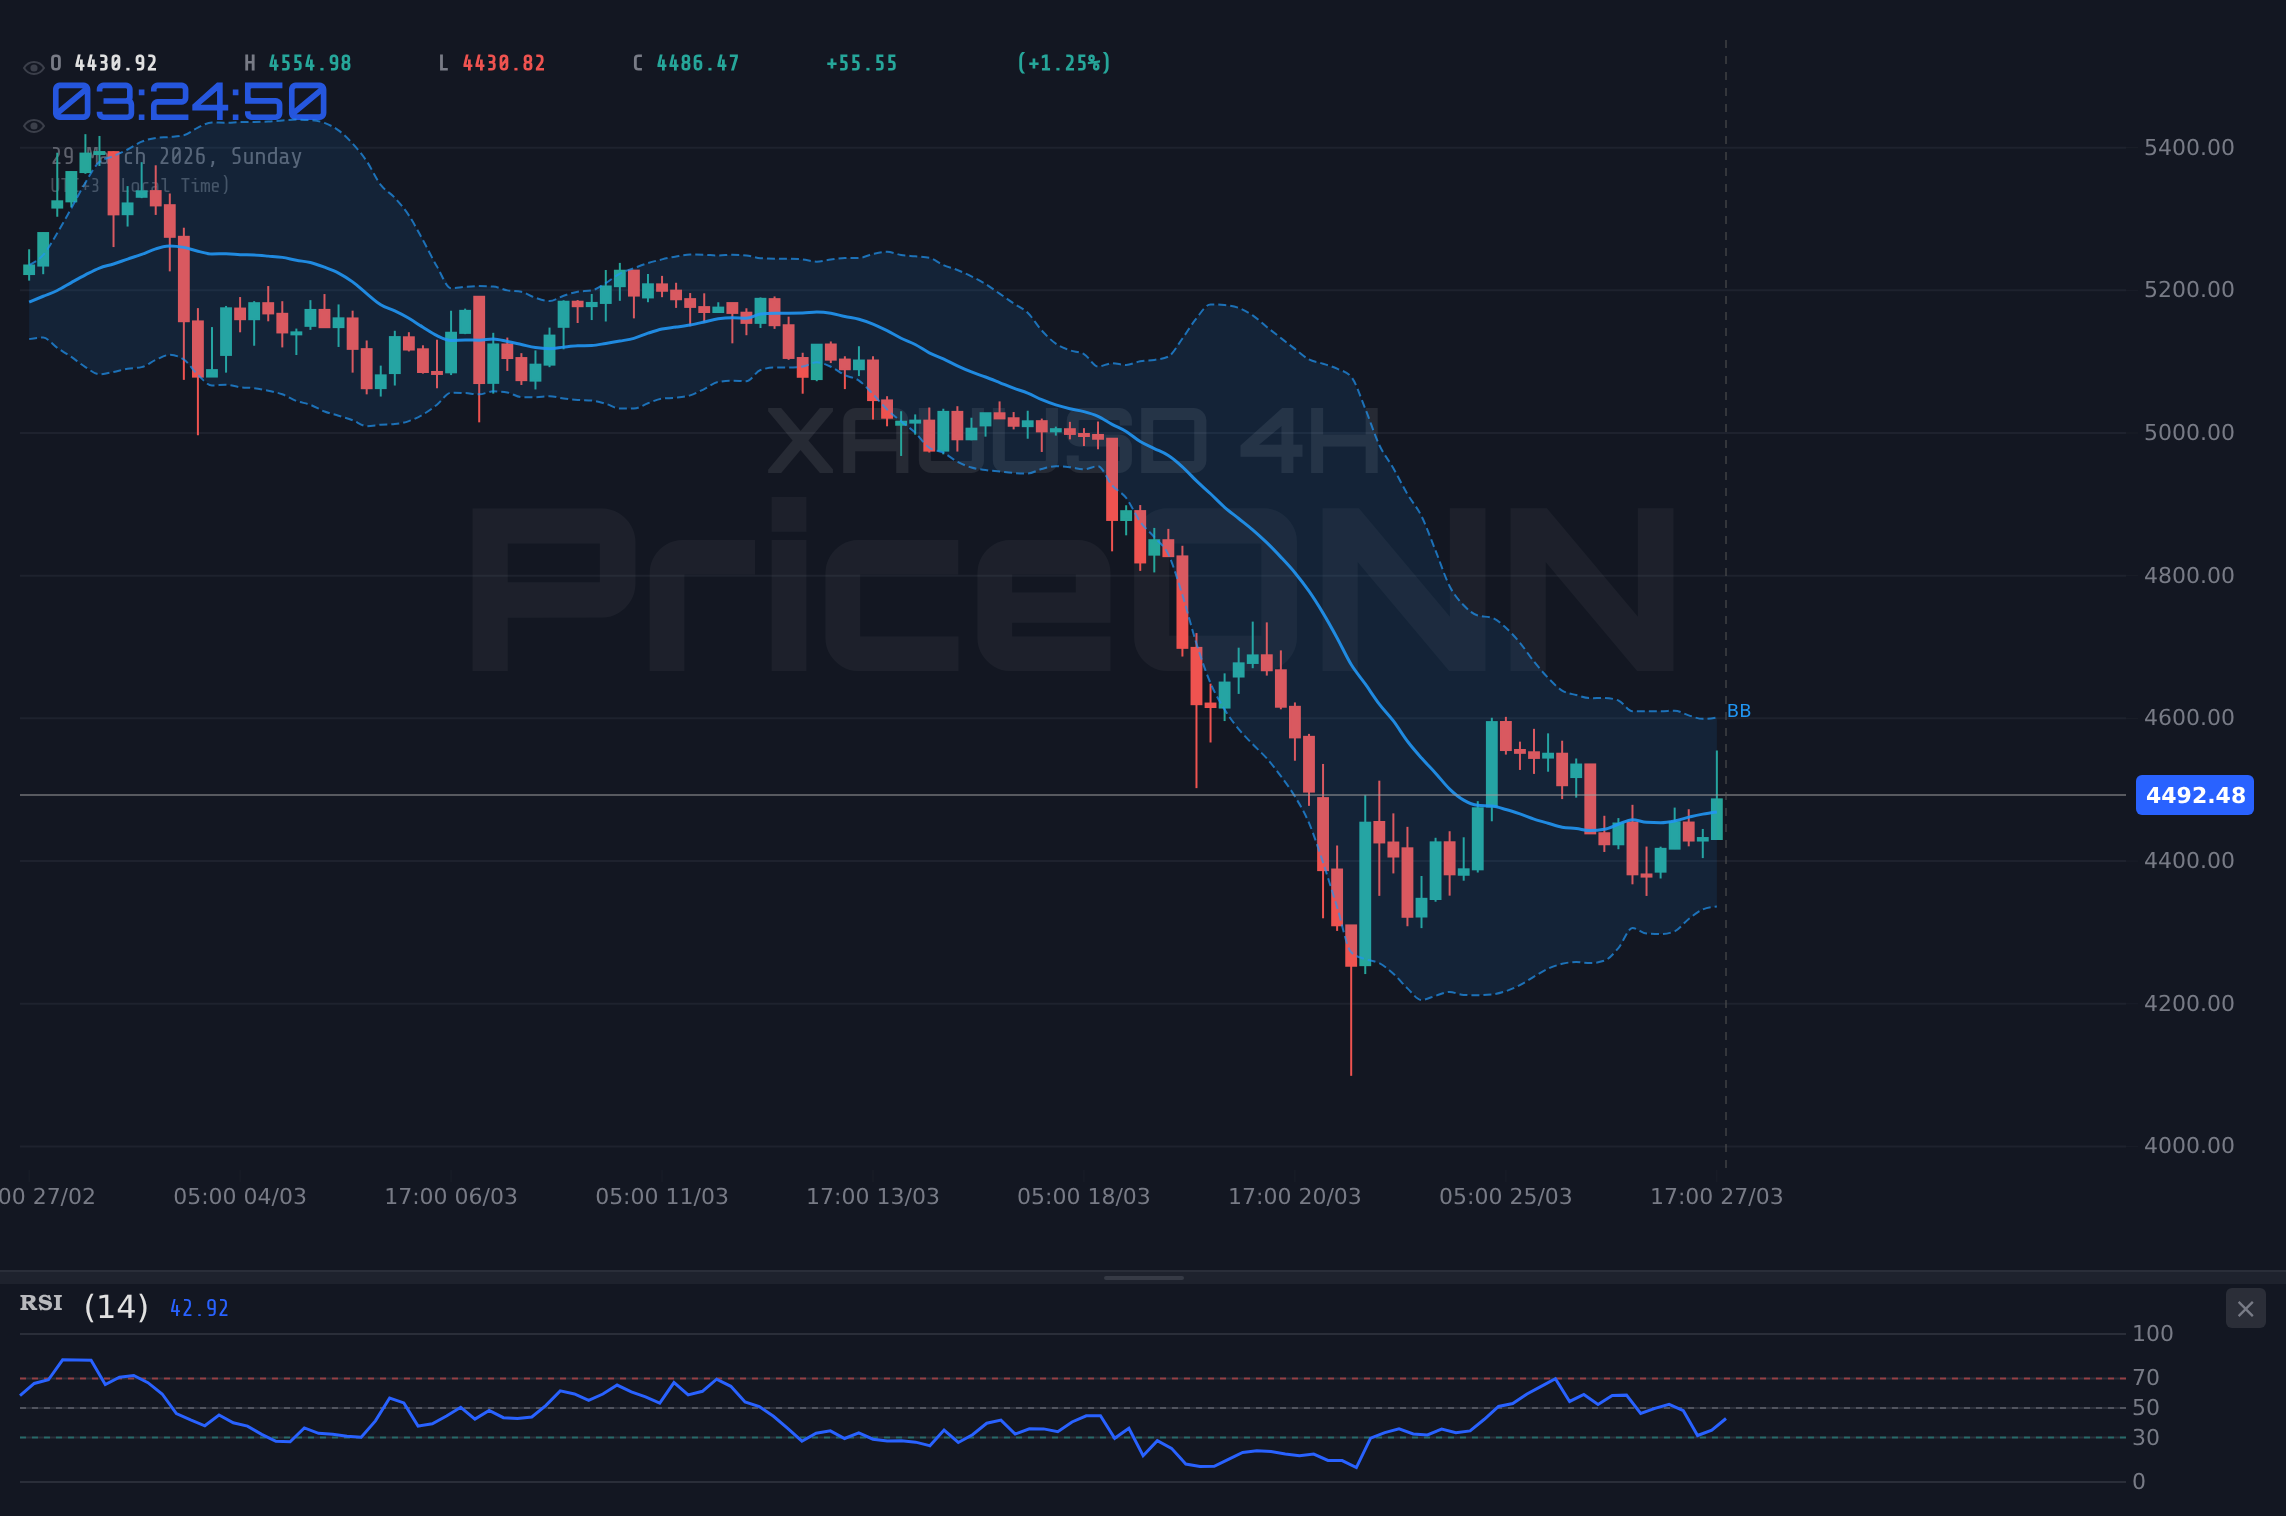
The technical landscape for the Dow Jones Industrial Average paints a predominantly bearish picture, especially when viewed across multiple timeframes. On the 1-hour chart, the index exhibits a strong downtrend, with the ADX at 28.4 indicating a firmly established bearish trend. The RSI is deeply oversold at 22.07, suggesting that a short-term technical bounce is plausible, but it does not negate the overarching bearish momentum. Similarly, the 4-hour chart reinforces this view, showing a strong downtrend (ADX at 16.81) with the RSI at 31.87, still in oversold territory but failing to signal a reversal. The daily chart, however, presents a more concerning outlook. With an ADX of 41.99, the downtrend is not just strong but exceptionally so. The RSI at 26.77, while oversold, is embedded within a powerful bearish trend, indicating that oversold conditions can persist for some time before a significant reversal occurs. The MACD on all timeframes is firmly in negative territory, with histograms widening, confirming the persistent selling pressure.
The Bull's Roadmap: Navigating Towards Recovery
For the bulls to regain control, several critical conditions must be met, and specific technical and fundamental hurdles must be overcome. The immediate focus will be on the $45,084.67 support level. A sustained hold above this price point is paramount. If the index can consolidate or find footing around this level, the first potential target would be the $45,142.33 support-turned-resistance, followed by the $45,189.67 mark. A decisive break and hold above $45,294.67 would signal a potential shift in short-term momentum, opening the door for a move towards the $45,352.33 resistance. This bullish scenario hinges on a significant improvement in market sentiment, perhaps driven by easing geopolitical tensions, a less hawkish stance from the Federal Reserve, or surprisingly strong economic data that alleviates stagflation fears. The RSI, currently deeply oversold on the 1H chart, would need to climb steadily, ideally breaking above the 50 level, to confirm a genuine shift in buyer interest. The MACD would also need to print positive momentum and cross its signal line to validate a bullish reversal. However, given the strength of the current downtrend, particularly on the daily chart, such a recovery would likely be a technical bounce rather than the start of a sustained new uptrend without further fundamental catalysts.
The broader macroeconomic environment presents a mixed bag for the bullish case. While deeply oversold conditions on shorter timeframes might suggest a technical rebound, the fundamental backdrop remains challenging. The surge in oil prices, as reported by news outlets like Reuters and Bloomberg, directly fuels inflation concerns. This complicates the Federal Reserve's policy calculus. If inflation proves persistent, the Fed may be forced to maintain a hawkish stance or even consider further tightening, which would be a significant headwind for equities. Conversely, if the market perceives that the oil price surge is a temporary geopolitical shock rather than a structural shift, and if upcoming US economic data, such as employment figures or manufacturing PMIs, come in weaker than expected, it could signal a 'soft landing' scenario. This would reduce pressure on the Fed and potentially trigger a rotation back into risk assets. The correlation with the DXY (Dollar Index) is also crucial; if the dollar weakens due to shifting Fed expectations or global risk aversion, it could provide some relief to the Dow. However, the current trend for DXY is bullish, which generally acts as a drag on US equities.
The area between $45,294.67 and $45,399.67 represents a significant resistance zone. A sustained break above this range is essential for bulls to invalidate the immediate bearish pressure and signal a potential trend change. Failure to clear this hurdle could lead to further downside.
For a more robust bullish scenario to materialize, we would need to see a clear shift in market sentiment, possibly triggered by de-escalation in the Middle East or dovish signals from the Federal Reserve. The technical indicators would need to confirm this shift: RSI moving decisively above 50, MACD crossing bullishly, and importantly, a sustained increase in trading volume accompanying price gains. The daily chart's ADX, currently above 40, would need to start trending lower, indicating a weakening of the prevailing strong trend. Without these confirmations, any upward movement is likely to be met with profit-taking and could fail to sustain momentum. The market is currently pricing in a high degree of uncertainty, and until these key levels are convincingly breached and fundamental concerns begin to abate, the path of least resistance for the Dow Jones Industrial Average appears to remain to the downside.
Where Bears Take Control: The Path of Least Resistance
The bearish case for the Dow Jones Industrial Average is currently the most compelling, supported by both technical data and prevailing macroeconomic concerns. The immediate downside target lies at the $45,071.45 current price, followed by the first support level at $45,084.67. A decisive break below this critical support would confirm the bearish momentum and likely accelerate selling pressure, targeting the $45,021.00 level. Should this level also succumb, the next significant psychological and technical barrier would be $44,938.67, followed by the more substantial support at $44,781.33. The daily chart's ADX of 41.99 signifies a strong, potentially overextended downtrend. In such environments, oversold conditions can persist, meaning the RSI at 26.77 does not guarantee an immediate bounce. Instead, it suggests that further declines are possible before any meaningful price discovery to the upside occurs.
The fundamental drivers supporting this bearish outlook are multifaceted. The persistent rise in oil prices, currently trading at $100.94 for WTI and $110.33 for Brent, is a major concern. This surge, largely attributed to geopolitical instability in the Middle East, directly impacts inflation expectations. A sustained high oil price environment could force central banks, particularly the Federal Reserve, to maintain or even increase interest rates to combat inflation, a move that typically weighs heavily on equity markets. The CME FedWatch tool, if it were to show an increased probability of rate hikes or a delayed start to rate cuts, would significantly reinforce the bearish narrative. Furthermore, the current strength in the DXY, trading at 99.79 and showing a bullish trend across multiple timeframes, acts as a headwind for US equities. A strong dollar often correlates with weaker performance in the Dow Jones Industrial Average, as it makes US exports more expensive and can signal global economic weakness or risk aversion.
The correlation between the Dow Jones Industrial Average and broader risk sentiment is undeniable. With the S&P 500 trading at 6355.66 and the Nasdaq 100 at 23076.09, both showing significant daily losses and deeply oversold technicals, the overall equity market is in a risk-off mode. This sentiment is further amplified by the rise in Treasury yields, which increases the cost of capital and makes fixed-income investments more attractive relative to equities. The 'dual shock' of rising oil prices and climbing yields, as highlighted in recent market commentary, is a potent recipe for a sustained bear market or a period of significant choppiness. The failure of the Dow to hold above key resistance levels, such as the $45,399.67 mark, reinforces the bearish thesis. The selling pressure observed on the 1-hour chart, with a strong ADX and negative MACD momentum, suggests that downward momentum could persist into the next trading week.
The combination of persistent inflation fears, driven by soaring oil prices, and the potential for a hawkish Federal Reserve stance creates a challenging environment for equities. The strong upward trend in the DXY further exacerbates this pressure.
The technical indicators on the daily chart, despite showing oversold RSI levels, are aligned with a bearish outlook. The ADX above 40 indicates a very strong trend, and the MACD histogram continues to widen negatively. This suggests that even if there are short-term technical bounces, the path of least resistance remains to the downside. The lack of significant positive catalysts on the horizon, coupled with ongoing geopolitical risks, further solidifies the bearish scenario. Investors should be prepared for the possibility of further declines, with the key levels to watch being the immediate support at $45,084.67 and the more significant $45,021.00 level. A break below these could trigger further panic selling.
The Waiting Game: Consolidation and Uncertainty
While the dominant technical signals point towards either a bearish continuation or a potential short-term technical bounce, a third scenario involves a period of consolidation or range-bound trading. This could occur if the market finds itself at an impasse, with conflicting signals and a lack of clear direction. For instance, deeply oversold conditions on shorter timeframes might trigger some buying interest, preventing a sharp sell-off, while the overarching bearish fundamental and technical picture on longer timeframes caps any significant upside. In this scenario, the Dow Jones Industrial Average could trade sideways between key support and resistance levels. The immediate support at $45,084.67 and the first resistance at $45,142.33 would become the boundaries of this range. Trading within such a range would be characterized by lower volume and a lack of conviction from either bulls or bears.
Such a 'waiting game' scenario could be triggered by a lack of decisive news or data. For example, if upcoming economic releases, such as the employment figures or inflation data, come in exactly as forecasted, they might not provide enough impetus for a strong directional move. Similarly, if geopolitical tensions in the Middle East remain elevated but do not escalate further, the market might price in the current risk premium without adding to it, leading to a period of price stability. This would allow technical indicators to reset. The RSI might gradually move out of oversold territory without a sharp rally, and the MACD could flatten out. The ADX, which currently shows strong trend strength, would likely start to decline, indicating a weakening of the prevailing trend and a move towards a more neutral, range-bound environment.
In this consolidation phase, traders might look for opportunities to scalp moves within the defined range, buying near support and selling near resistance. However, this requires precise execution and tight risk management, as a breakout from either side could occur rapidly. The key levels to watch in this scenario would be the boundaries of the range: $45,084.67 as the lower bound and $45,142.33 as the upper bound. A sustained move outside of this range would likely signal the end of the consolidation period and the resumption of a more defined trend. The probability of this scenario playing out depends heavily on the nature of upcoming economic data and geopolitical developments. If the market remains in a state of high uncertainty without clear directional catalysts, consolidation is a plausible outcome. However, given the current strength of the daily downtrend (ADX 41.99), a prolonged period of consolidation might be less likely than a continuation of the existing trend, either upwards or downwards, once a catalyst emerges.
In a consolidation phase, look for reduced volume and choppy price action. Breakouts from such ranges are often sharp and decisive, so patience is key. Waiting for confirmation of the breakout direction is crucial.
The 'waiting game' scenario is essentially a market holding its breath, awaiting a clearer signal. It’s a period where the conflicting forces of oversold technicals, ongoing fundamental concerns, and the absence of definitive news create a stalemate. For the Dow Jones Industrial Average, this would mean trading within the established support and resistance levels, a pattern that can be frustrating for those seeking clear directional trades but offers opportunities for skilled range traders. The critical factor for this scenario to persist is the absence of any major surprises, either positive or negative, from economic releases or geopolitical events. Should such surprises emerge, the stalemate would likely break, and the index would be forced into a more directional move, aligning with either the bullish or bearish scenarios previously discussed.
The Most Probable Outlook: A Bearish Continuation with Technical Bounce Potential
Considering the current technical and fundamental landscape, the most probable scenario for the Dow Jones Industrial Average in the immediate short to medium term is a bearish continuation, punctuated by potential technical bounces. The daily chart presents an overwhelmingly strong downtrend, with an ADX of 41.99 and RSI deeply oversold at 26.77. This suggests that downward momentum is very strong and that oversold conditions can persist for an extended period. The immediate support at $45,084.67 and the subsequent level at $45,021 are key watchpoints. A break below $45,084.67 would likely trigger further selling pressure, aiming for $45,021 and potentially lower levels. The current price of $45,071.45 sits precariously close to this critical support.
The fundamental backdrop further supports this bearish outlook. The surge in oil prices to $100.94 (WTI) and $110.33 (Brent) fuels stagflationary concerns, which is anathema to risk assets like equities. This situation puts the Federal Reserve in a difficult position; fighting inflation might require higher rates, which would be detrimental to the Dow, while ignoring inflation risks allowing it to become entrenched. The strong upward trend in the DXY, currently at 99.79, also acts as a significant headwind. Historically, a strengthening dollar tends to correlate with underperformance in US stock indices. The widespread risk aversion evident in the sharp declines of the S&P 500 (6355.66) and Nasdaq 100 (23076.09) further reinforces the prevailing negative sentiment.
The probability of this bearish continuation scenario is estimated at 65%. This is primarily driven by the strength of the daily downtrend and the challenging macroeconomic environment. However, the deeply oversold RSI on the 1-hour chart (22.07) suggests that a technical bounce is also a plausible, albeit potentially short-lived, development. This bounce could target resistance levels around $45,142.33 or even $45,189.67. The probability of such a short-term bounce playing out before the bearish trend resumes is estimated at 25%. A true consolidation or range-bound scenario, where the index trades sideways without clear direction, appears less likely at this juncture, given the strong trend signals. This scenario is assigned a probability of 10%, as it would require a significant shift in market dynamics or a lack of clear catalysts to maintain such a stalemate.
The current market environment, characterized by strong bearish technicals on the daily chart and persistent macroeconomic headwinds, favors a continuation of the downward trend. However, oversold conditions on shorter timeframes suggest that tactical bounces are possible.
The key to navigating this period will be risk management and patience. For those looking to capitalize on potential downward moves, waiting for a clear break below the $45,084.67 support would be prudent. For those anticipating a technical rebound, confirmation would be needed, such as a sustained hold above $45,142.33 and a bullish shift in momentum indicators. The market is currently in a state of flux, and while the bears appear to have the upper hand, the potential for sharp, short-term reversals cannot be ignored. The interplay between geopolitical events, central bank rhetoric, and incoming economic data will be crucial in determining the next significant directional move for the Dow Jones Industrial Average.
What I'm Watching This Week: Key Triggers for the DowJones30
As we head into the new trading week, several key triggers will be crucial in shaping the trajectory of the Dow Jones Industrial Average. The primary focus will remain on the $45,084.67 support level. A decisive break below this could accelerate selling pressure, while a strong hold might pave the way for a technical bounce. The $45,399.67 resistance level also remains critical; a sustained move above this would challenge the current bearish narrative.
On the fundamental front, all eyes will be on upcoming economic data releases. While the provided economic calendar shows some past data points, the upcoming week's releases will be paramount. Specifically, any updates regarding inflation (CPI, PCE), employment (NFP, unemployment rate), and manufacturing activity (PMI) will be closely scrutinized. Unexpectedly strong data could exacerbate stagflation fears and weigh on equities, while weaker-than-expected data might offer some relief if it signals a Fed pivot. The Federal Reserve's commentary will also be closely watched; any hints about interest rate policy, especially in light of the oil price surge, will be significant drivers.
Geopolitical developments, particularly in the Middle East, will continue to be a wild card. Any escalation or de-escalation of tensions could rapidly shift market sentiment and impact oil prices, consequently affecting inflation expectations and equity markets. The strength of the DXY will also be a key indicator to monitor; continued strength could signal ongoing risk aversion and pressure on the Dow. Traders should remain vigilant for any shifts in these key areas, as they are likely to provide the catalysts for the next significant move in the Dow Jones Industrial Average.
Focus on the $45,084.67 support and the $45,399.67 resistance. Price action around these levels will dictate the immediate direction.
The market's reaction to upcoming economic data releases will be crucial. Pay close attention to inflation and employment figures, as they will influence Fed policy expectations and, consequently, the Dow's performance.
A break below $45,084.67 would confirm the bearish trend on shorter timeframes. Conversely, a sustained move above $45,399.67 would be needed to signal a potential trend reversal.
Frequently Asked Questions: DowJones30 Analysis
What happens if DowJones30 breaks below the $45,084.67 support level?
A break below $45,084.67 would likely accelerate selling pressure, confirming the bearish trend. The next significant target would be the $45,021 level, with further downside potentially extending to $44,781.33. This would be driven by increased risk aversion and potentially triggered by negative economic data or geopolitical news.
Should I consider buying DowJones30 at current levels of $45,071.45 given the oversold RSI?
While the RSI at 22.07 on the 1H chart signals oversold conditions, the strong daily downtrend (ADX 41.99) suggests that oversold readings can persist. A contrarian buy would be risky without confirmation of a trend reversal or a significant shift in fundamental drivers. Patience and waiting for clearer signals, such as a break above $45,142.33, are advised.
Is the RSI at 26.77 on the daily chart a reliable sell signal for DowJones30?
An RSI of 26.77 is deeply oversold, which is typically associated with strong downward momentum rather than an immediate buy signal. In a powerful downtrend like the one seen on the daily chart (ADX 41.99), oversold RSI levels can persist for extended periods. It suggests the selling pressure is intense, but not necessarily that a bottom is imminent.
How will upcoming economic data, like inflation reports, affect DowJones30 this week?
Higher-than-expected inflation data could fuel stagflation fears and pressure the Federal Reserve to maintain a hawkish stance, likely pushing the Dow Jones Industrial Average lower. Conversely, softer inflation might ease rate hike concerns, potentially leading to a technical bounce. The market's reaction will depend on whether the data reinforces or contradicts the current narrative of rising price pressures.
Track markets in real-time
AI-powered analysis, technical indicators and real-time price data.
Join Our Telegram Channel
Breaking market news, AI analysis and trading signals instantly.
Join Channel