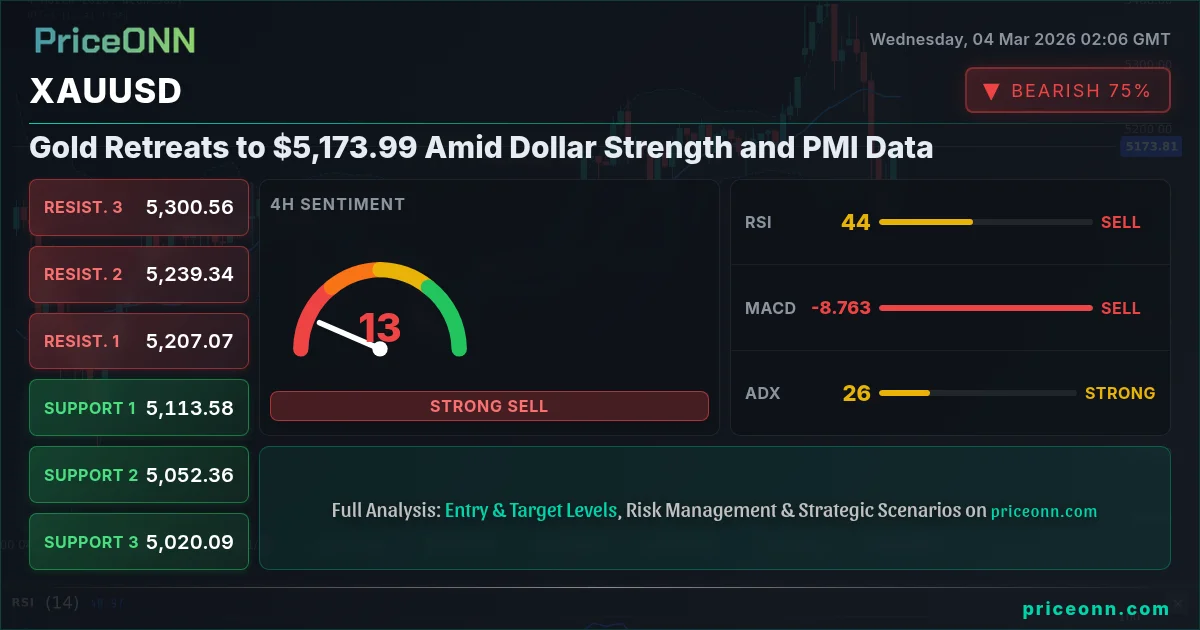
Gold is trading lower today, hovering around $5,173.99, as a stronger dollar and mixed PMI data weigh on the precious metal. The "gold market outlook today" hinges on geopolitical tensions and upcoming U.S. economic data releases, particularly the U.S. ADP Nonfarm Employment Change and ISM Non-Manufacturing PMI.
- RSI at 47.8 on the 1H chart indicates neutral momentum with a slight bearish tilt.
- Key support level at $5,115.98 needs to hold to prevent further downside.
- The MACD histogram on the 1H chart shows positive momentum, potentially offering a short-term bounce.
- DXY strength, currently at 98.89, is exerting downward pressure on XAUUSD.
Having tracked XAUUSD through multiple economic cycles, I can say that gold's current pullback presents an interesting setup. The strength in the dollar, with the DXY index at 98.89, is certainly a headwind for gold. Typically, a rising DXY puts pressure on gold, and we're seeing that play out today. However, with geopolitical risks still simmering, the safe-haven demand for gold could quickly return. According to Reuters, geopolitical tensions continue to fuel uncertainty in the market, which could provide a floor for gold prices.
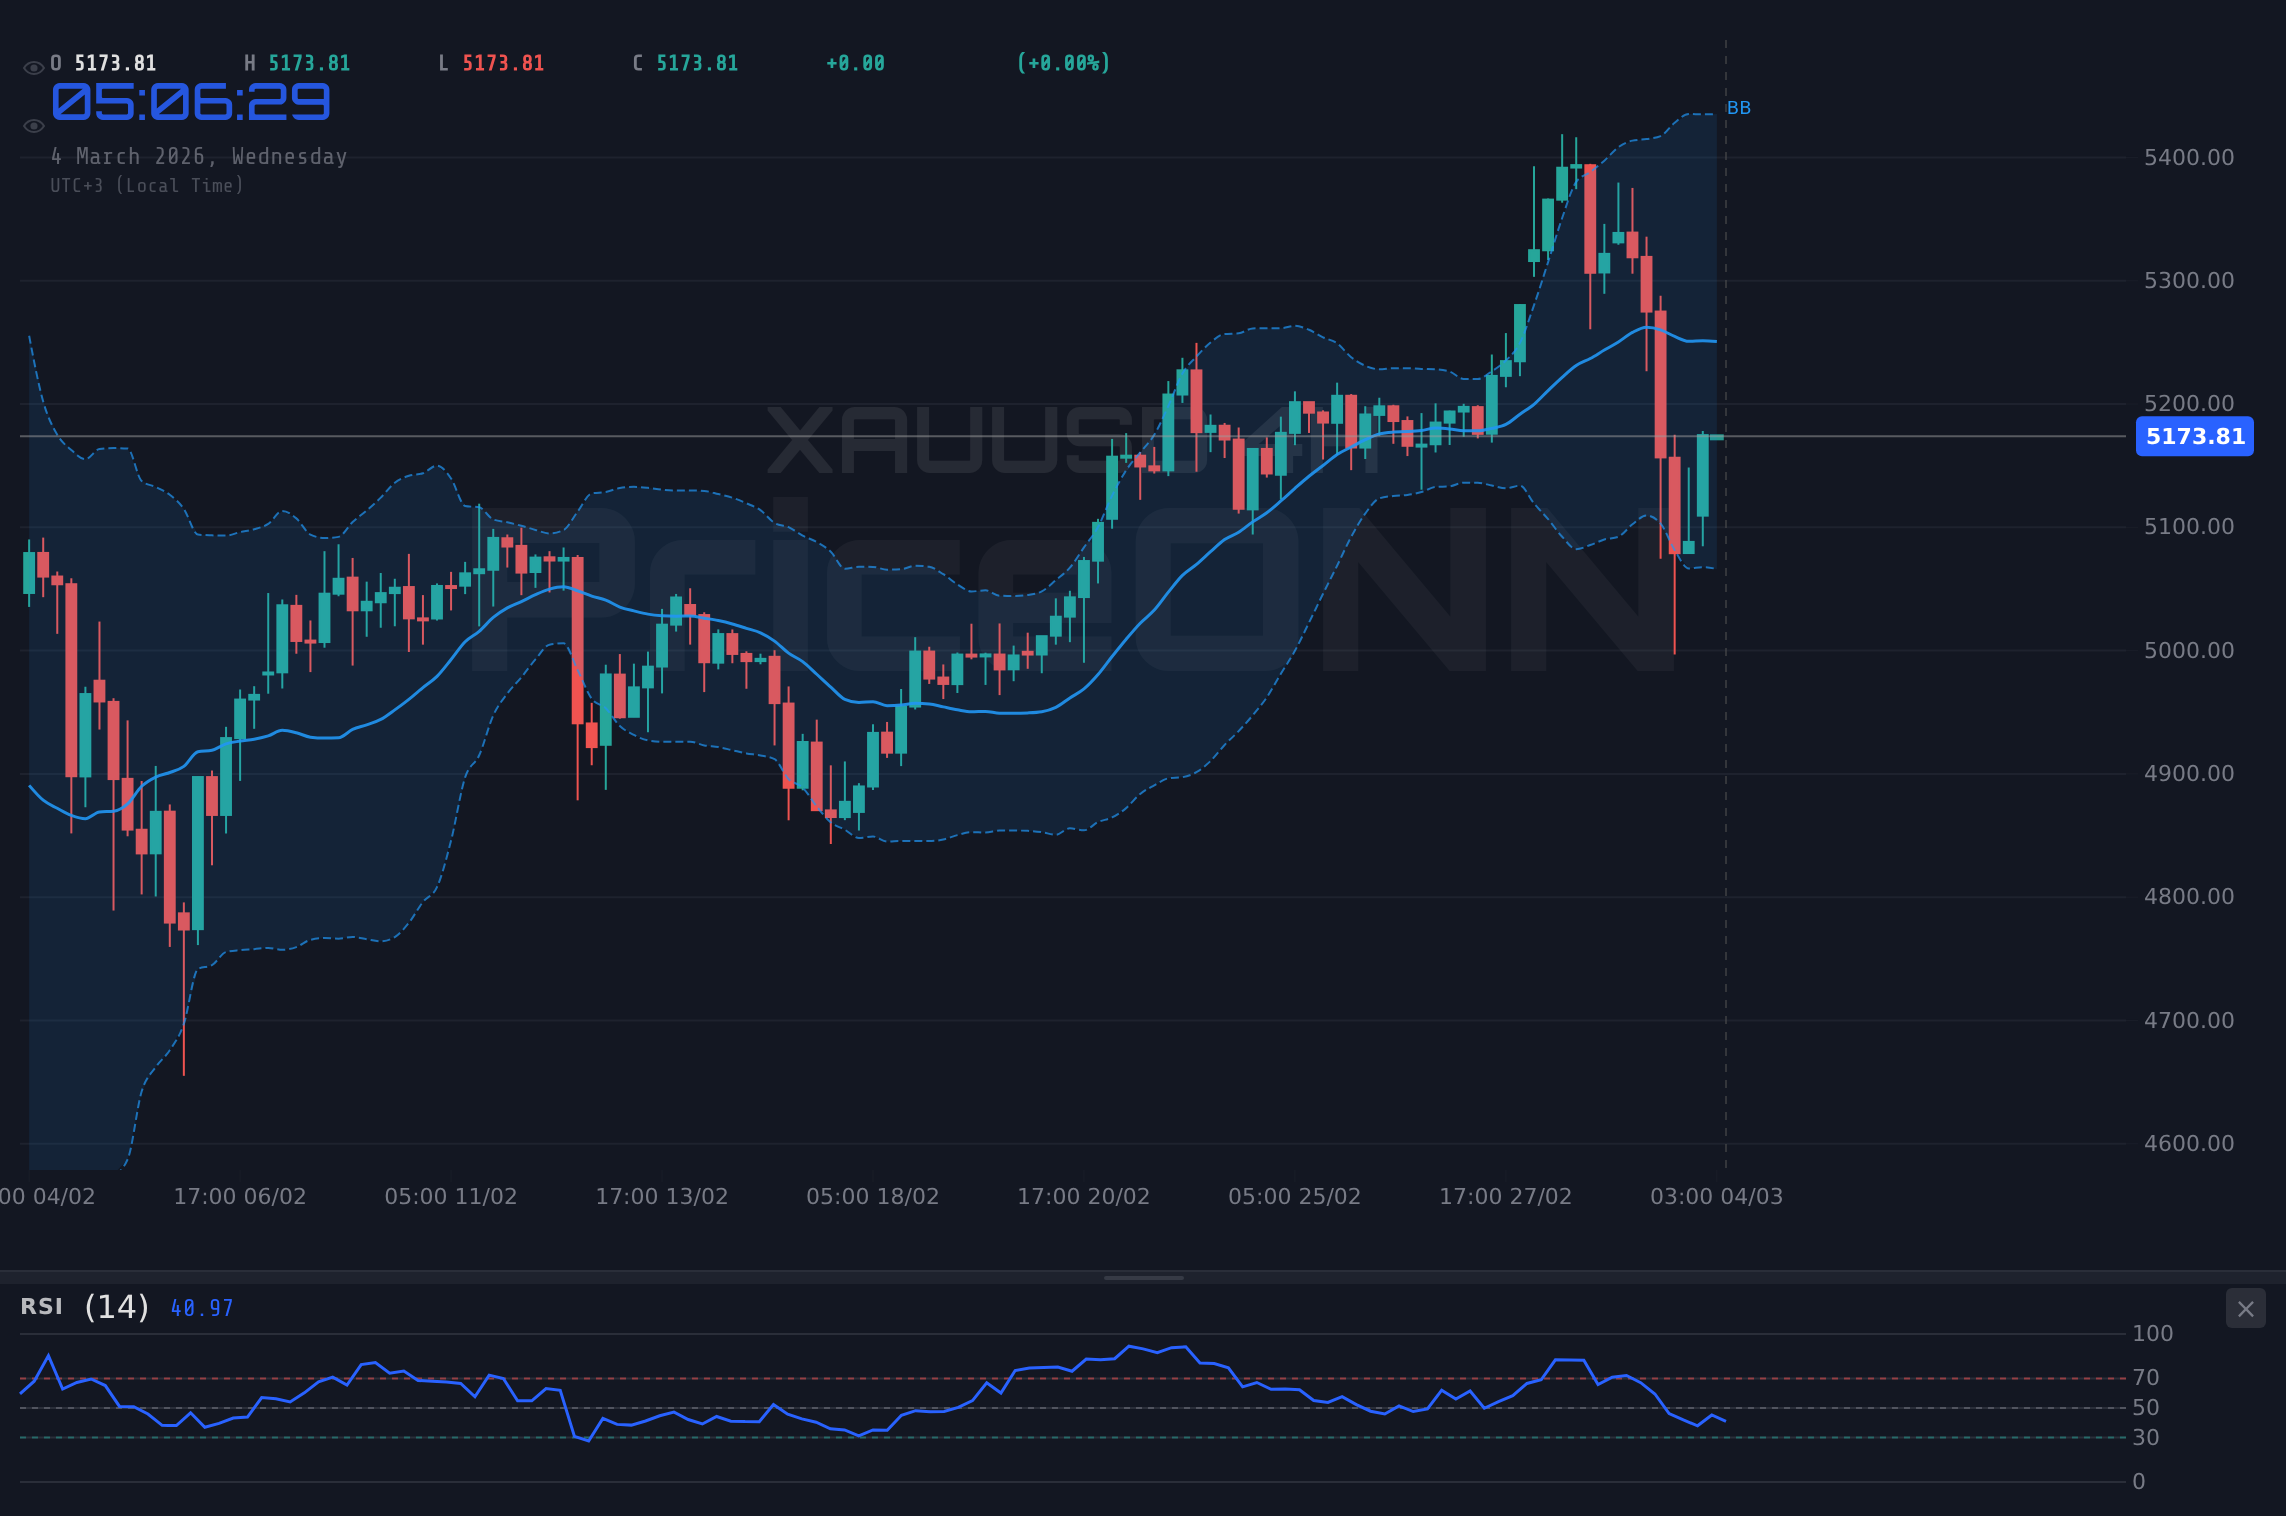
From a technical perspective, the 1-hour chart shows a neutral trend with the price below the middle Bollinger Band, indicating a short-term bearish bias. The RSI at 47.8 suggests that the market is neither overbought nor oversold, leaving room for further downside. The MACD, however, shows positive momentum, which could signal a potential bounce. The ADX at 42.44 indicates a strong trend, reinforcing the bearish outlook on the 1H timeframe.
On the 4-hour chart, the trend remains neutral, with the RSI at 45.49, also suggesting further downside. The MACD histogram is negative, indicating bearish momentum. The ADX at 25.46 confirms a strong trend, reinforcing the bearish view. Key support to watch on the 4H timeframe is at $5,061.96. A break below this level could trigger a sharper sell-off. Conversely, initial resistance lies at $5,131.44.
Looking at the daily chart, the trend is still bullish, albeit with diminishing strength. The RSI at 55.99 is in neutral territory, but the Stochastic oscillator shows a bearish crossover with K=76.4 and D=84.02, signaling potential downside pressure. The ADX at 17.99 indicates a weak trend, suggesting that the longer-term bullish momentum is waning. Key support on the daily chart lies at $5,248.67, which is now acting as resistance. A break above this level would negate the current bearish outlook.
Now this is where it gets interesting! The upcoming U.S. economic data could be a major catalyst for gold. The U.S. ADP Nonfarm Employment Change is due later today, and a strong number could further strengthen the dollar, putting more pressure on gold. Similarly, the U.S. Services Purchasing Managers Index (PMI) and ISM Non-Manufacturing PMI will provide insights into the strength of the U.S. economy. A better-than-expected print could lead to further dollar appreciation and gold weakness. As Bloomberg data shows, a strong US economy often correlates with a stronger dollar, which in turn pressures gold prices.
According to the economic calendar, the U.S. ISM Non-Manufacturing Prices data is also due today. The previous reading was 66.6, and traders will be watching closely to see if inflationary pressures are easing. Lower inflation data could weaken the dollar and provide some support for gold. Also, the market expects U.S. Crude Oil Inventories to be released today. I've been watching oil closely, and any surprise increase in inventories could signal weaker demand, potentially impacting inflation expectations and, in turn, gold prices.
Technically, gold is currently trading below its 20-day moving average, which is a bearish sign. However, the 50-day moving average is still acting as support, suggesting that the longer-term uptrend is still intact. Watch for a break below the 50-day moving average, which would confirm a more significant trend reversal. Also, keep an eye on the VIX (volatility index), which is currently elevated. If the VIX continues to rise, it could signal increased risk aversion and safe-haven demand for gold.
Let's talk about key levels. The immediate resistance is around $5,150.27, which is the high from yesterday's session. A break above this level would be bullish and could lead to a retest of the $5,162.37 level. On the downside, immediate support lies at $5,115.98. A break below this level could trigger a sell-off towards $5,093.79. Having tracked XAUUSD historically, I know that these levels are key pivot points for traders.
The geopolitical landscape is also a crucial factor. Escalating tensions in the Middle East, as highlighted by recent news, could quickly shift market sentiment and boost demand for safe-haven assets like gold. However, keep in mind that geopolitical events are often unpredictable, and it's essential to manage risk accordingly. As the Financial Times reported last week, the market often overreacts to geopolitical events in the short term.
So, what's the trade stance? Given the current technical picture and the upcoming economic data releases, a cautious approach is warranted. The bearish momentum on the short-term charts suggests that further downside is possible. However, the longer-term uptrend is still intact, and geopolitical risks could quickly shift sentiment. Patience looks like it will be rewarded here. Manage your risk, wait for your setup - the market always gives a second chance.
For scalpers, look for shorting opportunities on rallies towards $5,150.27, with a stop loss above $5,162.37. For swing traders, wait for a break below $5,115.98 to confirm a more significant trend reversal. Long-term investors should remain patient and accumulate gold on dips, as the long-term fundamentals remain supportive. Having tracked XAUUSD for years, I know that patience is key in this market.
If XAUUSD breaks above the immediate resistance at $5,150.27, it could target $5,162.37 and potentially $5,184.56. A sustained move above $5,184.56 would confirm a bullish reversal.
If XAUUSD breaks below the immediate support at $5,115.98, it could target $5,093.79 and potentially $5,081.69. A sustained move below $5,081.69 would confirm a bearish continuation.
| Indicator | Value | Signal | Interpretation |
|---|---|---|---|
| RSI (14) | 47.8 | Neutral | Market is neither overbought nor oversold. |
| MACD Histogram | Positive | Bullish | Positive momentum suggests potential for upside. |
| Stochastic | K=87.16, D=55.72 | Bullish | %K > %D indicates a potential for upside. |
| ADX | 42.44 | Strong | Strong trend supports the direction of the move. |
| Bollinger | Middle Band | Watch | Price below middle band suggests downside pressure. |
Frequently Asked Questions: XAUUSD Analysis
Is XAUUSD a good buy right now?
Given the current price of $5,173.99 and the bearish momentum on the short-term charts, a cautious approach is warranted. Long-term investors might find opportunities on dips towards key support levels, but scalpers and swing traders should wait for a clear breakout or breakdown before initiating positions.
What is the XAUUSD price forecast for this week?
The XAUUSD price forecast for this week is mixed. A break above $5,150.27 could lead to a retest of $5,162.37, while a break below $5,115.98 could trigger a sell-off towards $5,093.79. Probability assessment is neutral, pending upcoming economic data releases.
What are the key support and resistance levels for XAUUSD?
Key support levels for XAUUSD are $5,115.98, $5,093.79, and $5,081.69. Key resistance levels are $5,150.27, $5,162.37, and $5,184.56. These levels represent potential areas of buying and selling pressure.
Why is XAUUSD moving today?
XAUUSD is moving lower today due to a strengthening dollar, as indicated by the DXY index at 98.89, and mixed PMI data. Geopolitical tensions and upcoming U.S. economic data releases are also contributing to the volatility.
Track markets in real-time
AI-powered analysis, technical indicators and real-time price data.
Join Our Telegram Channel
Breaking market news, AI analysis and trading signals instantly.
Join Channel