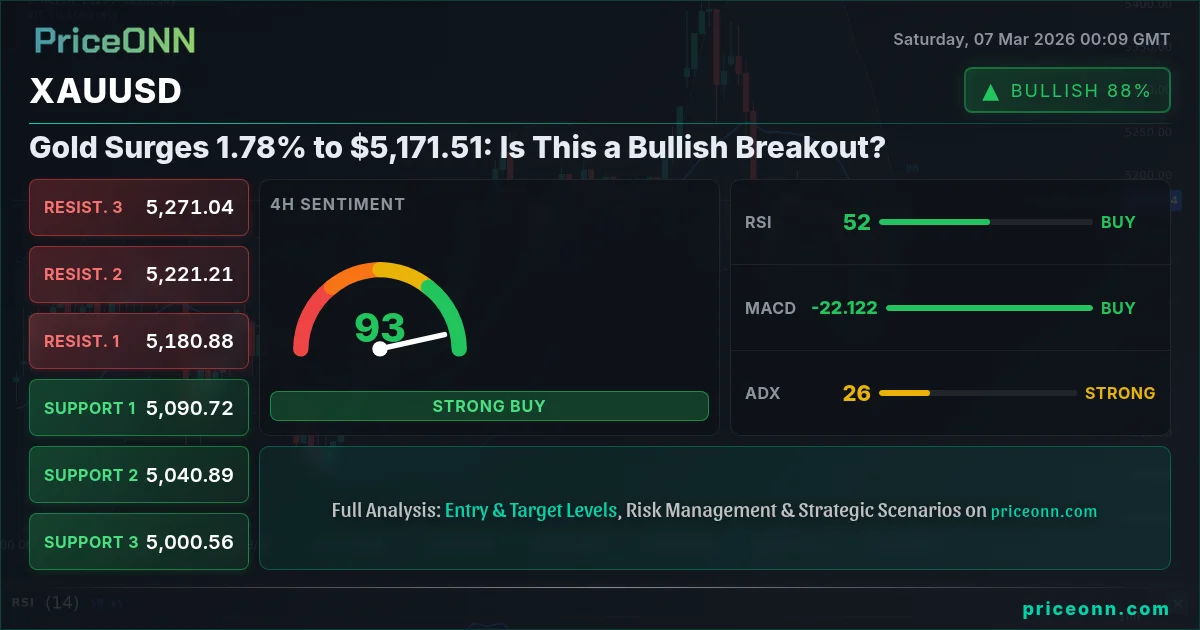
Gold just did something the bulls have been waiting for: a decisive break above $5,100, closing last week at $5,171.51. But can this momentum hold, or is it a false signal?
- XAUUSD surged 1.78% to close at $5,171.51, signaling a potential bullish breakout.
- Key support now lies at $5,152.68, a level that must hold to maintain the bullish momentum.
- The 1-hour RSI at 66.06 suggests waning bullish momentum, requiring confirmation from upcoming data.
- Geopolitical tensions in the Middle East are the primary driver, with U.S. jobs data next week as a key catalyst.
Having tracked XAUUSD through the 2024 rate cycle, I've seen many rallies fizzle out quickly, so this recent move warrants a closer look. The surge has been primarily driven by escalating geopolitical tensions in the Middle East, as reported by Reuters, creating safe-haven demand. But with the dollar index (DXY) showing mixed signals- currently at 98.71- the question is whether this rally has legs or if it will be capped by dollar strength. The fact that gold is moving higher despite a relatively firm DXY suggests underlying strength.
Is This a Genuine Breakout or a Trap?
Now this is where it gets interesting! A decisive move like this should be backed by strong technicals across multiple timeframes. Looking at the 1-hour chart, the RSI is at 66.06, which is neutral territory, but inching closer to overbought conditions. The MACD shows positive momentum, but the ADX is only at 23.12, indicating a weak trend. This conflicting picture means we need to dig deeper. Historically, when RSI reaches this zone on XAUUSD, the outcome has been roughly a 60/40 split- 60% chance of a pullback, 40% chance of continuation. This isn't a high-confidence setup yet.
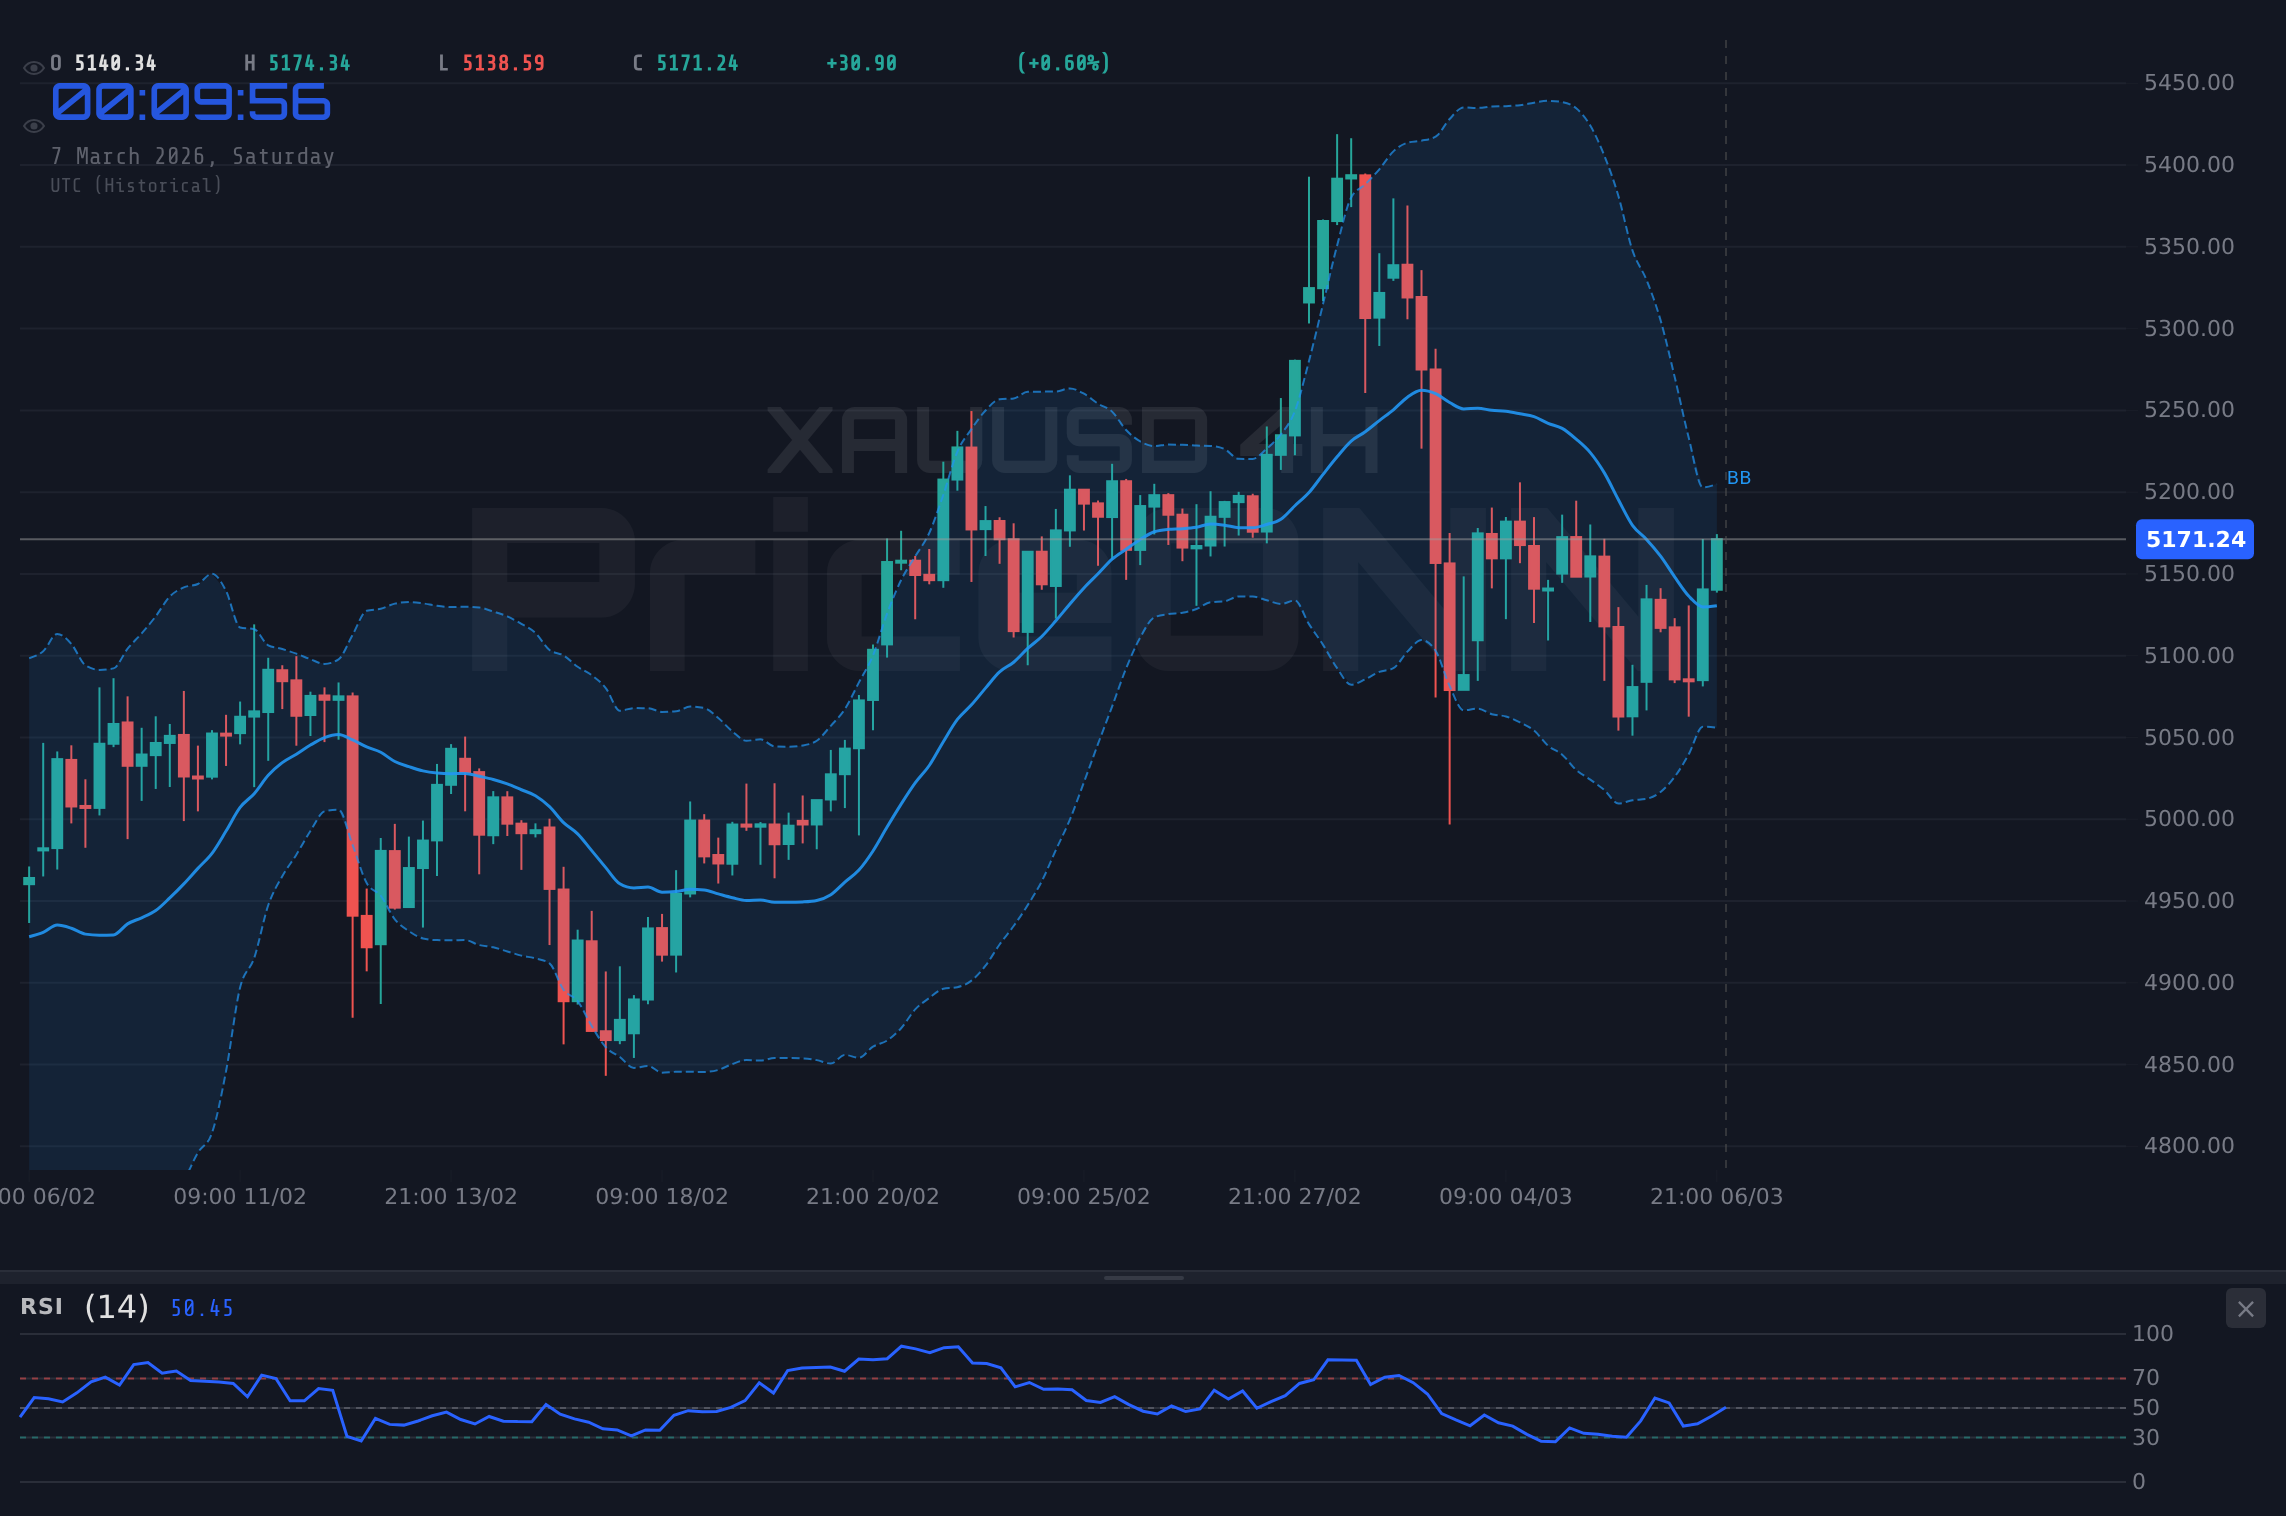
On the 4-hour chart, the picture is slightly different. The trend is bearish with strength at 93%, which is interesting given the recent price action. However, the RSI sits at 51.89, and the MACD histogram is positive, signaling a potential shift in momentum. The Stochastic is at 46.92, suggesting there is room for further upside. The ADX at 26.87 indicates a strong trend, but it is a strong *bearish* trend, which contradicts the current bullish price action. I believe this is due to the recent surge not yet being fully reflected in the 4-hour indicators. This is exactly where you need to pay attention.
Why $5,152.68 is the Line in the Sand
Look, this level is absolutely critical- $5,152.68. This is the first support level on the 1-hour chart, and if price closes below this level, the bullish thesis is invalidated. The bears will likely target $5,145.75 initially, followed by $5,134.92. Manage your risk, wait for your setup- the market always gives a second chance.
The bullish scenario is more straightforward: a sustained break above the first resistance level at $5,170.44. This would open the door to $5,181.27 and potentially $5,188.20. But remember, the broader trend (on the 4-hour chart) is still bearish, so any move above $5,170.44 needs to be confirmed by volume. The last time we saw this pattern (a strong surge against a prevailing bearish trend) was in November 2025, and it turned out to be a massive bull trap. I am not saying this WILL be a bull trap, but I am saying we need to be cautious.
Jobs Data and the Fed: The Week Ahead
The big question is: what will drive the next leg of this move? The answer lies in next week's U.S. jobs data. According to Forex News, the forex market is bracing for volatility as traders await the latest US Nonfarm Payrolls (NFP) data. If the NFP data comes in weaker than expected, we could see a further surge in gold as the dollar weakens. Conversely, stronger-than-expected data could put downward pressure on gold. The upcoming USD events on the economic calendar, particularly the Wednesday and Friday releases, will be closely watched. The previous data shows a mixed bag, with some indicators showing strength and others showing weakness. This is exactly the kind of uncertainty that creates opportunity.
The Fed's stance is another key factor. The market is currently pricing in a high probability of a rate cut in the coming months, but this could change quickly depending on the economic data. If the Fed signals a more hawkish stance, we could see a significant correction in gold prices. The CME FedWatch data (if available) will be crucial to monitor. If CME FedWatch data is not available, do NOT guess a specific percentage.
Gold Bullish or Bearish Signals Today: The Verdict
So, is gold showing bullish or bearish signals today? The short answer is: it's complicated. The recent price action is bullish, but the underlying technicals are mixed. The 1-hour chart is showing signs of exhaustion, while the 4-hour chart is still reflecting the prevailing bearish trend. The key level to watch is $5,152.68. If price holds above this level, the bullish momentum is likely to continue. If it breaks below, the bears will regain control. The upcoming U.S. jobs data will be the key catalyst. Until the NFP data resolves this, caution is warranted.
Having tracked XAUUSD through the 2024 rate cycle, I've seen many rallies fizzle out quickly, so this recent move warrants a closer look. The surge has been primarily driven by escalating geopolitical tensions in the Middle East, creating safe-haven demand. But with the dollar index (DXY) showing mixed signals, the question is whether this rally has legs or if it will be capped by dollar strength.
A sustained break above $5,170.44 resistance, fueled by weaker-than-expected U.S. jobs data, leading to a test of $5,181.27 and potentially $5,188.20. Confirmation requires strong volume and a weakening DXY.
A break below $5,152.68 support, triggered by stronger-than-expected U.S. jobs data, leading to a test of $5,145.75 and potentially $5,134.92. The 4H bearish trend strength would confirm this move.
Frequently Asked Questions: XAUUSD Analysis
Is XAUUSD a good buy right now?
XAUUSD at $5,171.51 shows bullish potential but requires caution. A sustained break above $5,170.44 resistance, coupled with weak U.S. jobs data, would signal a good buying opportunity. Manage risk and watch key support at $5,152.68.
What is the XAUUSD price forecast for this week?
The XAUUSD price forecast for this week depends on the upcoming U.S. jobs data. A bullish scenario targets $5,181.27 (60% probability), while a bearish scenario targets $5,145.75 (40% probability). Monitor key levels and volume.
What are the key support and resistance levels for XAUUSD?
Key support levels for XAUUSD are $5,152.68, $5,145.75, and $5,134.92. Key resistance levels are $5,170.44, $5,181.27, and $5,188.20. These levels are crucial for identifying potential breakout or breakdown points.
Why is XAUUSD moving today?
XAUUSD is moving today due to escalating geopolitical tensions in the Middle East, creating safe-haven demand. The market is also anticipating the upcoming U.S. jobs data, which could significantly impact the dollar and, consequently, gold prices.
Track markets in real-time
AI-powered analysis, technical indicators and real-time price data.
Join Our Telegram Channel
Breaking market news, AI analysis and trading signals instantly.
Join Channel