The Dow Jones Industrial Average (DowJones30) is currently hovering around $47,483, marking a notable dip. For investors and traders alike, the question is: why is dow jones falling today? The market's reaction to this week's economic data, coupled with looming jobs data next week, is setting the stage for potential volatility. This article delves into the factors influencing the Dow's performance, offering insights into potential trading strategies and key levels to watch.
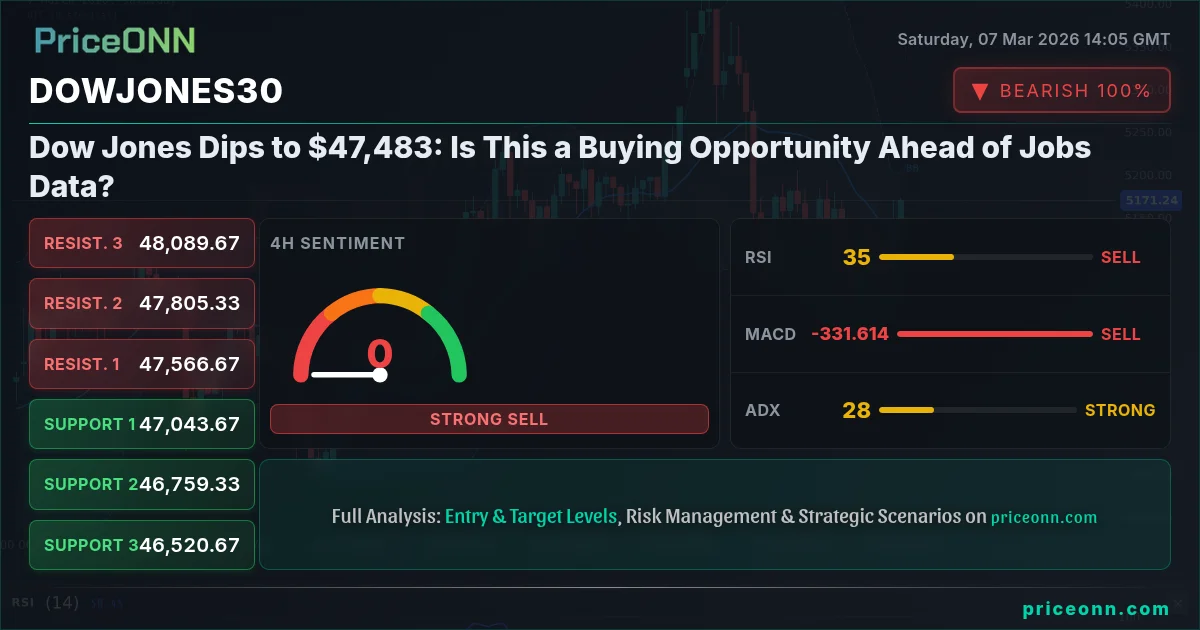
- Dow Jones is currently at $47,483, down -0.83% amid broader market concerns.
- Key support level to watch is at 47,344.33, potentially acting as a bounce point.
- Strong downward pressure is indicated by ADX at 39.19 on the 1H chart.
- Upcoming jobs data is expected to significantly influence DowJones30 correlation with DXY.
What's Driving the Dow's Dip?
Several factors are contributing to the Dow's current pullback. Firstly, the broader market sentiment has turned cautious, with both the SP500 and Nasdaq100 experiencing declines of -1.16% and -1.31% respectively. This risk-off environment is partly fueled by concerns over rising oil prices, with WTI crude surging by 15.21% to $90.81. The surge in oil prices raises concerns about potential inflationary pressures, which could prompt central banks to take a more hawkish stance. According to Reuters, Fed officials have already emphasized that inflation remains 'too persistent,' which reinforces the possibility of continued monetary tightening. This has been reflected in the DXY which currently sits at 98.71.
Geopolitical tensions, particularly in the Middle East, are adding to the market's unease. As reported by Bloomberg, the escalating tensions have led to a surge in demand for safe-haven assets, impacting equity markets. This is compounded by the recent U.S. Weekly Economic & Financial Commentary, which highlighted that the February jobs report was uniformly negative. Nonfarm payrolls slipped by 92K, further fueling concerns about the strength of the U.S. economy.
Technical Indicators: A Bearish Picture?
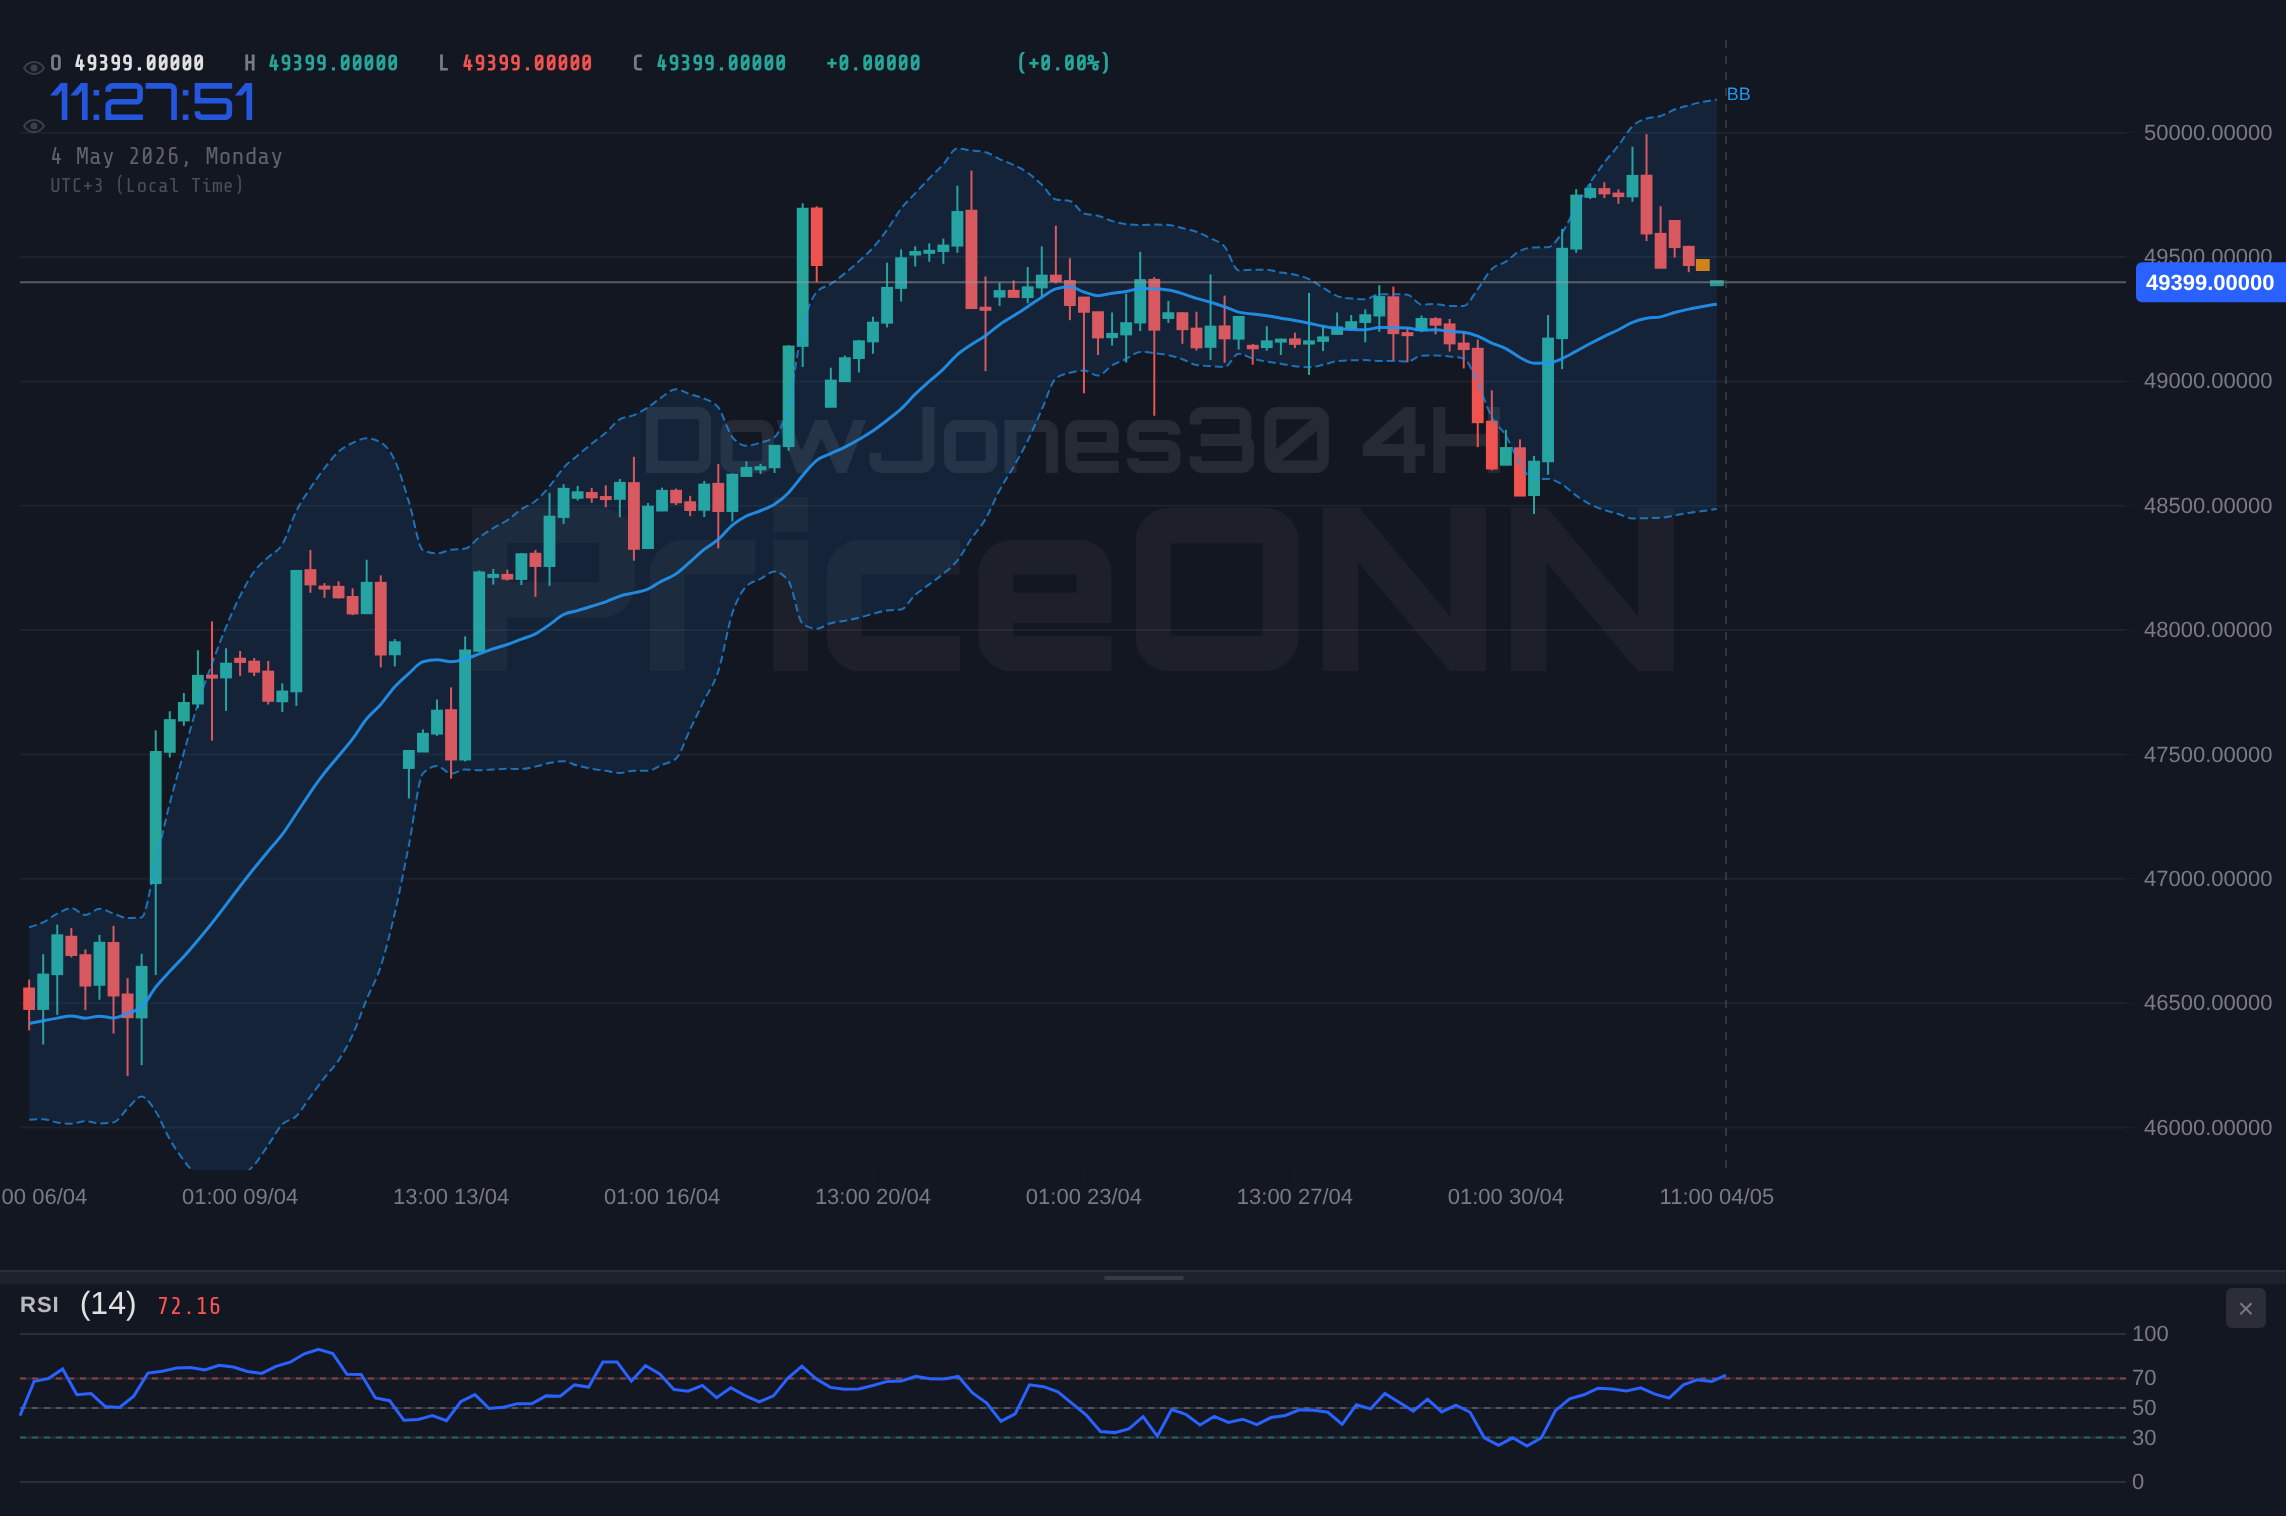
A closer look at the technical indicators for DowJones30 suggests a bearish outlook in the short term. On the 1H chart, the Relative Strength Index (RSI) stands at 40.81, indicating that the index is not yet oversold but is approaching that territory. The Moving Average Convergence Divergence (MACD) histogram is negative, signaling bearish momentum. Furthermore, the Average Directional Index (ADX) is at 39.19, indicating a strong downward trend.
The 4H chart reinforces this bearish sentiment. The RSI is at 34.59, closer to the oversold threshold. The MACD histogram remains negative, and the ADX is at 26.11, confirming the strength of the downtrend. The Stochastic oscillator, with K=15.3 and D=22.33, is deeply oversold, suggesting that a potential bounce could be on the horizon. However, until there is a confirmed reversal, the overall technical picture favors the bears.
On the daily timeframe, the indicators paint a mixed picture. While the RSI is at 32.96, suggesting oversold conditions, the MACD histogram is negative, and the Stochastic oscillator is signaling a potential reversal with K=27.68 and D=37.36. The ADX at 24.36 indicates a moderate downtrend, suggesting that the bearish momentum may be waning. The key is to watch for confirmation signals, such as a break above the 47,511.67 resistance level on the 1H chart.
Key Levels to Watch for DowJones30
Identifying critical support and resistance levels is crucial for traders navigating the current market conditions. Immediate support can be found at 47,281.67, followed by 47,185.33 and 47,051.67 on the 1H chart. These levels could act as potential bounce points if the bearish momentum subsides. On the upside, immediate resistance is at 47,511.67, followed by 47,645.33 and 47,741.67. A break above these resistance levels could signal a shift in sentiment and a potential rally.
On the 4H chart, the key support levels are 47,051.33, 46,821.67, and 46,408.33. These levels represent significant areas of demand that could provide a floor for the index. Resistance levels on the 4H chart are at 47,694.33, 48,107.67, and 48,337.33. A sustained move above these levels would indicate a more substantial recovery.
For longer-term investors, the daily chart provides a broader perspective. Key support levels are at 47,344.33, 46,810.67, and 46,070.33, while resistance levels are at 48,618.33, 49,358.67, and 49,892.33. These levels represent significant areas of supply and demand that could influence the index's trajectory over the coming weeks.
The Impact of Upcoming Jobs Data
The market's focus is now shifting to the upcoming jobs data, which is expected to provide further insights into the health of the U.S. economy. The jobs data that was released on Wednesday, March 4th, was negative which could point to a future trend. Investors will be closely watching the Nonfarm Payrolls (NFP) report, which is scheduled to be released next week. A strong NFP number could reinforce the Fed's hawkish stance and lead to further downside pressure on the Dow. Conversely, a weak NFP number could prompt the Fed to reconsider its tightening plans and provide a boost to the index. As such, it will be a key indicator of the DXY.
The unemployment rate will also be closely scrutinized. An increase in the unemployment rate could signal a weakening labor market and prompt the Fed to take a more dovish stance. Average hourly earnings will also be in focus, as higher earnings could fuel inflationary pressures and reinforce the Fed's hawkish bias. The market's reaction to these data points will likely determine the Dow's trajectory in the coming days.
DowJones30 Trade Plan: Short-Term Bearish Opportunity
Given the current technical and fundamental backdrop, a short-term bearish trade plan could be considered for DowJones30. The strong downward trend on the 1H and 4H charts, coupled with the looming jobs data, suggests that further downside is possible.
Continued bearish momentum is expected if the DowJones30 fails to hold above 47,281.67. Targets include 47,185.33 and 47,051.67, with a potential extension to 46,821.67 if selling pressure intensifies.
A bullish reversal could occur if the DowJones30 breaks above 47,511.67. Targets include 47,645.33 and 47,741.67, with a potential extension to 48,107.67 if buying pressure persists.
Entry Trigger: A break below 47,281.67 could serve as an entry point for a short position. Target 1: 47,185.33. Target 2: 47,051.67. Stop/Invalidation Level: A move above 47,511.67 would invalidate the bearish thesis.
The upcoming jobs data could significantly impact the DowJones30. Traders should exercise caution and manage their risk accordingly.
Navigating the Volatility: What's Next for DowJones30?
The Dow Jones Industrial Average is currently facing a period of uncertainty, driven by a combination of factors. The upcoming jobs data will be critical in determining the index's trajectory. Until then, traders should remain vigilant and manage their risk effectively. Monitoring key support and resistance levels and keeping a close eye on technical indicators will be crucial for navigating the volatility.
Frequently Asked Questions: DowJones30 Analysis
Is DowJones30 a good buy right now?
Given the current bearish momentum and upcoming jobs data, DowJones30 may not be a good buy right now. A break above 47,511.67 is needed to signal a potential bullish reversal.
What is the DowJones30 price forecast for this week?
The DowJones30 price forecast for this week is highly dependent on the upcoming jobs data. A strong NFP number could lead to further downside, while a weak number could provide a boost to the index.
What are the key support and resistance levels for DowJones30?
Key support levels are at 47,281.67, 47,185.33, and 47,051.67, while resistance levels are at 47,511.67, 47,645.33, and 47,741.67.
Why is DowJones30 moving today?
DowJones30 is moving today due to a combination of factors, including broader market sentiment, rising oil prices, and geopolitical tensions. The upcoming jobs data is also weighing on investors' minds.
Track markets in real-time
AI-powered analysis, technical indicators and real-time price data.
Join Our Telegram Channel
Breaking market news, AI analysis and trading signals instantly.
Join Channel