ETHUSD Eyes Key Support at $2,019.67 Amid Crude Oil Surge
ETHUSD dips to $2,019.67 as crude oil rallies and Fed speakers loom. Will key support hold amid geopolitical tensions?
ETHUSD is under pressure, currently trading near $2,019.67, as a surge in crude oil prices and hawkish undertones from Federal Reserve speakers weigh on risk assets. The rise in Brent crude, now near $65.73, is stoking fears of persistent inflation, potentially forcing the Fed to maintain its restrictive monetary policy stance. This macro backdrop is creating headwinds for cryptocurrencies, particularly ETHUSD, which is exhibiting a strong inverse correlation with the Dollar Index (DXY).
- ETHUSD is testing immediate support near $2,018.96 on the hourly timeframe.
- Crude oil's surge to $65.73 is fueling inflation concerns, pressuring risk assets like ETHUSD.
- The DXY at 99.06 is exhibiting strength, further weighing on ETHUSD.
- A break below $2,018.96 could open the door for a test of the daily support at $2,033.04.
The current market sentiment is one of risk aversion, as evidenced by the SP500's 1.15% decline and the Nasdaq100's 1.43% drop. This "risk-off" environment is benefiting safe-haven assets like the US Dollar, as indicated by the DXY's rise to 99.06. The strength in the dollar is exerting downward pressure on ETHUSD, which is often seen as a riskier asset class. Moreover, the recent surge in WTI crude oil, up a staggering 11.34% to $87.76, is adding to inflationary pressures, potentially limiting the Fed's ability to ease monetary policy anytime soon.
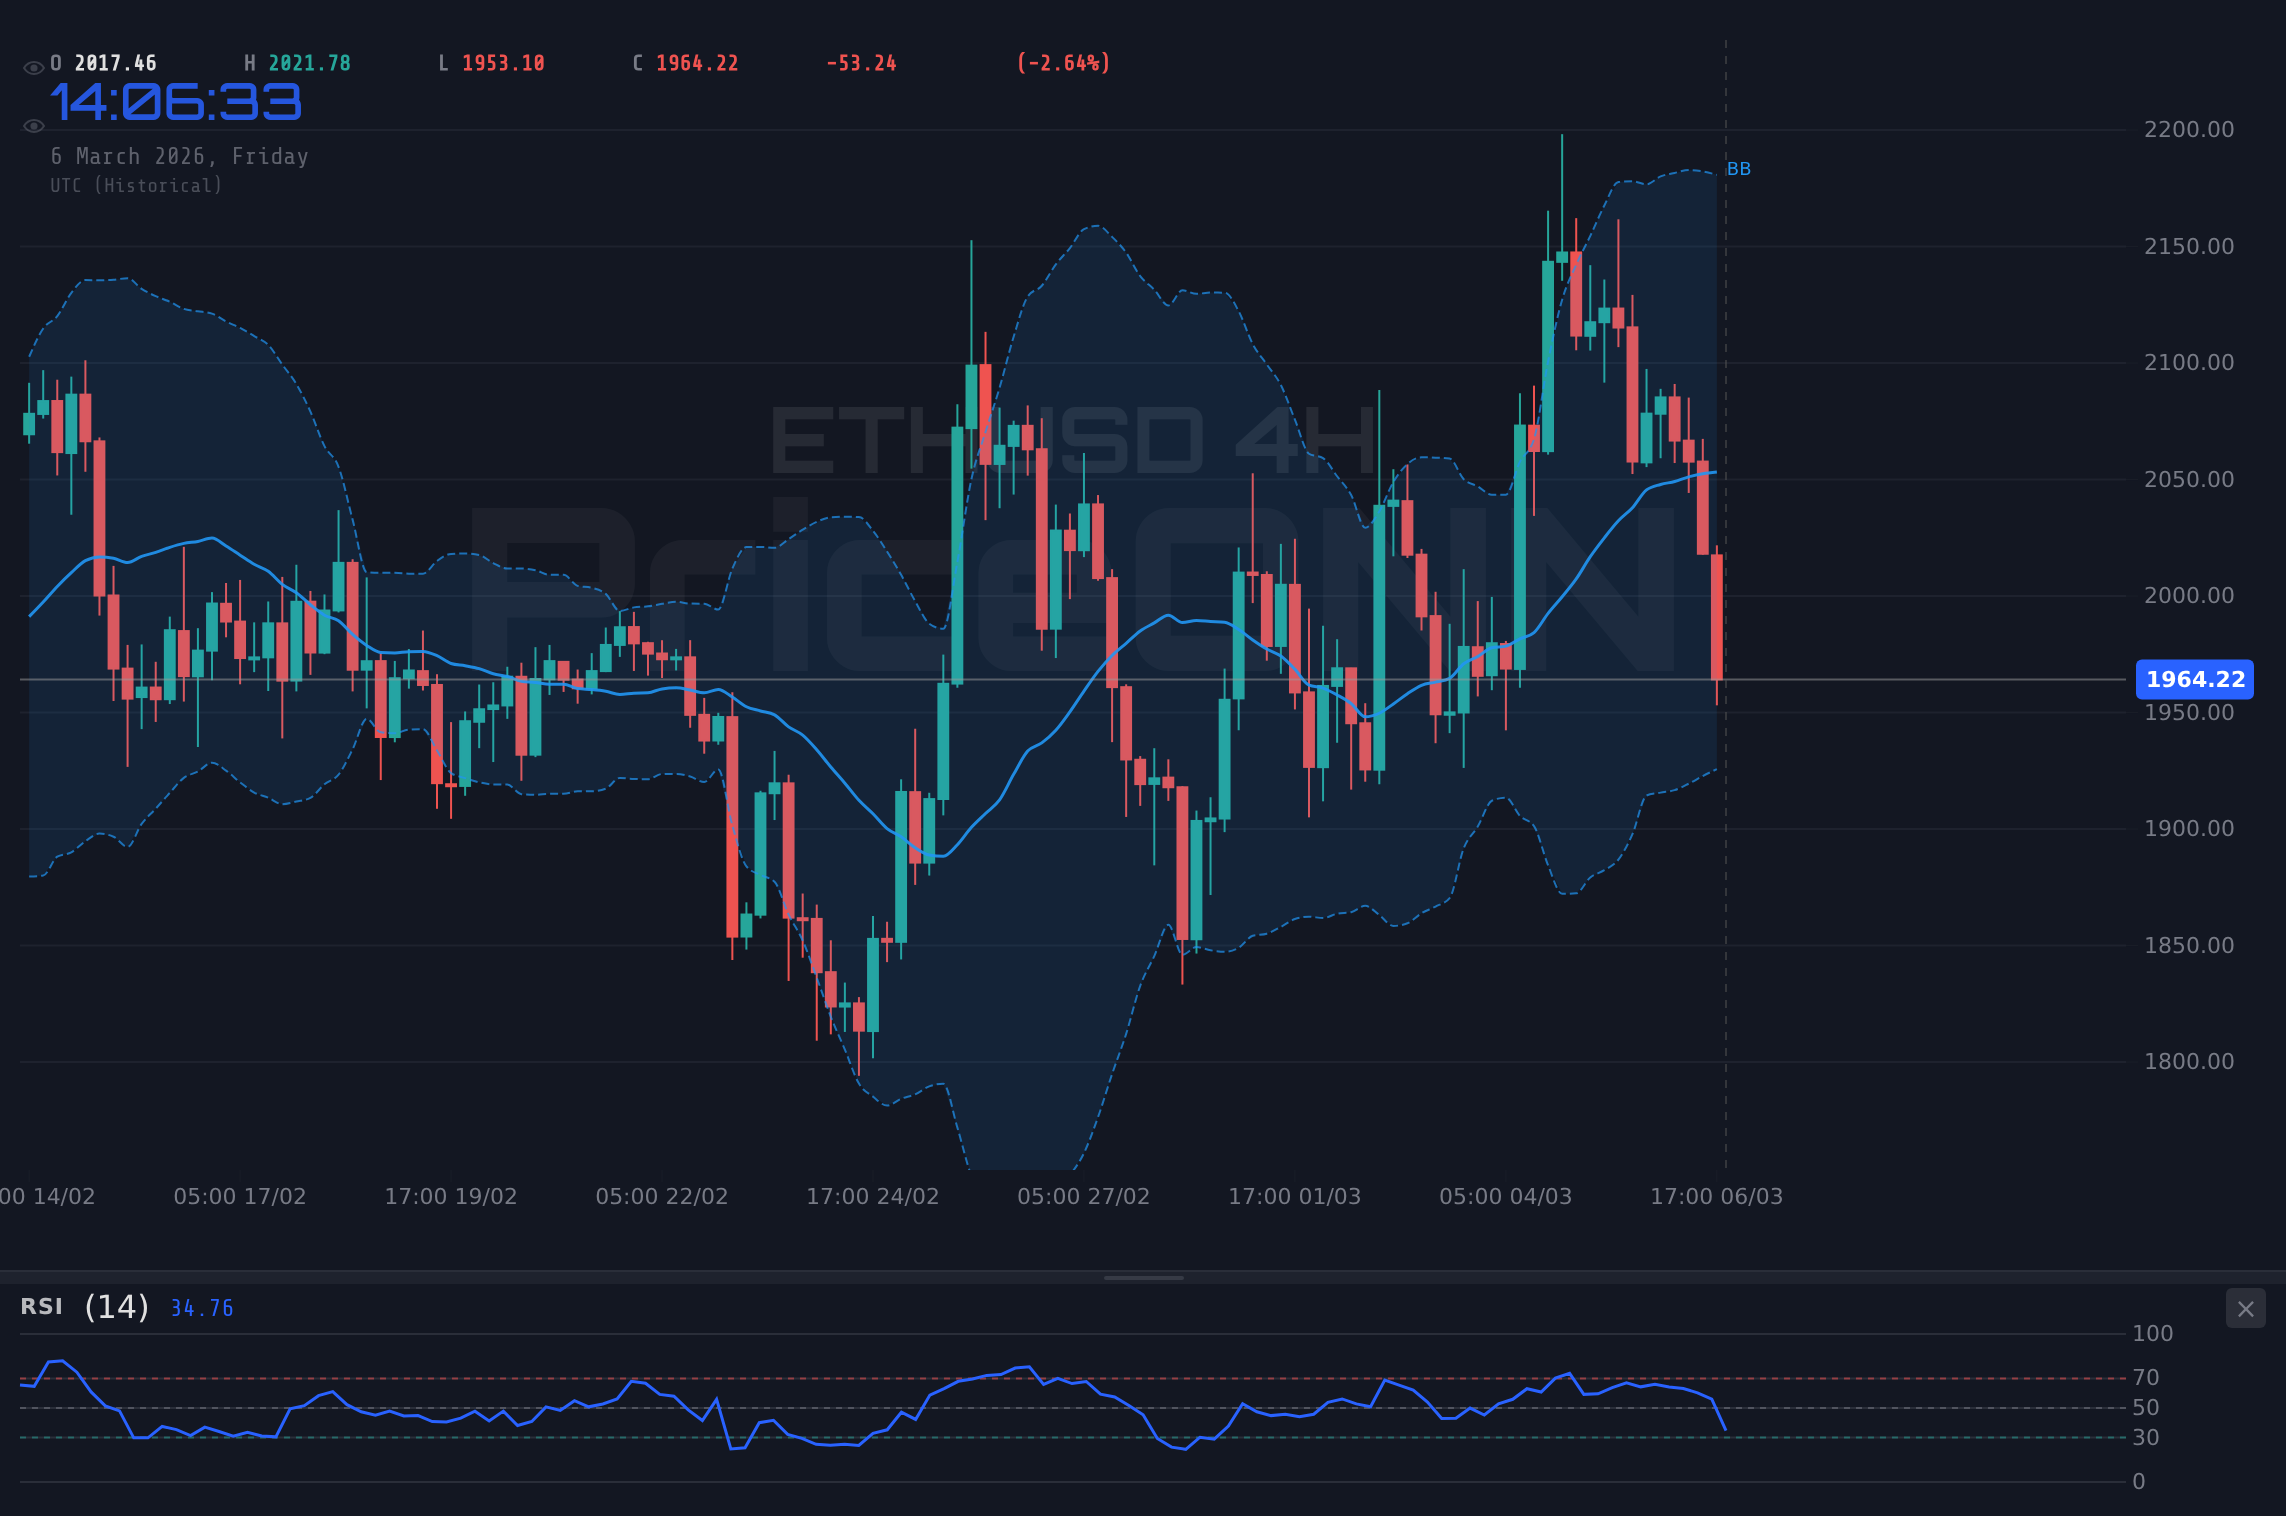
From a technical perspective, ETHUSD's hourly chart reveals a clear downtrend, with the price consistently making lower highs and lower lows. The RSI (14) at 30.46 suggests that the asset is approaching oversold conditions, but a sustained bounce is not yet confirmed. The MACD histogram is also showing negative momentum, further reinforcing the bearish outlook. Key support levels to watch on the hourly timeframe include $2,018.96, followed by $2,027.17. A break below these levels could trigger further downside towards the daily support at $2,033.04.
However, it's important to note that the daily chart presents a slightly different picture. While the overall trend is neutral, the RSI (14) at 46.85 suggests that there is still room for further downside before ETHUSD reaches oversold territory. The Stochastic oscillator, with %K at 68.55 and %D at 57.42, is signaling a potential bullish crossover, which could provide some relief to the downside pressure. Key resistance levels to watch on the daily timeframe include $2,142.87, followed by $2,207.45.
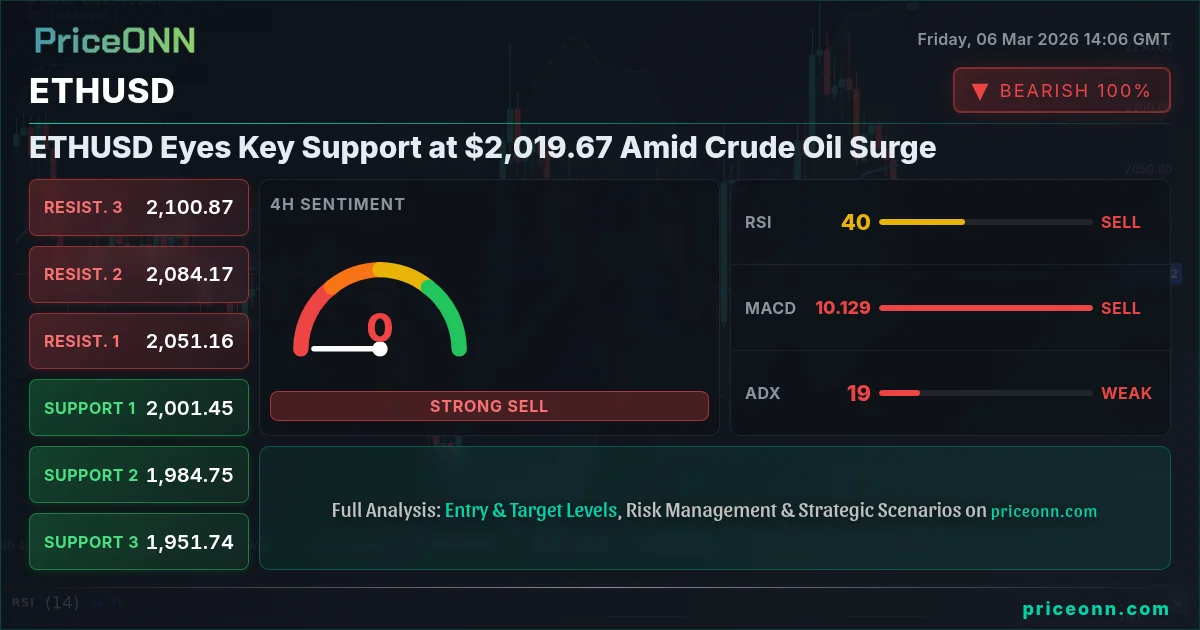
The 4-hour chart provides a mixed signal. The RSI (14) is at 46.47, indicating neutral momentum, but the MACD histogram is showing negative momentum. The Stochastic oscillator (%K at 7.53 and %D at 29.45) is signaling a potential bullish crossover, which may lead to a short-term bounce. The ADX stands at a rather weak 18.82 signaling a ranging market. Key support levels on the 4-hour chart include $2,039.58 and $2,021.46. Resistance sits at $2,080.50 and $2,103.30.
The strength of the US Dollar, as reflected in the DXY's rise to 99.06, is a significant headwind for ETHUSD. The DXY's upward momentum is being fueled by expectations of continued hawkishness from the Federal Reserve, as well as safe-haven demand amid geopolitical tensions in the Middle East. As Reuters reported, "Fed officials continue to emphasize the need for further evidence of sustained disinflation before considering a policy pivot." This hawkish stance is keeping upward pressure on US Treasury yields, further enhancing the dollar's attractiveness to investors.
The surge in crude oil prices is another factor weighing on ETHUSD. As WTI crude oil breaks above $87.76 a barrel, concerns are growing that rising energy costs will translate into higher inflation, potentially forcing the Fed to maintain its restrictive monetary policy stance. This scenario is particularly concerning for risk assets like cryptocurrencies, which tend to underperform in environments of high inflation and rising interest rates. The latest news from the Middle East, as highlighted by Bloomberg, indicates that "supply disruptions could push oil prices even higher, exacerbating inflationary pressures."
The economic calendar is relatively light today, with no major high-impact data releases scheduled. However, traders will be closely monitoring comments from Federal Reserve officials for any clues about the central bank's future policy intentions. The market is particularly sensitive to any signals that the Fed may be considering a more aggressive tightening path, which could further weigh on risk assets like ETHUSD. On Tuesday, March 3rd, the market will be watching GBP releases and EUR releases. On Wednesday, March 4th, several USD releases will be closely watched. Thursday, March 5th, brings another important USD release. On Friday, March 6th, further USD data is due.
Given the current market conditions, traders should exercise caution when trading ETHUSD. The combination of a strong dollar, rising crude oil prices, and hawkish Fed rhetoric is creating a challenging environment for cryptocurrencies. While the technical indicators suggest that ETHUSD may be approaching oversold conditions, a sustained bounce is not yet confirmed. Traders should closely monitor key support levels and resistance levels, and be prepared to adjust their positions accordingly.
The overall trend for ETHUSD remains bearish in the short-term and neutral in the longer-term. A break below $2,018.96 could trigger further downside towards $2,033.04 and potentially even lower. Conversely, a sustained move above $2,142.87 could signal a shift in momentum and open the door for a test of higher resistance levels. However, until there is a clear catalyst for a change in market sentiment, traders should remain cautious and focus on managing their risk.
Having tracked ETHUSD through the 2024 rate cycle, I've observed that periods of strong dollar dominance often coincide with significant corrections in the cryptocurrency market. This pattern last appeared in Q3 2024, when a series of hawkish Fed statements triggered a sharp sell-off in ETHUSD. While the current situation is not identical, there are certainly echoes of that period, suggesting that caution is warranted.
The combination of DXY strength and crude oil price surge creates a challenging environment for ETHUSD. Until the market prices in any new data, caution is warranted. However, with disciplined risk management, these choppy waters can be navigated safely.
Frequently Asked Questions: ETHUSD Analysis
Is ETHUSD a good buy right now?
ETHUSD is currently trading near $2,019.67 and approaching oversold conditions, but a sustained bounce is not yet confirmed. Given the strong dollar and rising crude oil prices, it is too risky to buy at the moment. Wait for a confirmed bullish reversal signal before initiating a long position.
What is the ETHUSD price forecast for this week?
The ETHUSD price forecast for this week is bearish, with a potential test of the daily support at $2,033.04. A break below this level could open the door for further downside towards $2,021.46. The probability of a sustained rally is low given the current macro environment.
What are the key support and resistance levels for ETHUSD?
Key support levels for ETHUSD are $2,018.96 on the hourly chart and $2,033.04 on the daily chart. Key resistance levels are $2,142.87 on the daily chart and $2,080.50 on the 4-hour chart. These levels should be closely monitored for potential trading opportunities.
Why is ETHUSD moving today?
ETHUSD is moving lower today due to a combination of factors, including a strong dollar, rising crude oil prices, and hawkish comments from Federal Reserve officials. These factors are creating a risk-off environment that is weighing on cryptocurrencies.
Technical Outlook Summary
| Indicator | Value | Signal |
|---|---|---|
| RSI (14) | 30.46 | Neutral |
| MACD Histogram | Negative | Bearish |
| Stochastic | K=68.55, D=57.42 | Bullish |
| ADX | 18.82 | Weak |
| Bollinger | Lower Band | Watch |
Key Levels
Support Levels
Resistance Levels
Track markets in real-time
AI-powered analysis, technical indicators and real-time price data.
Join Our Telegram Channel
Breaking market news, AI analysis and trading signals instantly.
Join Channel