ETHUSD Wobbles Near $2,049.59: Crude Oil Surge Adds to Trading Jitters
ETHUSD hovers near $2,049.59 as rising crude oil prices and Middle East tensions inject uncertainty into the market. Is this a buying opportunity or a signal for further downside?
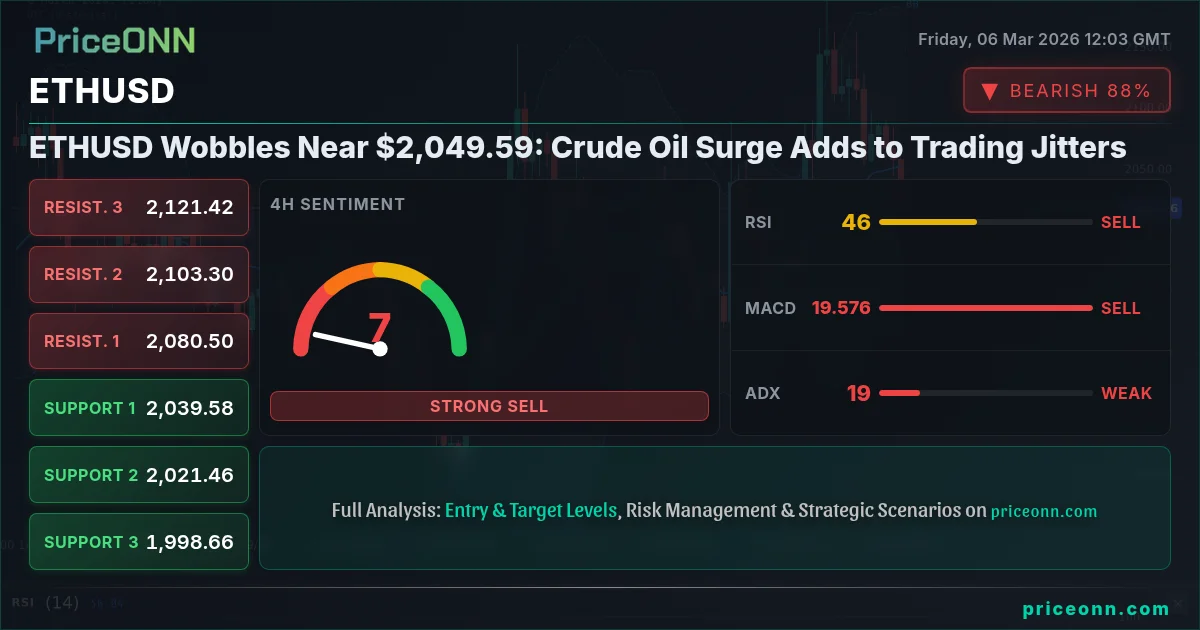
Ethereum (ETHUSD) is currently trading around $2,049.59, facing downward pressure amid a confluence of factors, including rising crude oil prices and escalating geopolitical tensions in the Middle East. The surge in oil prices, with Brent crude at $65.73, has stoked fears of renewed inflationary pressures, potentially forcing central banks to maintain hawkish monetary policies. This backdrop creates a challenging environment for risk assets like ETHUSD, as investors weigh the potential for further interest rate hikes against the backdrop of slowing economic growth. The key question now is whether ETHUSD can hold its current levels or if the broader market uncertainty will lead to a deeper correction.
- RSI at 38.28 on the 1H chart signals further downside potential for ETHUSD.
- Key support lies at $2,033.04, a break below which could trigger a significant sell-off.
- MACD histogram indicates negative momentum, suggesting bearish pressure is likely to persist.
- Rising crude oil prices and Middle East tensions are driving ETHUSD correlation with DXY.
The technical picture for ETHUSD across multiple timeframes paints a mixed but predominantly bearish outlook. On the 1-hour chart, the trend is downward with 77% strength, as ETHUSD struggles to maintain its footing. The Relative Strength Index (RSI) at 38.28 suggests that the asset is not yet oversold, leaving room for further declines. The Moving Average Convergence Divergence (MACD) indicator reinforces this bearish view, showing negative momentum and residing below the signal line, signaling that selling pressure remains intact. The Stochastic indicator, with K=25.77 and D=40.65, further confirms the downward momentum, indicating that the bears are currently in control. The Average Directional Index (ADX) at 13.29 suggests a weak trend, highlighting the potential for range-bound trading in the short term. For scalpers, this environment requires extreme caution, focusing on short-term entries and exits while closely monitoring price action around key levels.
Stepping up to the 4-hour timeframe, the trend shifts to neutral, but the underlying indicators still suggest caution. The RSI at 50.72 hovers in neutral territory, indicating a lack of strong directional bias. However, the MACD continues to show negative momentum, albeit less pronounced than on the hourly chart. The Stochastic, with K=12.31 and D=39.3, signals oversold conditions, but the ADX at 20.06 suggests a moderate trend, implying that any potential bounce may be limited. Key support on this timeframe lies at $2,037.68, while resistance is seen at $2,086.15. Swing traders should be looking for confirmation of a sustained move above or below these levels before initiating positions. The overall signal remains bearish, with 4 out of 8 signals pointing to a sell.
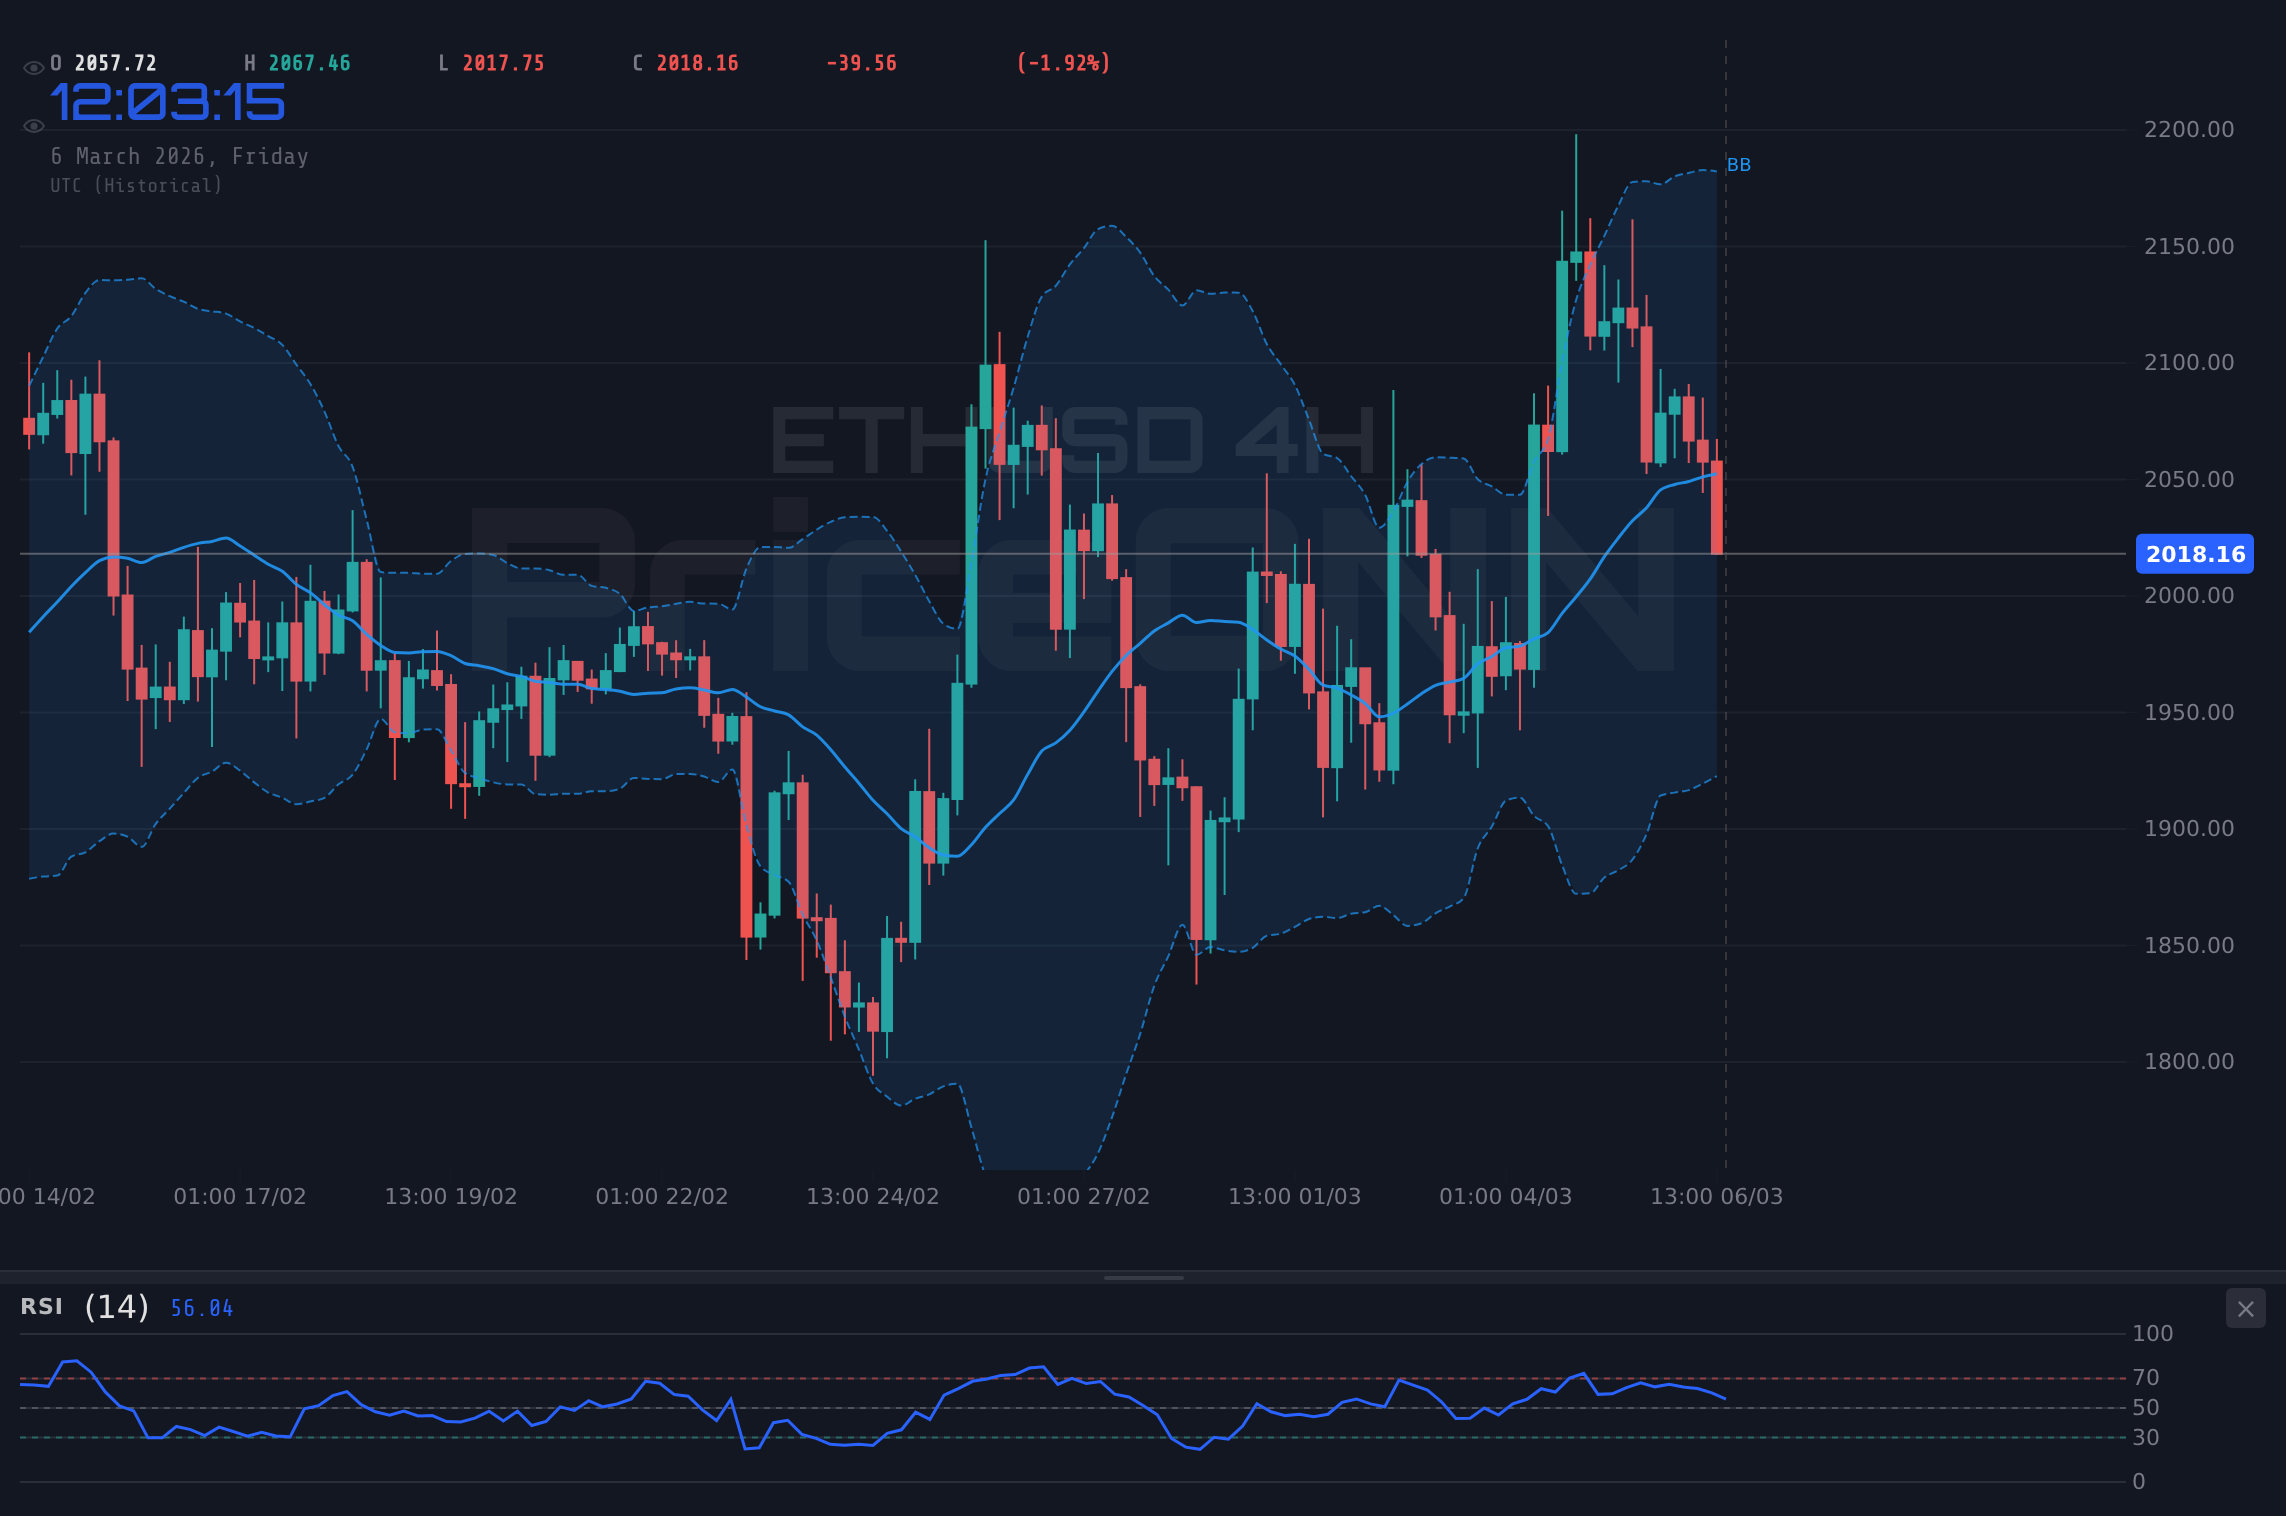
On the daily chart, the trend is neutral, with ETHUSD exhibiting a lack of clear direction. The RSI at 48.14 resides in neutral territory, further emphasizing the absence of strong momentum. The MACD, while positive, is showing signs of weakening, suggesting that the bullish momentum that has driven ETHUSD in recent months may be waning. The Stochastic, with K=71.28 and D=57.88, signals overbought conditions, hinting at the potential for a pullback. The ADX at 33.69 indicates a strong trend, but the conflicting signals from other indicators suggest that the trend may be nearing exhaustion. Key support on this timeframe is found at $2,033.04, while resistance is located at $2,142.87. Long-term investors should be closely monitoring these levels, as a break below support could signal a more significant correction, while a sustained move above resistance could pave the way for further gains.
The recent surge in crude oil prices, spurred by escalating tensions in the Middle East, has added another layer of complexity to the ETHUSD outlook. The rise in energy costs raises concerns about renewed inflationary pressures, which could force central banks to maintain their hawkish monetary policies. This scenario would likely weigh on risk assets like ETHUSD, as higher interest rates tend to dampen investor appetite for speculative investments. According to Reuters, "Fed officials have repeatedly emphasized the need to see further evidence that inflation is sustainably declining before considering interest rate cuts." This cautious stance from the Fed underscores the challenges facing ETHUSD in the current environment.
The correlation between ETHUSD and the DXY (Dollar Index) is also worth noting. With the DXY currently at 99.07 and trending upwards, ETHUSD is facing additional headwinds. A stronger dollar typically puts downward pressure on risk assets like ETHUSD, as it makes them more expensive for international investors. The inverse correlation between the two assets has been particularly evident in recent months, as the DXY has strengthened on the back of hawkish signals from the Federal Reserve. This dynamic suggests that any further gains in the DXY could exacerbate the downward pressure on ETHUSD.
In addition to the technical and fundamental factors, market sentiment also plays a crucial role in shaping the ETHUSD price action. The recent decline in the SP500, currently at 6788.1, reflects a broader risk-off environment, which tends to favor safe-haven assets over riskier ones like ETHUSD. The Dow Jones Industrial Average is also down, trading at 47702.5, further underscoring the prevailing risk aversion in the market. This sentiment is likely to persist as long as geopolitical tensions remain elevated and concerns about inflation continue to linger.
Historically, periods of heightened geopolitical uncertainty and rising oil prices have often led to increased volatility in the cryptocurrency market. During the 2008 financial crisis, for example, the surge in oil prices and the collapse of Lehman Brothers triggered a massive sell-off in risk assets, including cryptocurrencies. While the current situation is not directly comparable to the 2008 crisis, the underlying dynamics are similar, with rising energy costs and geopolitical risks creating a challenging environment for risk assets. Investors should therefore be prepared for increased volatility in ETHUSD in the coming weeks and months.
For scalpers, the short-term technical signals are predominantly bearish, suggesting that shorting opportunities may arise. However, given the weak trend indicated by the ADX, scalpers should exercise caution and focus on quick entries and exits. Swing traders should be looking for confirmation of a sustained move above or below key support and resistance levels before initiating positions. The 4-hour chart offers a clearer picture of these levels, with support at $2,037.68 and resistance at $2,086.15. Long-term investors should be prepared for increased volatility and should closely monitor key support levels on the daily chart. A break below $2,033.04 could signal a more significant correction, while a sustained move above $2,142.87 could pave the way for further gains. It is also crucial to stay informed about macroeconomic data releases and geopolitical developments, as these factors can significantly impact the ETHUSD price action.
ETHUSD breaks above the resistance at $2,086.15, fueled by positive market sentiment and a weakening DXY. Targets include $2,105.56 and $2,120.09, paving the way for further gains.
ETHUSD breaks below the support at $2,033.04, driven by risk-off sentiment and a strengthening DXY. Targets include $2,018.27 and $1,987.79, potentially leading to a deeper correction.
Technical Outlook Summary
| Indicator | Value | Signal |
|---|---|---|
| RSI (14) | 38.28 | Bearish |
| MACD Histogram | Negative | Bearish |
| Stochastic | 25.77/40.65 | Bearish |
| ADX | 13.29 | Weak Trend |
| Bollinger | Lower Band | Bearish |
Key Levels
Support Levels
Resistance Levels
Frequently Asked Questions: ETHUSD Analysis
Is ETHUSD a good buy right now?
ETHUSD is currently trading at $2,049.59 and faces bearish pressure. Given the weak trend and negative momentum, waiting for a clearer bullish signal or a break above $2,086.15 is advisable before considering a buy.
What is the ETHUSD price forecast for this week?
The ETHUSD price forecast for this week is bearish, with a potential move towards the $2,033.04 support level. A break below this level could trigger a further decline towards $1,987.79. Probability assessment: 60% bearish, 40% bullish.
What are the key support and resistance levels for ETHUSD?
Key support levels for ETHUSD are at $2,033.04, $1,987.79, and $1,923.21. Resistance levels are at $2,142.87, $2,207.45, and $2,252.7, representing potential areas where the price may face selling pressure.
Why is ETHUSD moving today?
ETHUSD is moving lower today due to a combination of factors, including rising crude oil prices, escalating geopolitical tensions in the Middle East, and a strengthening US dollar. These factors are contributing to a risk-off environment, which is weighing on risk assets like ETHUSD.
The ethereum trading strategy 2026 requires careful consideration of the technical picture, fundamental drivers, and market sentiment. The current environment is challenging, but patient investors who wait for the right setup and manage their risk accordingly will find opportunities. With disciplined risk management, these choppy waters can be navigated safely.
Track markets in real-time
AI-powered analysis, technical indicators and real-time price data.
Join Our Telegram Channel
Breaking market news, AI analysis and trading signals instantly.
Join Channel