How to trade gold effectively? As XAUUSD sits near $5,171.51, the market is in a holding pattern ahead of next week's crucial jobs data. The precious metal has been on a rollercoaster ride, influenced by geopolitical tensions and fluctuating economic indicators. The question now is whether the upcoming data will provide a clear direction or add to the existing uncertainty.
- RSI at 66.06 on the 1-hour chart indicates growing bullish momentum.
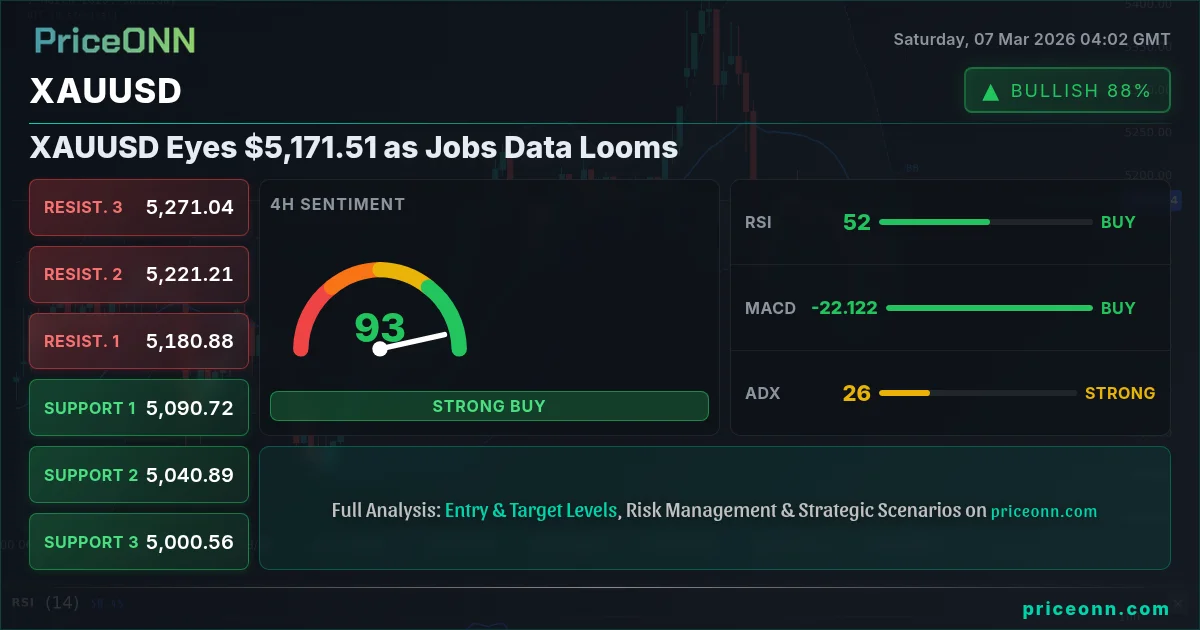
- Key resistance level to watch is $5,170.44; a break above could signal further upside.
- MACD histogram confirms positive momentum, supporting a potential bullish breakout.
- DXY's current level is 98.71, inversely correlated with XAUUSD's movements.
The gold market has been a battleground between bulls and bears, with conflicting signals emerging from various timeframes. On the 1-hour chart, the trend appears neutral, but the RSI at 66.06 suggests building bullish momentum. The MACD histogram is also positive, further supporting this view. However, the ADX at 23.12 indicates a moderate trend strength, suggesting that the current move may not be sustainable in the long run. The Stochastic oscillator, with K=91.51 and D=78.64, is flashing overbought conditions, hinting at a possible pullback.
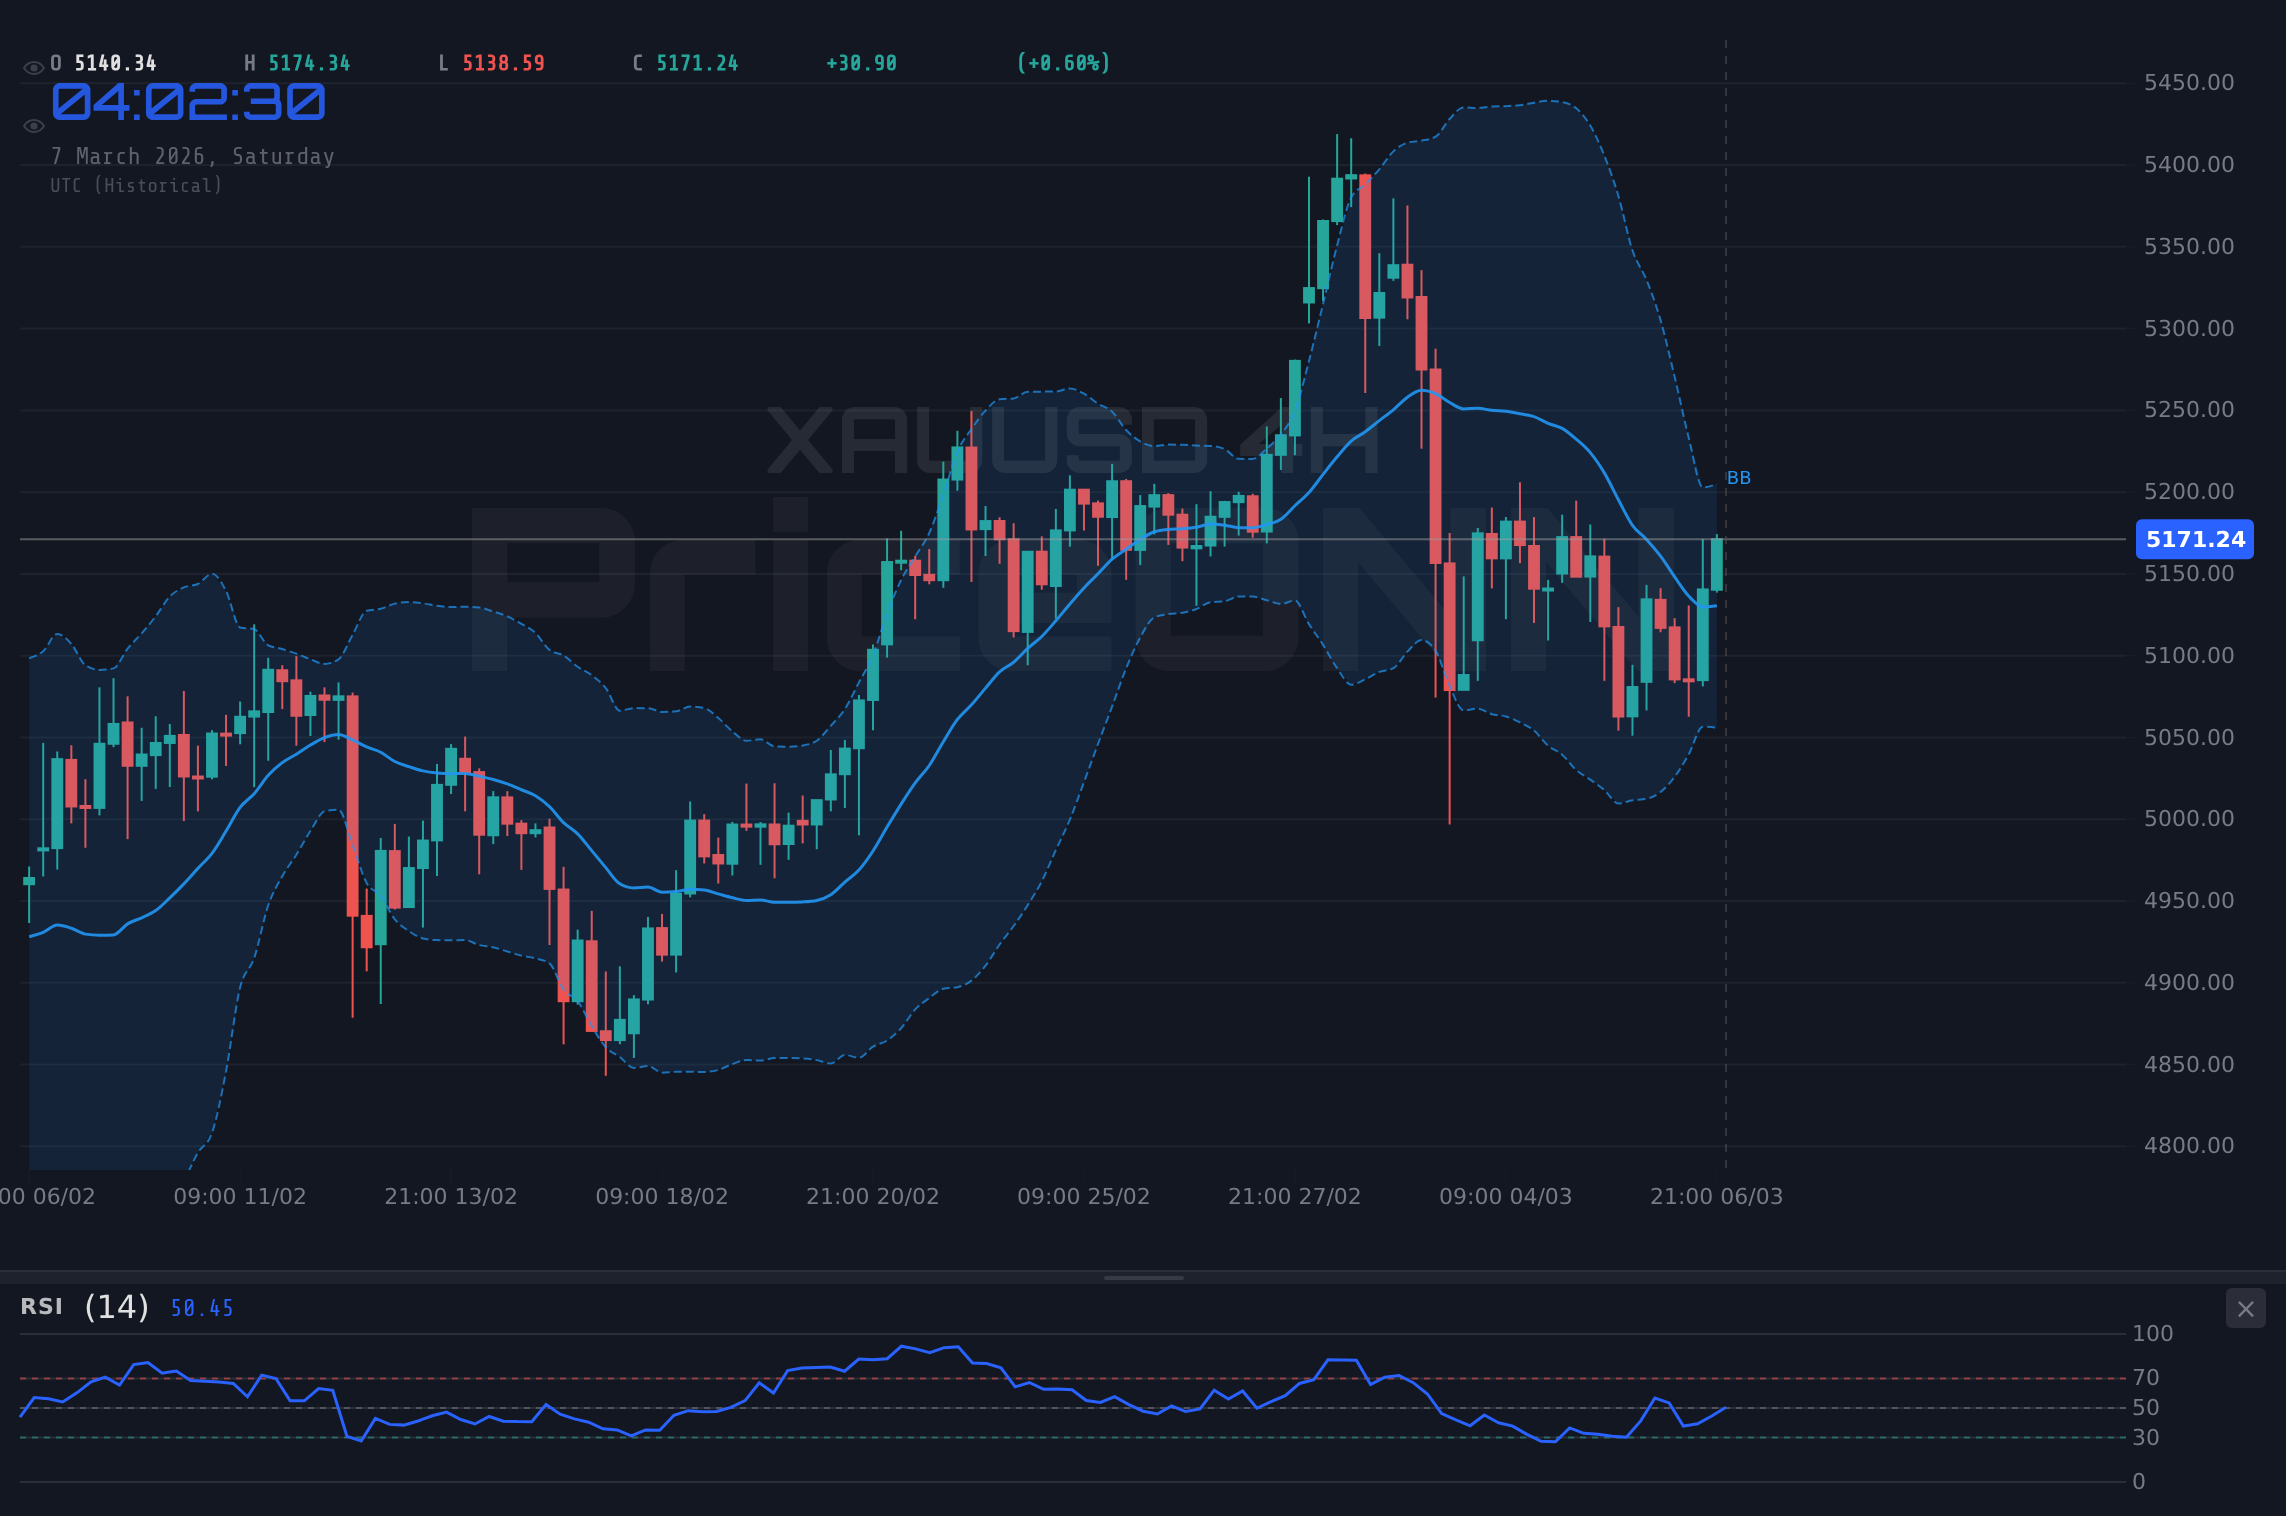
Stepping back to the 4-hour timeframe, a different picture emerges. While the overall signal is still 'Buy', the trend is bearish with a strength of 93%. The RSI is at 51.89, hovering in neutral territory but trending upward. The ADX at 26.87 reinforces the bearish trend, suggesting caution for aggressive bullish plays. The Stochastic oscillator shows K=46.92 and D=34.46, signaling a potential bullish crossover, but this needs confirmation.
On the daily chart, the trend is neutral, but the ADX at 14.64 indicates a weak trend. The RSI is at 55.24, suggesting a slight bullish bias, but the Stochastic oscillator, with K=32.58 and D=59.4, is signaling a bearish crossover. The MACD histogram is also negative, adding to the conflicting signals. The key resistance to watch is $5,166.71, while support lies at $5,023.02.
The DXY (Dollar Index) plays a crucial role in XAUUSD's movements. Currently, the DXY is at 98.71, showing a slight downward trend. This could provide some support for gold, but the inverse correlation is not always consistent. The SP500 is also showing weakness, currently at 6737.1, which could drive safe-haven demand towards gold. However, the overall risk sentiment remains mixed, making it difficult to predict the short-term direction of XAUUSD.
The surge in crude oil prices, with WTI at $90.81, is another factor to consider. Rising oil prices can fuel inflation expectations, which could boost gold's appeal as an inflation hedge. However, this relationship is not always straightforward, as other factors, such as interest rates and economic growth, can also influence gold's price.
Next week's US jobs data will be a major catalyst for XAUUSD. The market is expecting the Nonfarm Payrolls (NFP) data to provide insights into the strength of the US economy. A strong NFP number could strengthen the dollar and weigh on gold, while a weak number could weaken the dollar and support gold. According to Forex Market Awaits US Jobs Data: USD/JPY Eyes 158.00, EUR/USD Under Pressure, the forex market is bracing for volatility as traders await the latest US Nonfarm Payrolls (NFP) data.
Adding to the complexity, geopolitical tensions remain elevated. Escalating tensions in the Middle East have triggered a significant surge in crude oil prices, particularly WTI, presenting implications for New Zealand and WTI Crude. This can create safe-haven demand for gold, but also lead to increased volatility. The interplay between these factors makes it challenging to determine XAUUSD's next move.
From a technical perspective, XAUUSD is currently trading above its 200-day moving average, which is generally considered a bullish sign. However, the price is also facing resistance from the 50-day moving average, which is acting as a barrier. A break above this level could open the door for further gains, while a failure to do so could lead to a retest of the recent lows.
With current gram altın fiyatı tl february 2026 being a rising search term, it indicates local interest in gold prices, possibly due to inflation concerns or currency devaluation. Keep an eye on central bank policy, macroeconomic data, and geopolitical risks.
Given the conflicting signals and the upcoming jobs data, a neutral stance seems appropriate for now. However, traders should be prepared to react quickly to any surprises in the data. A break above $5,170.44 could signal a bullish breakout, while a break below $5,152.68 could lead to further downside.
A break above the resistance at $5,170.44 could trigger a rally towards the next resistance levels at $5,181.27 and $5,188.2. This scenario is likely if the jobs data comes in weaker than expected, weakening the dollar and boosting safe-haven demand. A decisive break above $5,188.2 could open the door for a test of the $5,200 level.
A break below the support at $5,152.68 could lead to a decline towards the next support levels at $5,145.75 and $5,134.92. This scenario is likely if the jobs data comes in stronger than expected, strengthening the dollar and reducing safe-haven demand. A sustained break below $5,134.92 could trigger a deeper correction towards the $5,100 level.
The upcoming US jobs data could significantly impact XAUUSD. Traders should exercise caution and manage their risk accordingly.
Technical Outlook Summary
| Indicator | Value | Signal |
|---|---|---|
| RSI (14) | 66.06 | Neutral |
| MACD Histogram | Positive | Bullish |
| Stochastic | K=91.51, D=78.64 | Overbought |
| ADX | 23.12 | Moderate Trend |
| Bollinger | Middle Band | Neutral |
Key Levels
Support Levels
Resistance Levels
Frequently Asked Questions: XAUUSD Analysis
Is XAUUSD a good buy right now?
Given the conflicting signals, a neutral stance is warranted. A break above $5,170.44 could signal a bullish entry, while a close below $5,152.68 might indicate a shorting opportunity.
What is the XAUUSD price forecast for this week?
If the jobs data is weak, XAUUSD could test the $5,188.2 resistance. Conversely, strong jobs data could push it down to the $5,134.92 support. The probability of either scenario is roughly 50/50.
What are the key support and resistance levels for XAUUSD?
Key support levels are $5,152.68, $5,145.75, and $5,134.92. Key resistance levels are $5,170.44, $5,181.27, and $5,188.2.
Why is XAUUSD moving today?
XAUUSD is moving due to a combination of factors, including anticipation of next week's US jobs data, DXY fluctuations, and geopolitical tensions.
Track markets in real-time
AI-powered analysis, technical indicators and real-time price data.
Join Our Telegram Channel
Breaking market news, AI analysis and trading signals instantly.
Join Channel