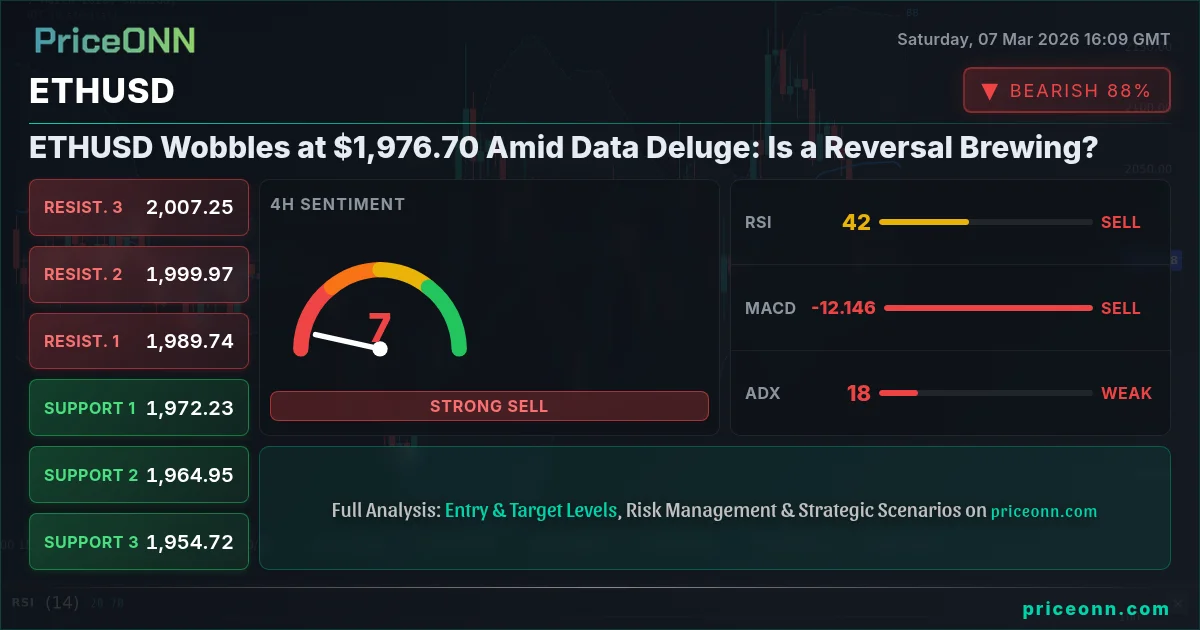
Ethereum is currently range-bound, trading near $1,976.70, and the question on every trader’s mind is: why is ethereum falling today? The cryptocurrency has been struggling to find a clear direction, caught between conflicting technical signals and a looming storm of economic data releases. Having navigated choppy waters in recent weeks, ETHUSD now faces a crucial test that could determine its trajectory for the rest of March. A decisive move is needed to escape this consolidation phase, and the next few days could provide the necessary catalyst.
- RSI at 40.47 signals weakening bullish momentum, suggesting a potential pullback
- Critical support lies at $1,972.21, a break below could trigger further selling pressure
- MACD histogram shows fading positive momentum: bullish momentum is fading
- Upcoming US economic data releases could significantly impact ETHUSD's correlation with the DXY
Ethereum's Tightrope Walk: Technical Indicators in Conflict
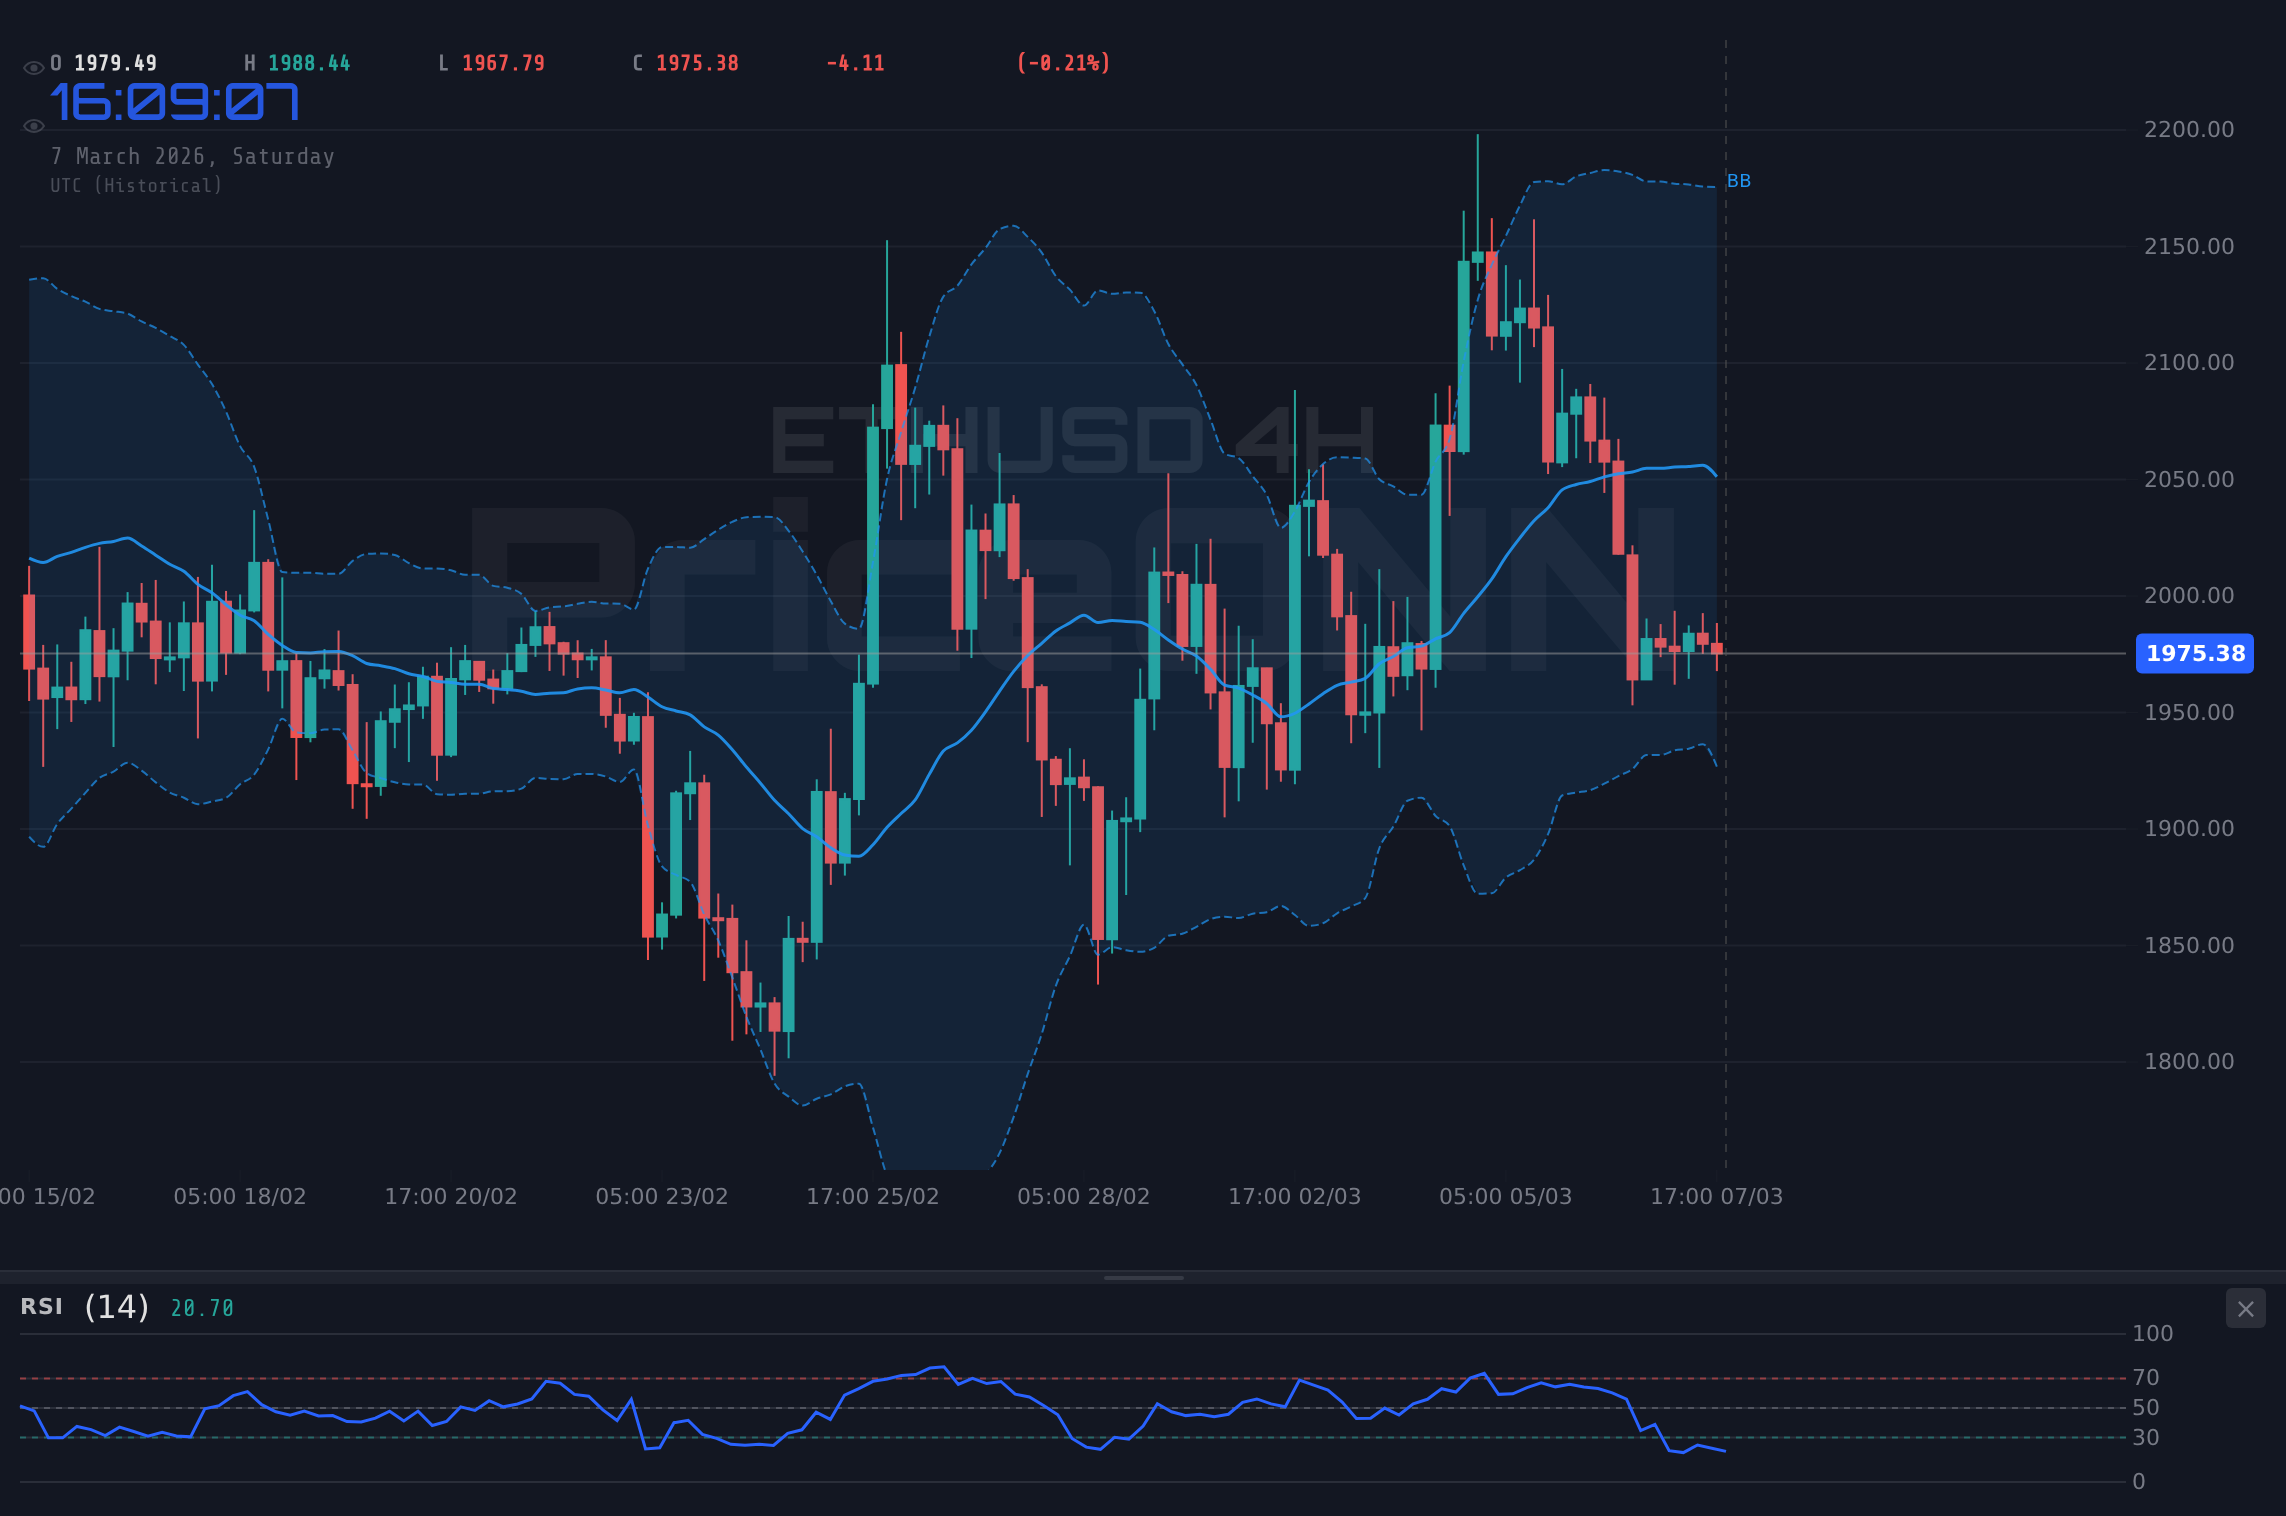
The technical picture for ETHUSD is far from clear-cut, with indicators painting a mixed landscape. On the hourly chart, ETHUSD is exhibiting a neutral trend, as indicated by the trend strength of 50%. The RSI(14) reads 40.47, suggesting that the bulls are losing steam, but not yet in oversold territory. This could signal a potential pullback or consolidation before the next significant move. The MACD, while still showing positive momentum, is hinting at a potential slowdown in bullish activity. Meanwhile, the Stochastic indicator is flashing a sell signal, with %K at 56.17 and %D at 62.18, indicating that the price may be due for a correction. The ADX, at 34.19, indicates a strong downward trend, adding to the bearish signals.
The 4-hour timeframe offers a slightly different perspective. Here, the trend is also neutral, but the RSI(14) is at 42.36, further reinforcing the idea of weakening bullish momentum. The MACD histogram also shows negative momentum, suggesting that sellers are starting to gain traction. The Stochastic indicator presents an oversold condition, with %K at 18.51 and %D at 12.33, potentially hinting at a short-term bounce. However, the ADX at 18.21 suggests a weak trend, indicating that any potential bounce may be short-lived.
Key Levels to Watch: Support, Resistance, and Breakout Zones
For ETHUSD, key support levels to monitor are $1,972.21, $1,959.67 and $1,951.56. These levels could act as potential bounce zones or areas where buyers step in to defend against further declines. On the resistance side, the immediate level to watch is $1,992.86, followed by $2,000.97 and $2,013.51. A decisive break above these resistance levels could signal a resumption of the upward trend. However, given the conflicting technical signals, traders should exercise caution and wait for confirmation before committing to a directional bias. The 1-hour chart shows resistance at $1,992.86, a level that needs to be breached to confirm any bullish momentum. The overall signal is leaning towards a sell, with 7 bearish signals against just 1 bullish signal. This is a crucial level, and a failure to break above it could lead to a retest of lower support levels.
The daily chart reveals a neutral trend, but with a bearish undertone. The RSI(14) is at 45.09, indicating that the price is neither overbought nor oversold, but leaning towards the bearish side. The MACD shows positive momentum, while the Stochastic indicator signals a sell, with %K at 49.02 and %D at 58.52. The ADX, at 31.71, suggests a strong downward trend, further reinforcing the bearish bias. Key support on this timeframe lies at $1,926.10, $1,870.63 and $1,788.17, while resistance is at $2,064.03, $2,146.49 and $2,201.96. The overall signal is a sell, with 7 bearish signals against just 1 bullish signal.
The Looming Data Deluge: How Economic Releases Could Trigger a Breakout
The coming week is packed with high-impact economic data releases that could significantly influence the direction of ETHUSD. On Wednesday, March 4th, several key US economic indicators are scheduled for release, including data that could provide insights into the health of the US economy. These releases are closely watched by traders as they can trigger significant volatility in the forex and cryptocurrency markets. According to Reuters, the Fed is closely monitoring these data points as it weighs its next policy move. A weaker-than-expected jobs report, as highlighted in the recent U.S. Weekly Economic & Financial Commentary, could prompt the Fed to adopt a more dovish stance, potentially weakening the dollar and providing a boost to ETHUSD.
On Friday, March 6th, additional data releases will provide further insights into the state of the US economy. These releases, combined with the earlier data, will paint a more complete picture of the economic landscape and could significantly impact market sentiment. Traders will be closely watching these releases for clues about the Fed's future policy decisions. The forex market awaits US jobs data, with USD/JPY eyeing 158.00 and EUR/USD under pressure. These correlations often trickle down to crypto markets as well.
Given the current technical setup and the looming data deluge, ETHUSD is at a critical juncture. The conflicting technical signals suggest that a period of consolidation or range-bound trading is likely to persist in the near term. However, the economic data releases could act as a catalyst for a breakout, either to the upside or the downside. Traders should closely monitor these releases and adjust their positions accordingly.
DXY's Influence: A Stronger Dollar Could Weigh on ETHUSD
The Dollar Index (DXY) is a key indicator to watch for ETHUSD traders. Currently, the DXY sits at 98.71, showing a slight decrease of 0.05%. However, the 4-hour chart indicates a strong upward trend, with an ADX of 44.54, suggesting that the dollar could strengthen in the near term. A stronger dollar typically puts downward pressure on ETHUSD, as it makes the cryptocurrency more expensive for international buyers. The 1-hour chart, however, shows a bearish signal, with the RSI at 47 and the Stochastic indicator signaling a sell. This conflicting signal suggests that the DXY may be due for a short-term pullback, which could provide some relief for ETHUSD.
The correlation between the DXY and ETHUSD is not always perfect, but it is generally inverse. A rising DXY tends to coincide with a falling ETHUSD, and vice versa. Therefore, traders should closely monitor the DXY for clues about the potential direction of ETHUSD. A decisive break above the 99.21 resistance level on the DXY could signal a stronger dollar and further downside pressure on ETHUSD. Conversely, a break below the 98.49 support level could weaken the dollar and provide a boost to ETHUSD.
Broader Market Sentiment: Risk Aversion Could Boost Safe-Haven Demand
Overall market sentiment is another important factor to consider when trading ETHUSD. The SP500 is currently trading at 6737.1, down 1.16% on the day. The Nasdaq100 is also down, falling 1.31% to 24639.96. These declines suggest that risk appetite is waning, which could lead to increased demand for safe-haven assets. While ETHUSD is not typically considered a safe-haven asset, it can sometimes benefit from risk aversion as traders seek alternative investments outside of traditional equities. The DowJones30 is also down, declining 0.83% to 47483. These declines indicate a broad-based selloff in the equity markets, which could further fuel demand for safe-haven assets.
However, it is important to note that ETHUSD is a high-volatility asset and is not immune to market downturns. In times of extreme risk aversion, traders may liquidate their ETHUSD holdings to raise cash, which could lead to further declines. Therefore, traders should carefully assess their risk tolerance and adjust their positions accordingly. The WTI is up 15.21% at 90.81 indicating high energy prices. Also, escalating Middle East tensions have triggered a significant surge in crude oil prices, impacting forex markets, with Brent nearing $85 a barrel, raising concerns that central banks. This could add to inflationary pressures and potentially affect ETHUSD.
Trade Recommendation: Patience is Key – Watch for Confirmation
Given the conflicting technical signals and the looming data deluge, a clear trade setup is not yet evident. The ADX on the 4-hour chart is at 18.21, indicating a weak trend and choppy market conditions. This makes it risky to commit to a directional bias at this time. However, a daily close above $1,992.86 would open the door for a potential test of the $2,000.97 resistance level. Conversely, a break below the $1,972.21 support level could trigger further selling pressure and a retest of lower support levels.
Traders should exercise patience and wait for confirmation before committing to a directional bias. Closely monitor the economic data releases and the DXY for clues about the potential direction of ETHUSD. If the data is supportive of a stronger dollar, look for shorting opportunities on ETHUSD. Conversely, if the data is supportive of a weaker dollar, look for buying opportunities. Manage your risk and wait for your setup-the market always gives a second chance.
Frequently Asked Questions: ETHUSD Analysis
Is ETHUSD a good buy right now?
Given the current price of $1,976.70 and the conflicting technical signals, ETHUSD is not a clear buy right now. A daily close above $1,992.86 would be needed to confirm bullish momentum.
What is the ETHUSD price forecast for this week?
The ETHUSD price forecast for this week is highly dependent on the upcoming economic data releases, but a test of $2,000.97 resistance is possible if bullish momentum builds. Conversely, a break of $1,972.21 support could lead to further declines.
What are the key support and resistance levels for ETHUSD?
Key support levels for ETHUSD are $1,972.21, $1,959.67 and $1,951.56. Key resistance levels are $1,992.86, $2,000.97 and $2,013.51.
Why is ETHUSD moving today?
ETHUSD is moving today due to a combination of conflicting technical signals and anticipation of upcoming economic data releases. Market sentiment and DXY movements are also playing a role.
Track markets in real-time
AI-powered analysis, technical indicators and real-time price data.
Join Our Telegram Channel
Breaking market news, AI analysis and trading signals instantly.
Join Channel