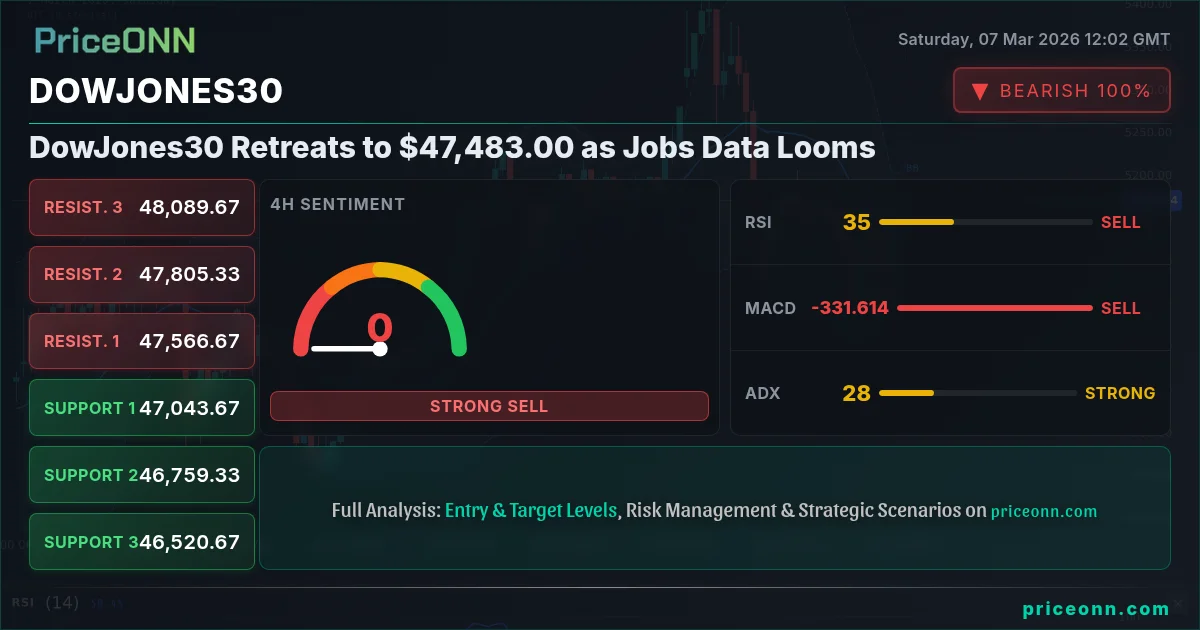
The Dow Jones Industrial Average closed last week at $47,483.00, a slight retreat after a week marked by volatile swings. Now, the market's attention turns to the upcoming U.S. jobs data, which could significantly influence Federal Reserve policy and, consequently, equity markets. The 'dow jones price prediction this week' hinges heavily on these figures, making it a critical period for investors.
- DowJones30 closed at $47,483.00, reacting to mid-week volatility amid fluctuating oil prices.
- Key support level to watch is $47,344.33, a break below which could signal further downside.
- ADX at 39.19 on the 1H chart indicates a strong downtrend, suggesting bearish momentum in the short term.
- Next week's jobs data release is expected to drive DowJones30 correlation with DXY based on potential Fed policy shifts.
The recent surge in crude oil prices, with WTI reaching $90.81, initially buoyed energy stocks within the DowJones30 but also stoked concerns about rising inflation. According to Reuters, "Fed officials remain vigilant about inflation's persistence." This sentiment has kept the market on edge, as the Federal Reserve's response to inflationary pressures could trigger further market corrections. The U.S. Weekly Economic & Financial Commentary noted that "the February jobs report was uniformly negative," adding to the market's anxiety. The DowJones30 today analysis suggests investors are closely monitoring these factors for clues about the Fed's next move.
Why $47,344.33 is the Line in the Sand
From a technical perspective, the $47,344.33 level represents a critical support for the DowJones30. This level, identified on the 1D timeframe, has acted as a buffer against steeper declines in recent trading sessions. A decisive break below this support could open the door to further downside, potentially targeting the next support level at $46,810.67. The DowJones30 weekly outlook depends on how well this support holds up. Having tracked DowJones30 through the 2024 rate cycle, the market's reaction to key support levels has often dictated short-term trend direction.
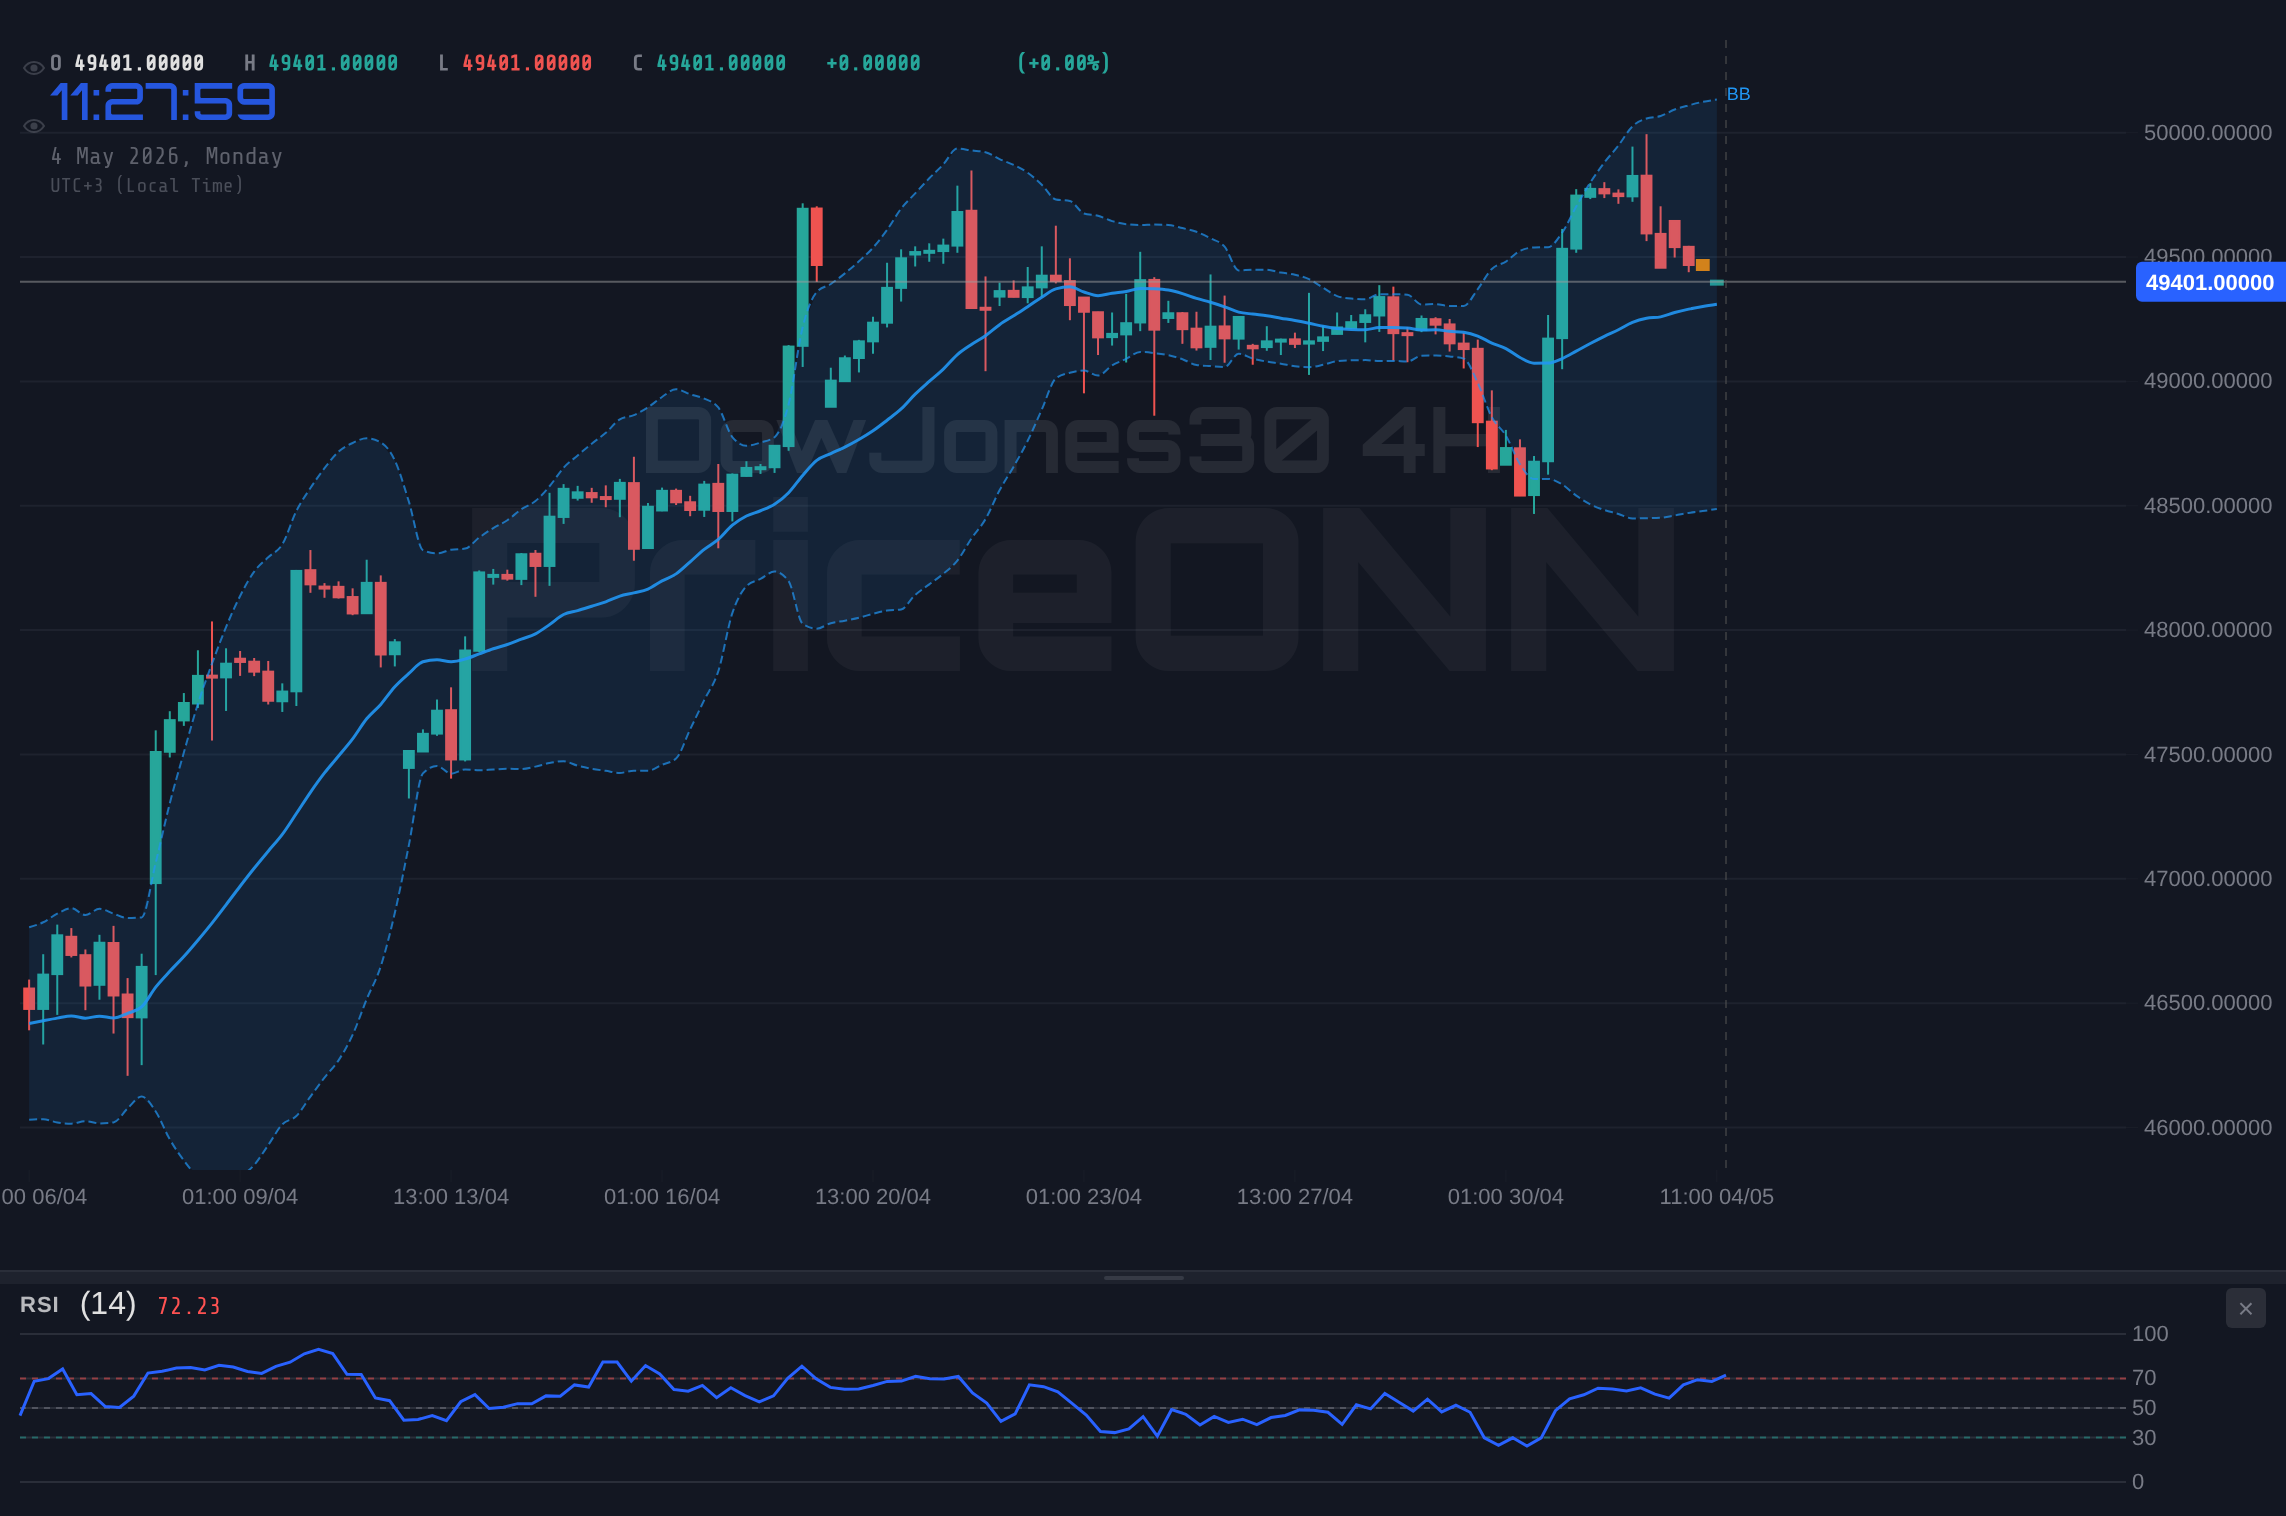
The 1-hour chart reveals an ADX of 39.19, signaling a strong downtrend in the short term. This reinforces the bearish sentiment and suggests that the DowJones30 could experience further selling pressure if the $47,344.33 support is breached. However, the Stochastic oscillator on the same timeframe shows a K value of 44.34 and a D value of 28.78, indicating a potential for a short-term bounce. The dueling signals highlight the market's uncertainty as it awaits more definitive catalysts.
Next week's jobs data release could trigger significant volatility in the DowJones30. Traders should exercise caution and manage their risk accordingly.
Jobs Data: The Catalyst for the Next Move
The upcoming U.S. jobs data is expected to be a major catalyst for the DowJones30. The market is keenly anticipating this release to gauge the strength of the labor market and its implications for Federal Reserve policy. If the jobs data comes in stronger than expected, it could reinforce expectations of continued hawkishness from the Fed, potentially leading to further declines in the DowJones30. Conversely, weaker-than-expected data could prompt the Fed to adopt a more dovish stance, providing a tailwind for the index. This is exactly where you need to pay attention, as the market's reaction to the jobs data could set the tone for the coming weeks.
The economic calendar shows several high-impact events related to the U.S. dollar. On Wednesday, March 4, multiple USD events occurred, and on Friday, March 6, more USD data was released. The impact of these events on the DowJones30 is still unfolding, and the upcoming jobs data will provide further clarity. The market is pricing in various scenarios, and the jobs data will either confirm or refute these expectations. The DowJones30 news impact is often directly tied to these key economic releases.
The Bearish Scenario: A Test of Lower Levels
The bearish scenario for the DowJones30 involves a break below the $47,344.33 support level, which would likely trigger a wave of selling pressure. In this scenario, the index could target the next support level at $46,810.67. A close below $47,344.33 would confirm this bearish thesis. The RSI on the daily chart, currently at 32.96, supports this view, indicating oversold conditions, which often precede further declines. The DowJones30 price forecast in this scenario is decidedly negative.
The Nasdaq100, a tech-heavy index, is also showing weakness, with a daily decline of -1.31%. This broader market weakness is weighing on the DowJones30, as both indices are often correlated. Risk appetite is declining, and safe-haven demand may increase, further exacerbating the bearish sentiment. The bearish scenario gains traction if the DXY strengthens further, putting additional pressure on equities. With DXY at 98.71, the DowJones30 is under pressure.
If DowJones30 holds above $47,344.33 and breaks above the initial resistance at $47,511.67, it could target $47,645.33 and potentially $47,741.67. This requires positive jobs data next week.
A break below $47,344.33 would confirm the bearish trend, targeting $47,185.33 and $47,051.67 as the next support levels. This scenario is likely if jobs data disappoints.
DowJones30 Trade Plan
Given the current technical picture, a short-term trading opportunity presents itself. The DowJones30 is exhibiting a strong downtrend on the 1H chart, with the ADX at 39.19 confirming the trend's strength. The RSI at 40.81 is not yet oversold, leaving room for further downside. Therefore, a short position is warranted.
Entry Trigger: A break below $47,281.67 on the 1H chart.
Target 1: $47,185.33
Target 2: $47,051.67
Stop/Invalidation: $47,511.67. A move above this level would invalidate the bearish thesis.
Probability Estimate: 65%
This trade plan is contingent on the jobs data release next week. Significant deviation from expectations could invalidate this plan.
DowJones30: AI Technical Analysis
AI technical analysis tools indicate a mixed picture for the DowJones30. While the short-term trend is bearish, longer-term indicators suggest potential for a rebound. The key is to monitor the market's reaction to the jobs data and adjust positions accordingly. The chart pattern recognition algorithms are flagging a potential descending triangle formation, which typically resolves to the downside. However, multi-timeframe analysis reveals that the DowJones30 is approaching a key support zone, where a reversal could occur.
Market sentiment analysis suggests that investors are becoming increasingly bearish on the DowJones30, which could create a contrarian buying opportunity. Volatility analysis shows that the index is experiencing elevated levels of volatility, which often precede significant market moves. The breakout scanner is identifying potential breakout levels, both to the upside and the downside. The key level alerts are focused on the $47,344.33 support and the $47,511.67 resistance, which will likely determine the short-term direction of the index. DowJones30 key levels are critical for traders to watch.
Frequently Asked Questions: DowJones30 Analysis
Is DowJones30 a good buy right now?
Given the current downtrend and the upcoming jobs data, DowJones30 is not a clear buy right now. Wait for a confirmed break above $47,511.67 or a hold above $47,344.33 after the jobs data release before considering a long position.
What is the DowJones30 price forecast for this week?
The DowJones30 price forecast this week is highly dependent on the jobs data. A strong report could push it towards $47,741.67, while a weak report could see it decline to $47,051.67. The probability is roughly 50/50 until the data is released.
What are the key support and resistance levels for DowJones30?
Key support for DowJones30 is at $47,344.33, followed by $47,185.33. Key resistance is at $47,511.67, followed by $47,645.33. These levels are critical for identifying potential breakout or breakdown scenarios.
Why is DowJones30 moving today?
DowJones30 is primarily moving due to concerns about rising oil prices and their potential impact on inflation, coupled with anticipation for next week's jobs data. These factors are driving uncertainty and volatility in the market.
Track markets in real-time
AI-powered analysis, technical indicators and real-time price data.
Join Our Telegram Channel
Breaking market news, AI analysis and trading signals instantly.
Join Channel