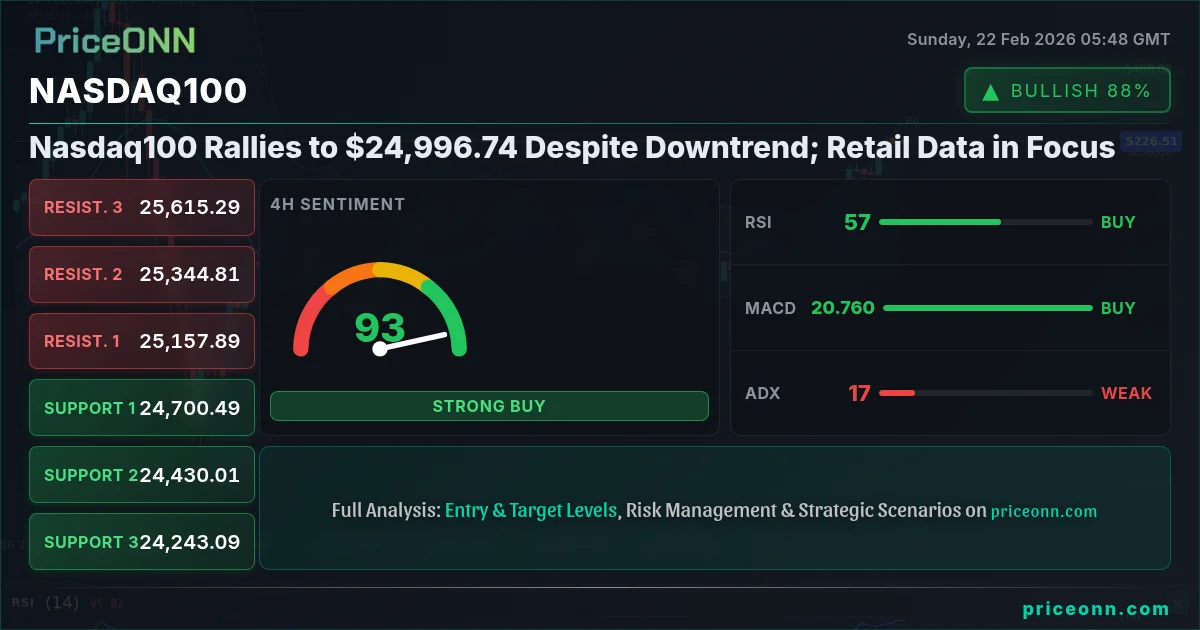
Last Friday, the Nasdaq100 closed at $24,996.74, showcasing resilience against its prevailing daily downtrend. This performance has set the stage for a week where retail data will likely play a pivotal role in shaping market sentiment. The index's ability to hold its ground despite bearish signals underscores the complexity of the current market environment, where technical indicators offer a mixed outlook.
- RSI at 47.52 on the daily timeframe suggests potential for further downside before reaching oversold conditions.
- Key resistance at 24,938.45 must be breached to confirm a bullish reversal.
- Stochastic oscillator signals a potential shift in momentum, with %K > %D.
- Upcoming retail data releases could be a significant catalyst for Nasdaq100 movement, influencing investor sentiment.
From a technical perspective, the Nasdaq100's performance presents a nuanced picture. The daily Relative Strength Index (RSI) sits at 47.52, indicating that there is room for further decline before the index reaches oversold territory. This suggests that the bearish trend, while challenged, has not yet been fully invalidated. However, the Stochastic oscillator presents a potentially conflicting signal. The %K line, currently at 53.2, is above the %D line at 44.52, suggesting a potential shift in momentum that could favor the bulls. This divergence in signals highlights the need for traders to exercise caution and seek further confirmation before committing to a directional bias.
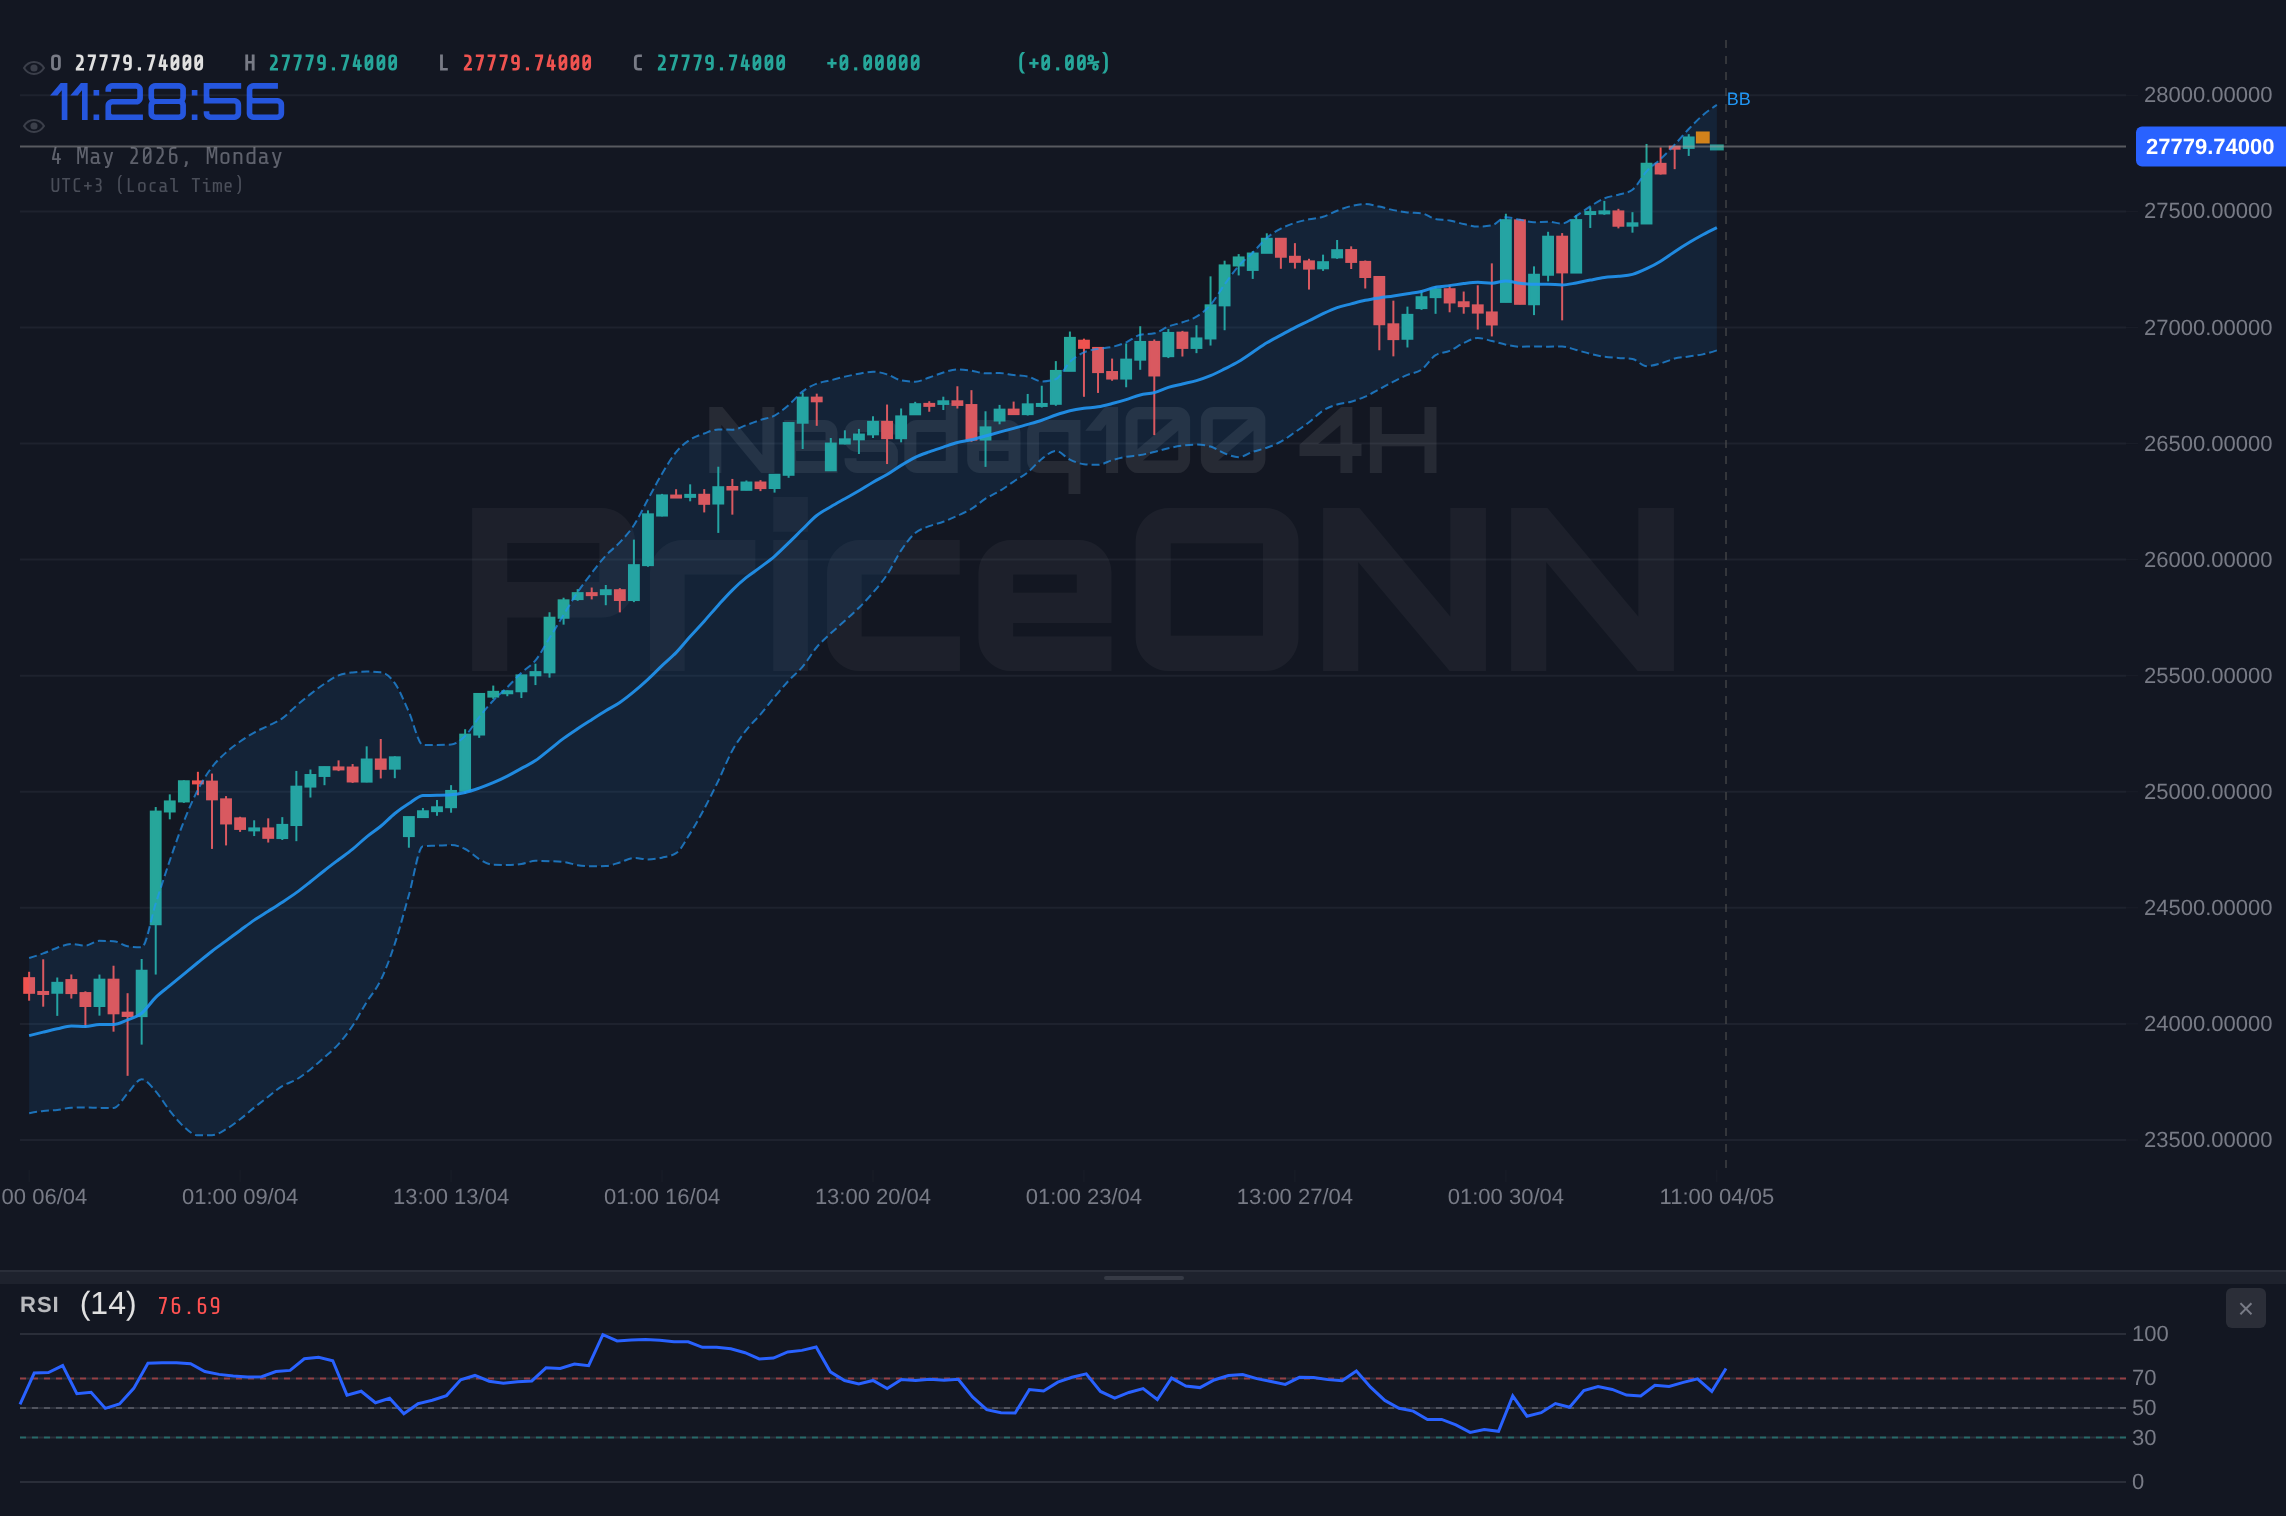
Analyzing the multi-timeframe dynamics reveals further complexities. On the 4-hour chart, the RSI at 56.78 indicates neutral momentum, with the index neither overbought nor oversold. However, the 1-hour chart shows an RSI of 59.1, also in neutral territory, suggesting a lack of strong directional conviction in the short term. The ADX, currently at 32.11 on the daily timeframe, points to a strong downtrend, reinforcing the bearish outlook. Yet, the 1-hour and 4-hour ADX values of 14.51 and 17.46, respectively, suggest a weakening trend. This multi-timeframe analysis underscores the importance of considering various perspectives when assessing the Nasdaq100's potential trajectory. This week's price action will be critical in determining if the overall trend can be reversed.
Key levels to watch include the resistance at 24,938.45, a level that needs to be decisively broken to confirm a bullish reversal. Failure to overcome this resistance could lead to renewed selling pressure, potentially driving the index towards the support level at 24,635.84. The fact that the 1H trend is neutral indicates that the market is waiting for a catalyst to move. The overall signal based on the data is to hold and not trade.
Looking ahead, the economic calendar is sparse, but the lack of specific data may not prevent the market from moving. According to Reuters, market participants are closely monitoring comments from Fed officials for clues about the future trajectory of monetary policy. Any hawkish signals could trigger a risk-off move, weighing on the Nasdaq100. Conversely, dovish remarks could provide a boost to the index. The DXY index, currently at 97.44, shows a mixed picture. The 1H trend is neutral, but both 4H and 1D trends indicate that the dollar is rising. A stronger dollar will put pressure on the Nasdaq100, especially on technology companies that rely on foreign revenue.
Examining the broader market context, the Dow Jones Industrial Average closed last Friday at 49,585.5, while the S&P 500 data is missing from the current market data. The Dow's performance suggests relative strength in value stocks, while the Nasdaq100's struggle reflects the ongoing rotation away from growth names. The current rise in Brent crude to $65.73 and WTI to $66.50 is indicative of rising inflation expectations. This could put upward pressure on interest rates, further weighing on the Nasdaq100. However, the fact that the SP500 data is missing and the direction of the index is unknown makes it difficult to fully assess the market risk sentiment.
Considering the correlation with other asset classes, gold (XAUUSD) is trading at $5,105.58, showing an upward trend, while silver (XAGUSD) is at $84.57 with a strong upward trend. The rise of gold and silver suggests that investors are seeking safe-haven assets, which could indicate a risk-off environment that is negative for the Nasdaq100. The daily trend for Bitcoin (BTCUSD) is downward at $67,947, while Ethereum (ETHUSD) is also showing a downward trend at $1,972.25. The fact that both major cryptocurrencies are showing a downward trend suggests that risk assets are not being favored by investors at this time.
EURUSD is trading at 1.17843 with an upward trend, while GBPUSD is at 1.34837 also with an upward trend. USDJPY is at 155.028 with an upward trend. The fact that the dollar is strengthening against the Euro and the Pound indicates that the dollar may be strengthening. The rise of AUDUSD to 0.70829 and NZDUSD to 0.59746 also suggests a weakening dollar. These conflicting signals from the forex market suggest a lack of clear direction.
The Nasdaq100's performance last week highlights the challenges facing growth stocks in the current market environment. While the index demonstrated resilience by closing at $24,996.74 against its daily downtrend, technical indicators paint a mixed picture. The upcoming retail data releases could serve as a critical catalyst, potentially clarifying the outlook for the index. However, the mixed signals from the commodity market and the forex market indicate that it is difficult to assess the market direction. In summary, it is best to wait for a catalyst to provide a clearer direction for the Nasdaq100.
From a fundamental perspective, the economic calendar is also sparse. This suggests that factors other than economic data will be driving the market this week. For example, geopolitical events could play a role in determining market direction. The current situation in Ukraine, for example, could have an impact on market sentiment. Investors should also pay attention to comments from Fed officials, as these could provide clues about the future trajectory of monetary policy. However, the lack of major economic events makes it difficult to predict what will move the market.
The Nasdaq100's performance last week highlights the challenges facing growth stocks in the current market environment. While the index demonstrated resilience by closing at $24,996.74, technical indicators paint a mixed picture. The upcoming retail data releases could serve as a critical catalyst, potentially clarifying the outlook for the index. Overall, the market is waiting for a catalyst.
Frequently Asked Questions: Nasdaq100 Analysis
Is Nasdaq100 a good buy right now?
With the Nasdaq100 closing at $24,996.74 and exhibiting mixed signals from technical indicators, a cautious approach is warranted; waiting for a decisive break above the 24,938.45 resistance or a drop to support at 24,635.84 before making a decision seems prudent.
What is the Nasdaq100 price forecast for this week?
The Nasdaq100 price forecast for this week is highly contingent on upcoming retail data; a positive surprise could push the index towards 25,112.01, while disappointing figures may see it retreat towards 24,506.79.
What are the key support and resistance levels for Nasdaq100?
Key support levels for the Nasdaq100 are identified at 24,635.84, 24,506.79 and 24,333.23; resistance levels are observed at 24,938.45, 25,112.01 and 25,241.06.
Why is Nasdaq100 moving today?
Nasdaq100's movement today is influenced by a combination of technical factors and broader market sentiment; the prevailing downtrend is being counteracted by short-term bullish signals, leading to range-bound trading with the market looking for a catalyst.
Track markets in real-time
AI-powered analysis, technical indicators and real-time price data.
Join Our Telegram Channel
Breaking market news, AI analysis and trading signals instantly.
Join Channel