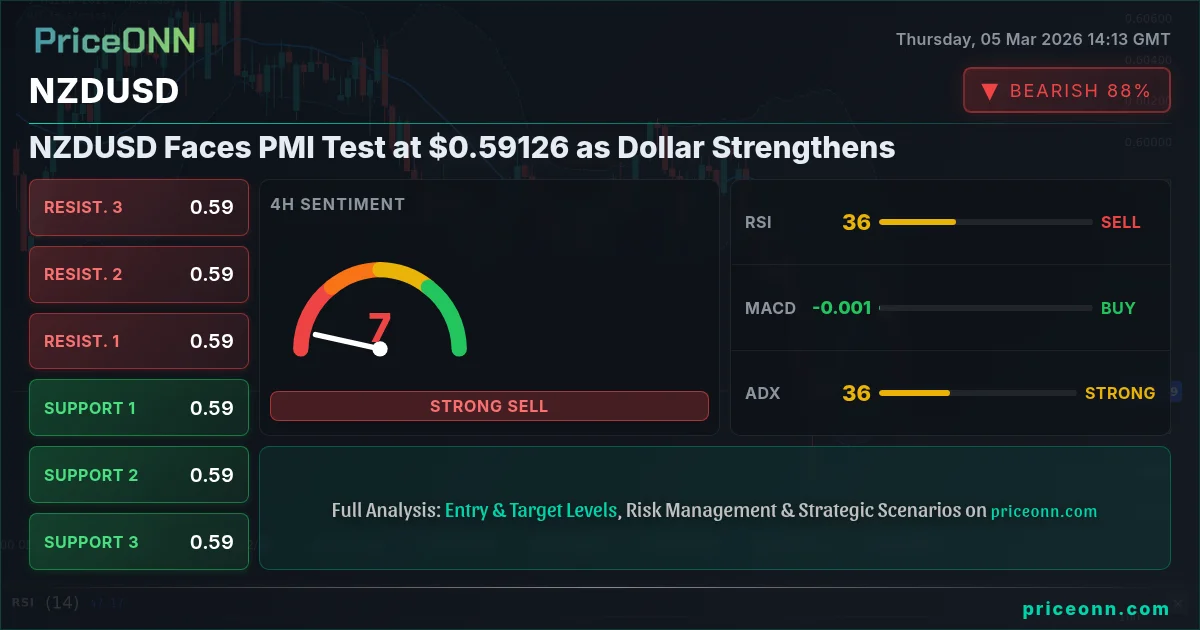
The New Zealand dollar is under pressure against the US dollar, currently trading at $0.59126, as the DXY (Dollar Index) strengthens to 98.76. This movement is taking place amid a backdrop of geopolitical tensions and anticipation of upcoming Purchasing Managers' Index (PMI) data, which could significantly influence the pair's direction. A stronger dollar, driven by safe-haven demand and expectations of continued hawkish monetary policy, is weighing on riskier assets like the Kiwi. The key question is whether the NZD can withstand the dollar's strength, particularly with the Reserve Bank of New Zealand (RBNZ) maintaining a cautious stance despite recent economic gains.
- NZDUSD currently trades at $0.59126 amid strengthening USD and geopolitical tensions.
- Immediate resistance lies at $0.59304, a break above which could signal a bullish continuation.
- Key support at $0.5899; a break below could trigger further downside.
- Upcoming PMI data and DXY movements will be critical drivers for NZDUSD's near-term direction.
The near-term trajectory of NZDUSD hinges on a confluence of factors, primarily the strength of the US dollar and the resilience of the New Zealand economy. The latest news indicates heightened geopolitical tensions, particularly in the Middle East, which are bolstering the dollar's appeal as a safe-haven asset. According to Reuters, investors are flocking to the dollar amid uncertainty, creating headwinds for commodity-linked currencies like the NZD. Furthermore, the SP500 is down 0.5% and DowJones30 is down 0.78% signaling risk-off sentiment which supports the DXY. This risk-off sentiment puts pressure on NZDUSD.
However, the Kiwi has shown remarkable strength recently, driven by positive economic data and a relatively hawkish stance from the RBNZ. Despite this, the central bank has expressed caution, citing concerns about global economic headwinds and the potential impact of rising interest rates on domestic growth. This cautious approach may limit the NZD's upside potential, particularly if the US Federal Reserve maintains its hawkish stance. The upcoming PMI data will provide further insights into the health of the New Zealand economy and could influence the RBNZ's future policy decisions.
From a technical perspective, the 1-hour chart for NZDUSD paints a neutral picture. The RSI(14) sits at 42.51, suggesting neither overbought nor oversold conditions. The MACD histogram shows negative momentum, indicating that selling pressure may be building. The Stochastic oscillator, with K=37.52 and D=38.11, signals a potential further decline. The ADX, at 14.08, indicates a weak trend, suggesting that the pair may be range-bound in the near term. Key support levels to watch on the 1-hour chart are 0.59158, 0.59089 and 0.59012. Resistance levels are 0.59304, 0.59381 and 0.5945. The overall signal for the 1H chart is SAT (Sell).
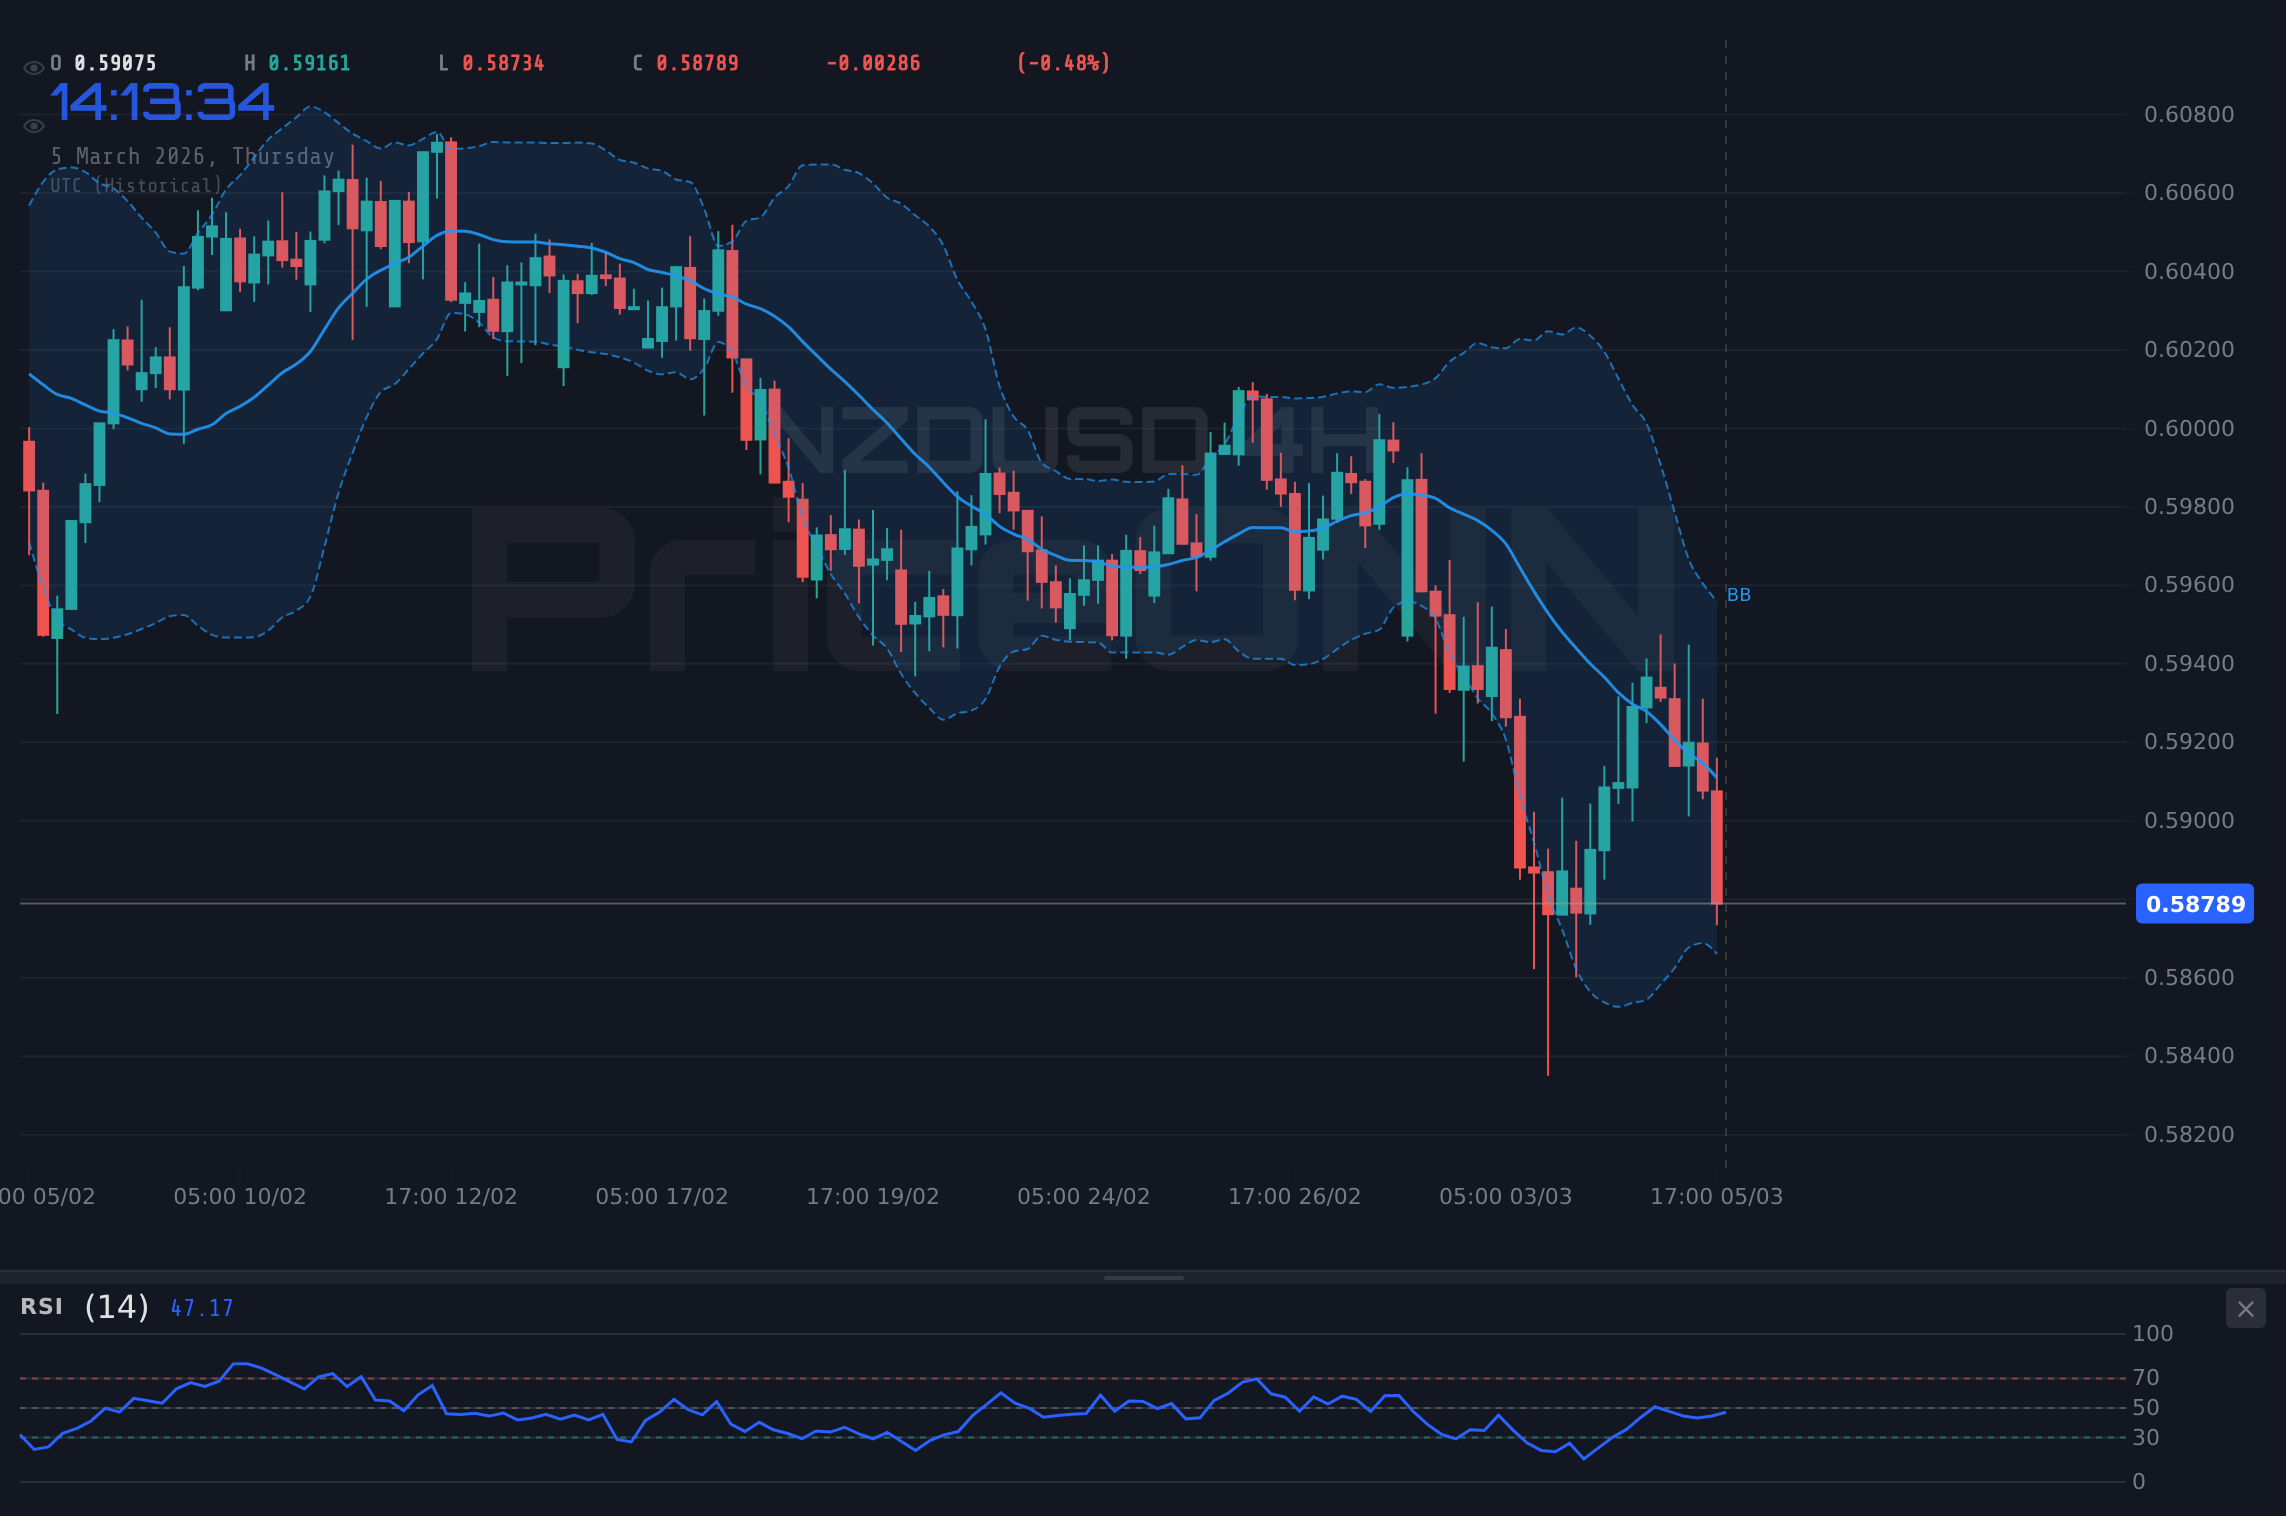
Stepping up to the 4-hour timeframe, the technical outlook remains bearish. The RSI(14) is at 42.96, still in neutral territory but trending downwards. The MACD histogram, while positive, shows signs of weakening, suggesting that bullish momentum may be fading. The Stochastic oscillator (K=58.77, D=76.96) indicates a potential pullback. The ADX, at 35.01, points to a strong downtrend. Key support levels on the 4-hour chart are 0.5899, 0.58782 and 0.58552, while resistance levels are 0.59428, 0.59658 and 0.59866. As indicated by the overall signal for the 4H chart which is SAT (Sell), a potential downside move may be in play. Having tracked NZDUSD through previous economic cycles, this setup feels familiar - a test of support followed by a potential breakdown.
Looking at the daily chart, the trend appears to be bullish. However, the RSI(14) is at 44.14, indicating that the pair is not overbought. The MACD histogram is negative, suggesting that buying momentum may be waning. The Stochastic oscillator (K=42.95, D=36.09) signals a potential upside move. The ADX, at 23.6, indicates a moderate downtrend. Support levels on the daily chart are 0.58839, 0.58314 and 0.58026, while resistance levels are 0.59652, 0.5994 and 0.60465. The overall signal for the 1D chart is SAT (Sell). Historically, when the daily chart shows this type of divergence, a period of consolidation or pullback often follows. The daily chart analysis indicates the need for caution. The overall trend still leans bullish, but the indicators suggest a loss of momentum.
The economic calendar is relatively light today, but traders should pay close attention to the upcoming PMI data from the US and New Zealand. Better-than-expected data from the US could further strengthen the dollar, while weak data from New Zealand could exacerbate the downside pressure on the Kiwi. On March 2nd (Monday), there were USD economic data releases. The market will likely be sensitive to these data points, especially given the current risk-off environment. It is also worth noting that WTI crude oil broke $78 amidst geopolitical tensions, which could put upward pressure on inflation expectations and influence central bank policy decisions.
NZDUSD Trading Strategy
Given the conflicting signals, a prudent nzdusd trading strategy would be to remain cautious and wait for further confirmation before initiating any new positions. A key level to watch is the 0.5900 level. A break below this level could signal further downside, while a sustained move above 0.5945 could indicate a potential bullish reversal. Scalpers might look for short-term opportunities within the established range, while swing traders may prefer to wait for a clear breakout or breakdown before entering a position.
NZDUSD breaks above the immediate resistance at 0.59304 and sustains a move above 0.5945. This could trigger a rally towards the next resistance levels at 0.59652 and 0.5994. The bullish scenario would be strengthened by positive PMI data from New Zealand and a weakening US dollar.
NZDUSD fails to hold support at 0.59158 and breaks below 0.5900. This could lead to a decline towards the next support levels at 0.58839 and 0.58314. The bearish scenario would be confirmed by strong US dollar and weak PMI data from New Zealand.
Trade Plan
Entry Trigger: Short position triggered on a confirmed break below 0.5900, with a retest of this level as resistance.
Target 1: 0.58839 (Daily support level)
Target 2: 0.58314 (Daily support level)
Stop/Invalidation Level: 0.5945 (Resistance level). This trade setup has a higher probability given the current market conditions and technical indicators. It's a high-probability setup (60-65%).
Traders should be aware of the upcoming PMI data releases, which could trigger significant volatility in NZDUSD. Manage your risk accordingly.
Frequently Asked Questions: NZDUSD Analysis
Is NZDUSD a good buy right now?
Given the current downtrend and neutral indicators, NZDUSD is not a strong buy right now. A more conservative approach would be to wait for a clear bullish signal, such as a break above 0.5945, before considering a long position.
What is the NZDUSD price forecast for this week?
The NZDUSD price forecast for this week is bearish, with a potential downside target of 0.58314 if support at 0.5900 breaks. However, a bullish reversal towards 0.5994 is possible if the pair can sustain a move above 0.5945.
What are the key support and resistance levels for NZDUSD?
Key support levels for NZDUSD are 0.59158, 0.58839 and 0.58314. Key resistance levels are 0.59304, 0.5945 and 0.59652.
Why is NZDUSD moving today?
NZDUSD is moving lower today due to a strengthening US dollar, driven by risk-off sentiment and geopolitical tensions. Additionally, traders are awaiting key PMI data releases, which could further influence the pair's direction.
Track markets in real-time
AI-powered analysis, technical indicators and real-time price data.
Join Our Telegram Channel
Breaking market news, AI analysis and trading signals instantly.
Join Channel