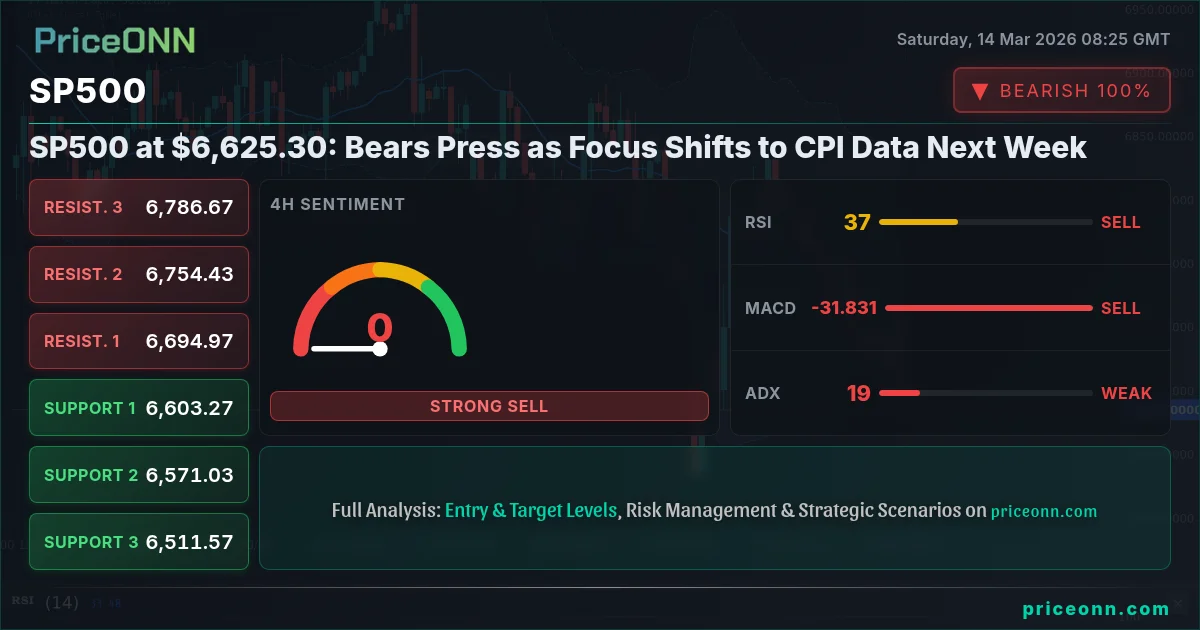
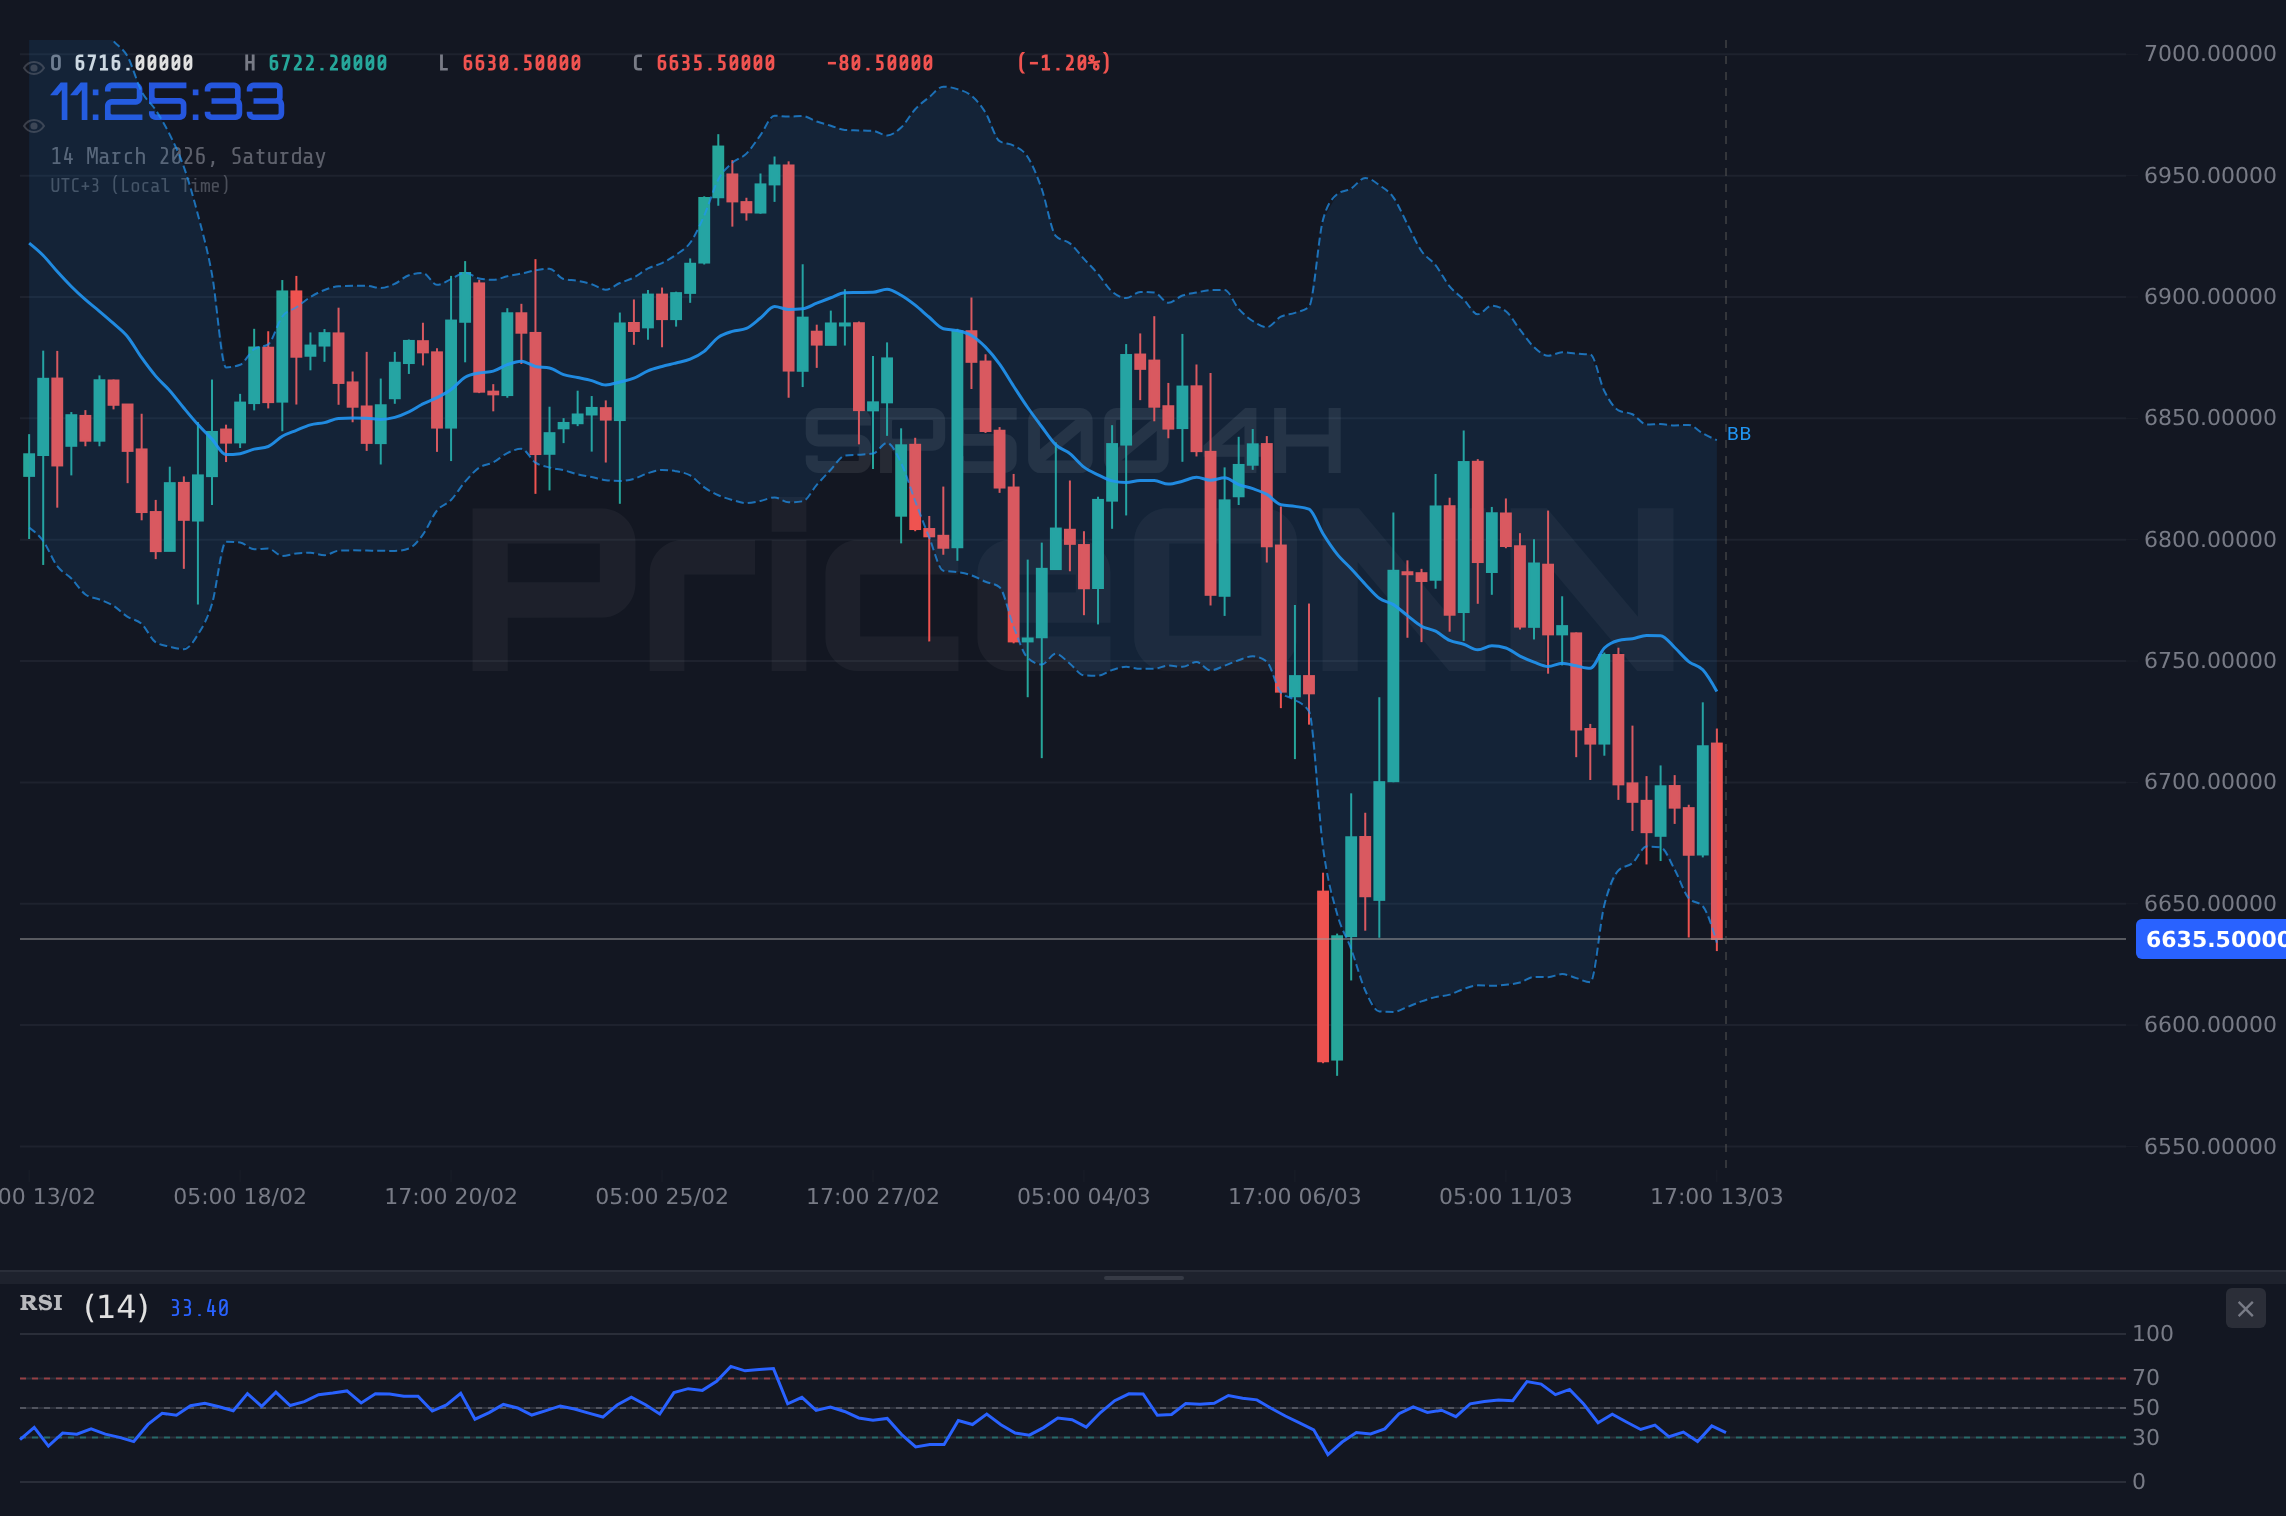
The SP500 is currently trading at $6,625.30, a decline of -0.81% on the day, as market participants brace for key economic data releases next week. The index is facing headwinds from a strengthening dollar and escalating geopolitical tensions, prompting a rotation into safe-haven assets. The primary focus is now on the upcoming CPI data, which could significantly influence the Federal Reserve's monetary policy decisions.
The Bull's Roadmap: A Recovery Above $6,742.23
For the bulls to regain control, the SP500 needs to decisively break above the $6,742.23 resistance level on the 4-hour chart. This would signal a shift in momentum and potentially pave the way for a retest of the recent highs. A successful breakout above $6,742.23 could target the $6,769.57 and $6,806.13 resistance levels, offering potential upside for intraday or swing traders. The RSI, currently at 37.5 on the 4-hour timeframe, needs to climb above 50 to confirm bullish momentum. This scenario would likely be driven by positive news flow or a dovish shift in Fed expectations.
However, this bullish scenario hinges on several factors. First, risk appetite needs to improve, which could be triggered by a de-escalation of geopolitical tensions or positive earnings reports. Second, the dollar needs to weaken, as a strong dollar typically puts downward pressure on equities. The DXY is currently at 100.2, and a move below 99.78 would be a positive sign for the SP500. Third, the upcoming CPI data needs to come in below expectations, which would ease concerns about inflation and potentially prompt the Fed to adopt a more cautious approach to rate hikes.
If these conditions are met, the SP500 could stage a significant recovery. However, it's important to manage risk and wait for confirmation before entering long positions. A break above $6,742.23 with increasing volume would be a strong signal that the bulls are back in control.
Where Bears Take Control: Breaking Below $6,614.43
The bears currently have the upper hand, as the SP500 is trading below its key moving averages and the MACD histogram is in negative territory. For the bearish scenario to play out, the SP500 needs to break below the $6,614.43 support level on the 1-hour chart. This would confirm the downtrend and potentially trigger a further sell-off. A break below $6,614.43 could target the $6,606.90 and $6,547.60 support levels on the daily chart, offering potential downside for intraday or swing traders. The ADX, currently at 24.69 on the 1-hour timeframe, indicates a moderate downtrend.
Several factors could contribute to a bearish outcome. First, the dollar could continue to strengthen, putting further pressure on equities. Second, geopolitical tensions could escalate, leading to increased risk aversion. Third, the upcoming CPI data could come in above expectations, which would reinforce concerns about inflation and potentially prompt the Fed to adopt a more hawkish approach to rate hikes. According to Reuters, Fed officials have emphasized that inflation remains "stubborn," suggesting that the central bank is prepared to take further action if necessary.
If these conditions are met, the SP500 could experience a significant decline. However, it's important to manage risk and wait for confirmation before entering short positions. A break below $6,614.43 with increasing volume would be a strong signal that the bears are in control.
The Waiting Game: Range-Bound Between $6,614.43 and $6,742.23
In the absence of a clear catalyst, the SP500 could remain range-bound between the $6,614.43 support and $6,742.23 resistance levels. This scenario would likely be characterized by choppy price action and indecision among market participants. The RSI, currently hovering around 35-40 on the shorter timeframes, suggests that the market is neither overbought nor oversold. The Stochastic oscillator, with K=8.97 and D=23.59, indicates a bearish signal on the 1H timeframe, but the 4H timeframe shows K>D.
Several factors could contribute to a range-bound environment. First, market participants may be waiting for the upcoming CPI data before making any significant moves. Second, geopolitical tensions may remain elevated, creating uncertainty and discouraging risk-taking. Third, earnings season may be relatively quiet, lacking any major catalysts to drive the market in either direction.
In this scenario, traders may focus on short-term trading strategies, such as buying at support and selling at resistance. However, it's important to be cautious and manage risk, as range-bound markets can be prone to sudden breakouts or breakdowns. Patience and discipline are key in this environment.
Most Likely Scenario: Bearish Momentum with a 50% Probability
Considering the current market conditions, the most likely scenario is a continuation of the bearish momentum, with an estimated probability of 50%. The strengthening dollar, elevated geopolitical tensions, and the potential for higher-than-expected CPI data all point to further downside risk for the SP500. The "sell" signal given by the moving averages supports this outlook. The SP500's intraday low of 6621.70 is a level to watch as a break below this could signal further weakness.
However, it's important to acknowledge the possibility of a bullish reversal or a range-bound environment. A dovish shift in Fed expectations or a de-escalation of geopolitical tensions could trigger a rally in the SP500. Similarly, a lack of any major catalysts could lead to a period of consolidation. The other scenarios have a 30% and 20% probability respectively.
Key Triggers to Watch This Week
Several key events and data releases could influence the SP500's price action this week. First and foremost, the upcoming CPI data will be closely watched for clues about the Fed's next move. A higher-than-expected reading could reinforce concerns about inflation and prompt the Fed to adopt a more hawkish stance, putting downward pressure on equities. Conversely, a lower-than-expected reading could ease concerns about inflation and potentially lead to a rally in the SP500.
Second, any developments in the geopolitical arena could also have a significant impact on the market. Escalating tensions could lead to increased risk aversion and a flight to safety, while a de-escalation could boost risk appetite and support equities. The fact that oil is nearing $100 per barrel due to Middle East tensions, according to recent reports, is a factor that cannot be ignored. Finally, any major earnings announcements or corporate news could also move the market. Traders should pay close attention to these triggers and adjust their positions accordingly.
| Scenario | Trigger | Target | Probability |
|---|---|---|---|
| Bullish | Break above $6,742.23 | $6,769.57 / $6,806.13 | 20% |
| Bearish | Break below $6,614.43 | $6,606.90 / $6,547.60 | 50% |
| Range-Bound | Stays between $6,614.43 and $6,742.23 | N/A | 30% |
Frequently Asked Questions: SP500 Analysis
What happens if SP500 breaks below $6,614.43 support?
If the SP500 breaks below the $6,614.43 support level, it could trigger a further sell-off, potentially targeting the $6,606.90 and $6,547.60 support levels on the daily chart. This breakdown would confirm the downtrend and suggest that the bears are in control.
Should I buy SP500 at current $6,625.30 levels given RSI at 34.97?
With the RSI at 34.97 on the 1-hour chart, the SP500 is not yet oversold, suggesting that there may be further downside potential. While a contrarian approach could be considered, it's prudent to wait for confirmation of a bullish reversal before entering long positions. A decisive break above $6,742.23 would be a more compelling buy signal.
Is the negative MACD signal a reliable indicator of further SP500 decline?
The negative MACD histogram does suggest that the SP500 is experiencing negative momentum, but it's important to consider other factors as well. The strength of the downtrend, as indicated by the ADX, and the overall market sentiment should also be taken into account. A confluence of bearish signals would increase the reliability of the MACD signal.
How will the upcoming CPI data affect SP500 this week?
The upcoming CPI data is a major catalyst that could significantly impact the SP500 this week. A higher-than-expected reading could reinforce concerns about inflation and prompt the Fed to adopt a more hawkish stance, putting downward pressure on equities. Conversely, a lower-than-expected reading could ease concerns about inflation and potentially lead to a rally in the SP500.
Track markets in real-time
AI-powered analysis, technical indicators and real-time price data.
Join Our Telegram Channel
Breaking market news, AI analysis and trading signals instantly.
Join Channel