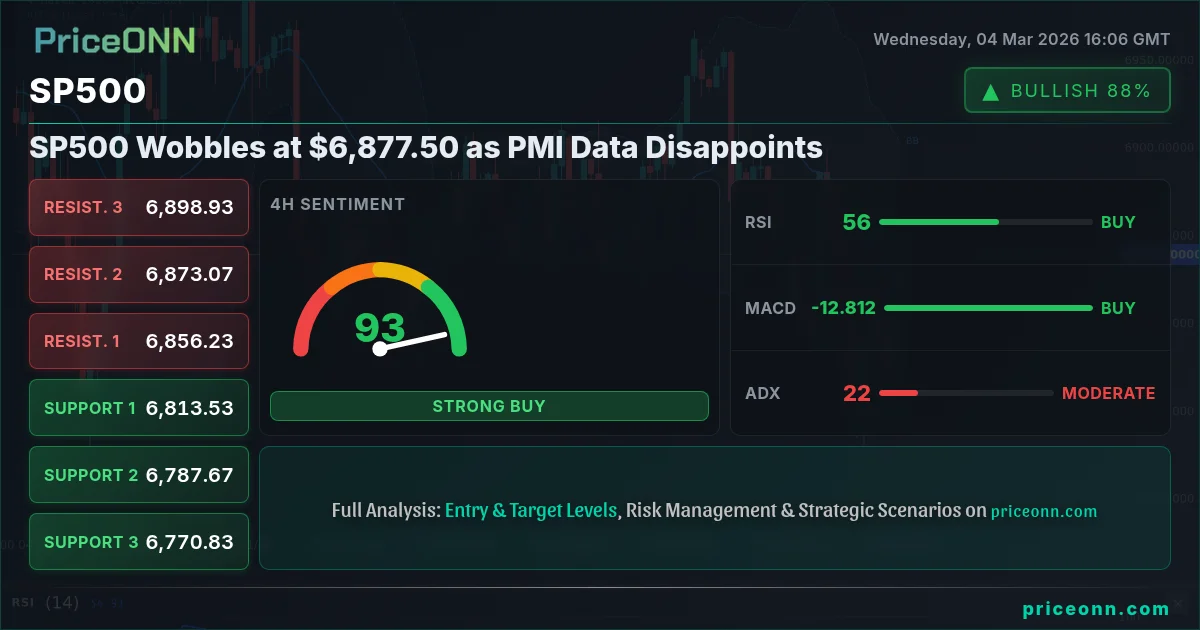
The S&P 500 finds itself in a precarious position, hovering around $6,877.50, as recent PMI data failed to provide the bullish catalyst many investors were hoping for. The initial optimism surrounding potential interest rate cuts by the Federal Reserve is now being tempered by concerns over slowing economic growth, creating a challenging environment for equity markets. This is where the SP500 today analysis becomes crucial, as traders seek to understand the short-term and medium-term trajectory of this key index.
- RSI at 49.44 signals neutral momentum, suggesting potential for further downside.
- Critical resistance is at 6,884, a level bulls need to reclaim to regain control.
- MACD histogram shows negative momentum, indicating bearish pressure.
- Weak PMI data is driving SP500 correlation with DXY as investors seek safe-haven assets.
The recent economic data releases have painted a mixed picture of the US economy. On one hand, inflation remains stubbornly above the Federal Reserve's target of 2%, which has led to a repricing of interest rate cut expectations. On the other hand, economic growth appears to be slowing, as evidenced by the latest PMI data. According to the economic calendar, the recent USD PMI data released on Monday and Wednesday has underperformed forecasts, adding to concerns about the strength of the US economy. The market had forecast 52.3, but the numbers came in lower. This combination of factors has created a challenging environment for the SP500, as investors grapple with the competing forces of inflation and economic growth.
From a technical perspective, the SP500 is currently trading in a precarious position. The daily chart shows a clear downtrend, with the index trading below its 50-day and 200-day moving averages. The RSI(14) is at 49.44, indicating neutral momentum but trending downward, suggesting potential for further downside. The MACD histogram is also showing negative momentum, further reinforcing the bearish outlook. Furthermore, the SP500 forecast 2026 hinges on these near-term factors. A break below key support levels could trigger a significant sell-off.
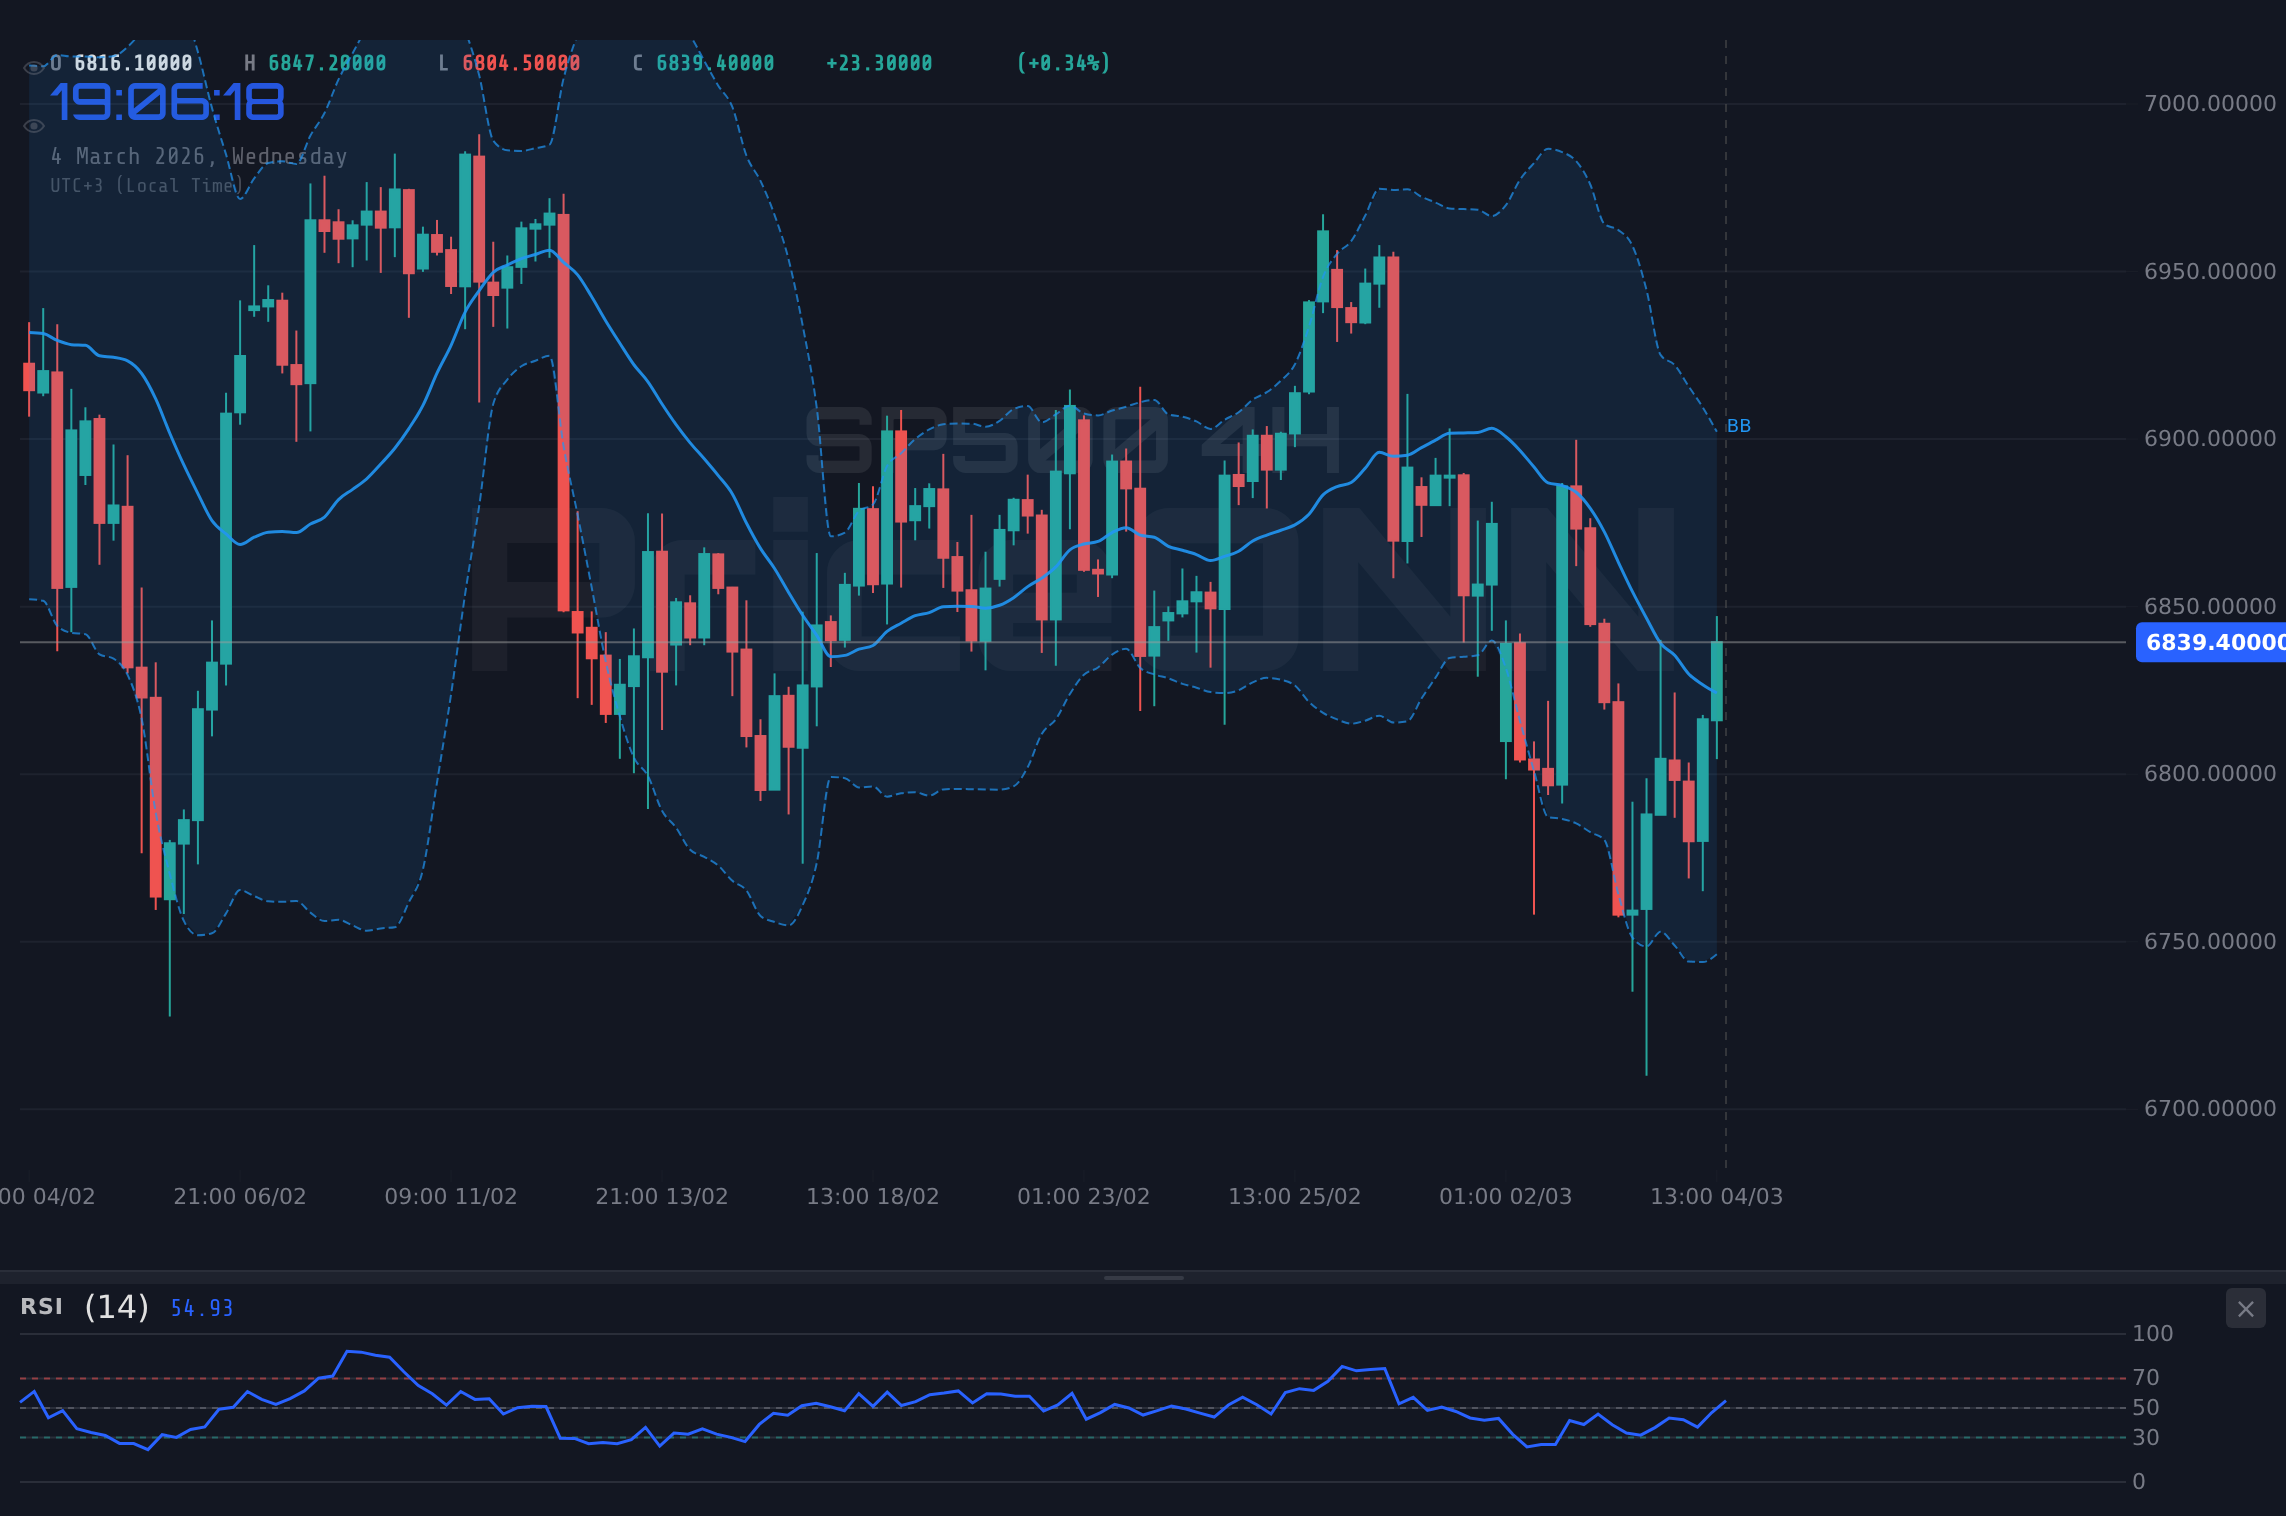
Looking at the hourly and 4-hourly charts, the SP500's bearish trend is gaining more clarity. The 1H chart shows that the SP500 is struggling to break past the 6,846.73 resistance. The RSI on the 1H chart is 66.75, which is still not in the overbought territory, but signaling a potential for selling pressure. The 4H chart shows the SP500 facing resistance at 6,834.37. The ADX on the 4H chart is at 22.46, showing a moderate downtrend. The Stochastic K=66.94, D=43.38 indicates a potential upward movement, but the overall trend leans towards selling pressure. The SP500 RSI and SP500 MACD signal are aligned, both pointing towards potential downside.
The SP500 support and resistance levels are crucial to watch. The first level of support is at 6,717.6, followed by 6,630.6 and 6,551.2. On the upside, the SP500 faces immediate resistance at 6,884, followed by 6,963.4 and 7,050.4. A break below the 6,717.6 support could trigger a sharp sell-off, while a sustained move above the 6,884 resistance would be needed to negate the bearish outlook. These SP500 key levels are crucial for traders to monitor.
The SP500 weekly outlook depends heavily on the upcoming economic data releases and the Federal Reserve's next policy decision. Traders should pay close attention to the SP500 news impact, as any surprises could trigger significant volatility. The SP500 market sentiment is currently bearish, but a positive catalyst could quickly shift the mood. The SP500 price forecast will largely depend on these factors.
The correlation between the SP500 and the DXY (Dollar Index) is also worth noting. With the DXY at 98.48, the SP500 is under pressure as a stronger dollar tends to weigh on equity prices. This inverse relationship is a key factor to consider when analyzing the SP500. The SP500 trading signals are mixed, but the overall technical picture suggests caution is warranted. The SP500 breakout is not yet confirmed, and traders should wait for a clear signal before committing to a directional trade.
The recent geopolitical tensions in the Middle East, particularly those involving the U.S., Iran, and Venezuela, are also creating significant volatility in the energy markets. As reported by Reuters, the uncertainty surrounding oil supplies has led to a spike in crude oil prices, which in turn has fueled concerns about inflation. This is putting further pressure on the Federal Reserve to maintain its hawkish stance, which is weighing on the SP500. The SP500 today analysis is incomplete without factoring in these external factors. The SP500 chart pattern recognition indicates that the index is currently in a downtrend, but a potential reversal could occur if these geopolitical tensions ease.
The ADX indicator on the daily timeframe is currently at 28.76, signaling a moderate downtrend. The indicator suggests that the SP500 trend analysis favors the bears. The multi-timeframe analysis reveals a mixed picture, with the hourly and 4-hourly charts showing bearish signals, while the daily chart is more neutral. The ADX on the 1H chart is 15.11, showing a weak trend, while the 4H chart shows an ADX of 22.46, signaling a moderate downtrend. This divergence in the ADX indicator highlights the importance of considering multiple timeframes when analyzing the SP500.
SP500 Trade Plan
Considering the technical and fundamental factors, a short trade setup can be defined as follows:
SP500 fails to break above 6,884 resistance and continues its downtrend. Targets are 6,717.6 and 6,630.6, with potential for further downside if support levels are breached.
SP500 breaks above 6,884 resistance and sustains its move, targeting 6,963.4 and 7,050.4. This scenario is less probable given the current market conditions.
Given the bearish setup, a 60% probability is assigned to the bearish scenario, while a 40% probability is assigned to the bullish scenario. A risk warning is issued due to the upcoming economic data releases, which could trigger significant volatility. The SP500 trading signals must be monitored closely.
Key Levels
Support Levels
Resistance Levels
Technical Outlook Summary
| Indicator | Value | Signal |
|---|---|---|
| RSI (14) | 49.44 | Neutral |
| MACD Histogram | Negative | Bearish |
| Stochastic | 52.35 | Bearish |
| ADX | 28.76 | Strong Downtrend |
| Bollinger | Middle Band | Watch |
Frequently Asked Questions: SP500 Analysis
Is SP500 a good buy right now?
Given the current economic uncertainty and bearish technical signals, SP500 is not an ideal buy right now. The price is at $6,877.50, and a break below the 6,717.6 support could trigger further downside. It's best to wait for a clear bullish signal before considering a long position.
What is the SP500 price forecast for this week?
The SP500 price forecast for this week is cautiously bearish. The index is likely to test the 6,717.6 support, and a break below this level could lead to a further decline towards 6,630.6. The probability of a sustained rally above 6,884 is low given the current market conditions.
What are the key support and resistance levels for SP500?
Key support levels for SP500 are 6,717.6, 6,630.6, and 6,551.2. Key resistance levels are 6,884, 6,963.4, and 7,050.4. A break below the support levels could trigger a sharp sell-off, while a sustained move above the resistance levels would be needed to negate the bearish outlook.
Why is SP500 moving today?
SP500 is moving today due to disappointing PMI data, which has fueled concerns about slowing economic growth. Additionally, the stronger dollar (DXY at 98.48) is putting pressure on equity prices. The SP500 market sentiment is currently bearish.
Track markets in real-time
AI-powered analysis, technical indicators and real-time price data.
Join Our Telegram Channel
Breaking market news, AI analysis and trading signals instantly.
Join Channel