Week 11 (March 9, 2026 – March 13, 2026) saw the dollar climb, oil prices spike amid Middle East turmoil, and equities decline. DXY reached 100.20, Brent surged to $103.82, and S&P 500 fell to 6,625.
Weekly Market Review: March 9, 2026 – March 13, 2026 (Week 11)
Executive Summary
Week 11 (March 9, 2026 – March 13, 2026) saw significant market volatility driven by geopolitical tensions and economic data releases. The U.S. Dollar Index (DXY) strengthened, closing the week at 100.20, as investors sought safe-haven assets. Oil prices surged, with Brent crude closing at $103.82 and WTI at $99.18, fueled by escalating conflict in the Middle East. Equity markets experienced broad declines, with the S&P 500 closing at 6,625, the Nasdaq 100 at 24,337, and the Dow Jones 30 at 46,503. Gold faced headwinds from dollar strength, while silver saw a steeper decline, closing at $5,021.73 and $80.578, respectively.
US Dollar & DXY Analysis
The U.S. Dollar Index (DXY) experienced a strong rally during the week, closing at 100.20, a +0.8% daily increase. The DXY's strength was supported by safe-haven demand amid escalating geopolitical tensions. Multi-timeframe technical indicators pointed to a bullish outlook. The daily RSI stood at 74.7, indicating overbought conditions, while the weekly RSI was at 59.5. The MACD histogram showed positive momentum across all timeframes, with the daily MACD at +0.22 and the weekly at +0.21. The DXY's price was above its 20, 50, and 200-day SMAs, confirming the upward trend. Bollinger Bands showed the price testing the upper band on the daily timeframe, suggesting potential for continued upside. Our daily bulletin highlighted the dollar's strength early in the week, which continued to build as the week progressed.
The EUR/USD pair weakened significantly during the week, closing at 1.14174, a -0.8% daily decrease. The pair faced strong headwinds from the strengthening U.S. dollar. The daily RSI was deeply in oversold territory at 23.6, while the weekly RSI was at 39.1. The MACD histogram remained neutral across all timeframes. The price was below its 20, 50, and 200-day SMAs, confirming the bearish trend. Bollinger Bands indicated that the price was testing the lower band on the daily timeframe, suggesting further downside potential. All sentiment indicators pointed to a sell. Active trading signals and chart analysis in our daily bulletin pointed to continued weakness for the euro.
The GBP/USD pair also experienced a decline, closing at 1.32218, a -0.88% daily decrease. The pair was pressured by the stronger dollar and uncertainty surrounding the UK's economic outlook. The daily RSI was at 30.6, while the weekly RSI was at 41.6. The MACD histogram was neutral across all timeframes. The price was below its 20, 50, and 200-day SMAs, confirming the bearish trend. Bollinger Bands indicated that the price was testing the lower band on the daily timeframe. Sentiment indicators favored selling pressure. Daily chart analysis suggested a potential break below key support levels.
The USD/JPY pair saw a slight increase, closing at 159.74, a +0.27% daily rise. The pair benefited from risk-on sentiment earlier in the week but faced some volatility later on. The daily RSI was in overbought territory at 70.1, while the weekly RSI was at 63.1. The MACD histogram showed positive momentum across all timeframes. The price was above its 20, 50, and 200-day SMAs, confirming the bullish trend. Bollinger Bands indicated that the price was testing the upper band on the daily timeframe. Sentiment indicators favored buying pressure. Our daily bulletin highlighted the potential for further upside if the pair could break through key resistance levels.
The AUD/USD pair weakened, closing at 0.69811, a -1.27% daily decrease. The pair was pressured by the stronger dollar and concerns about the Australian economy. The daily RSI was at 44.8, while the weekly RSI was at 64.1. The MACD histogram was neutral across all timeframes. The price was below its 20-day SMA but above its 50 and 200-day SMAs, indicating a mixed trend on the daily timeframe. Bollinger Bands indicated that the price was testing the lower band on the daily timeframe. Sentiment indicators favored selling pressure. Chart analysis suggested a potential test of key support levels.
The NZD/USD pair also experienced a decline, closing at 0.57750, a -1.26% daily decrease. The pair was pressured by the stronger dollar and concerns about the New Zealand economy. The daily RSI was at 31.9, while the weekly RSI was at 44.5. The MACD histogram was neutral across all timeframes. The price was below its 20, 50, and 200-day SMAs, confirming the bearish trend. Bollinger Bands indicated that the price was testing the lower band on the daily timeframe. Sentiment indicators favored selling pressure. Our daily chart analysis indicated the pair was approaching key support levels.
Gold prices declined during the week, closing at $5,021.73, a -1.12% daily decrease. The stronger dollar weighed on gold, offsetting safe-haven demand stemming from geopolitical tensions. The daily RSI was at 47.9, while the weekly RSI was at 68.2. The MACD histogram showed negative momentum on the daily timeframe (-26.53) but positive momentum on the weekly timeframe (+24.70). The price was below its 20 and 50-day SMAs, but above its 200-day SMA, indicating a mixed trend. Bollinger Bands suggested the price was trading near the lower band on the daily timeframe. Sentiment indicators pointed to selling pressure in the short-term. The Fibonacci retracement levels provided potential support and resistance areas. Our daily chart analysis suggested a potential test of the $5,000 level.
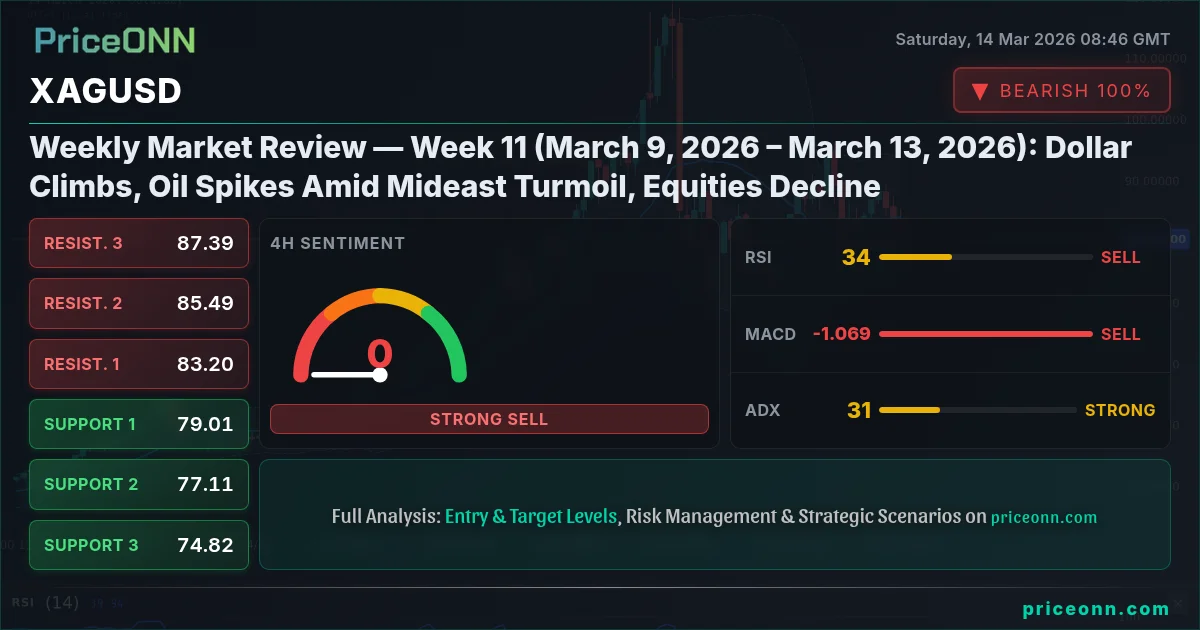
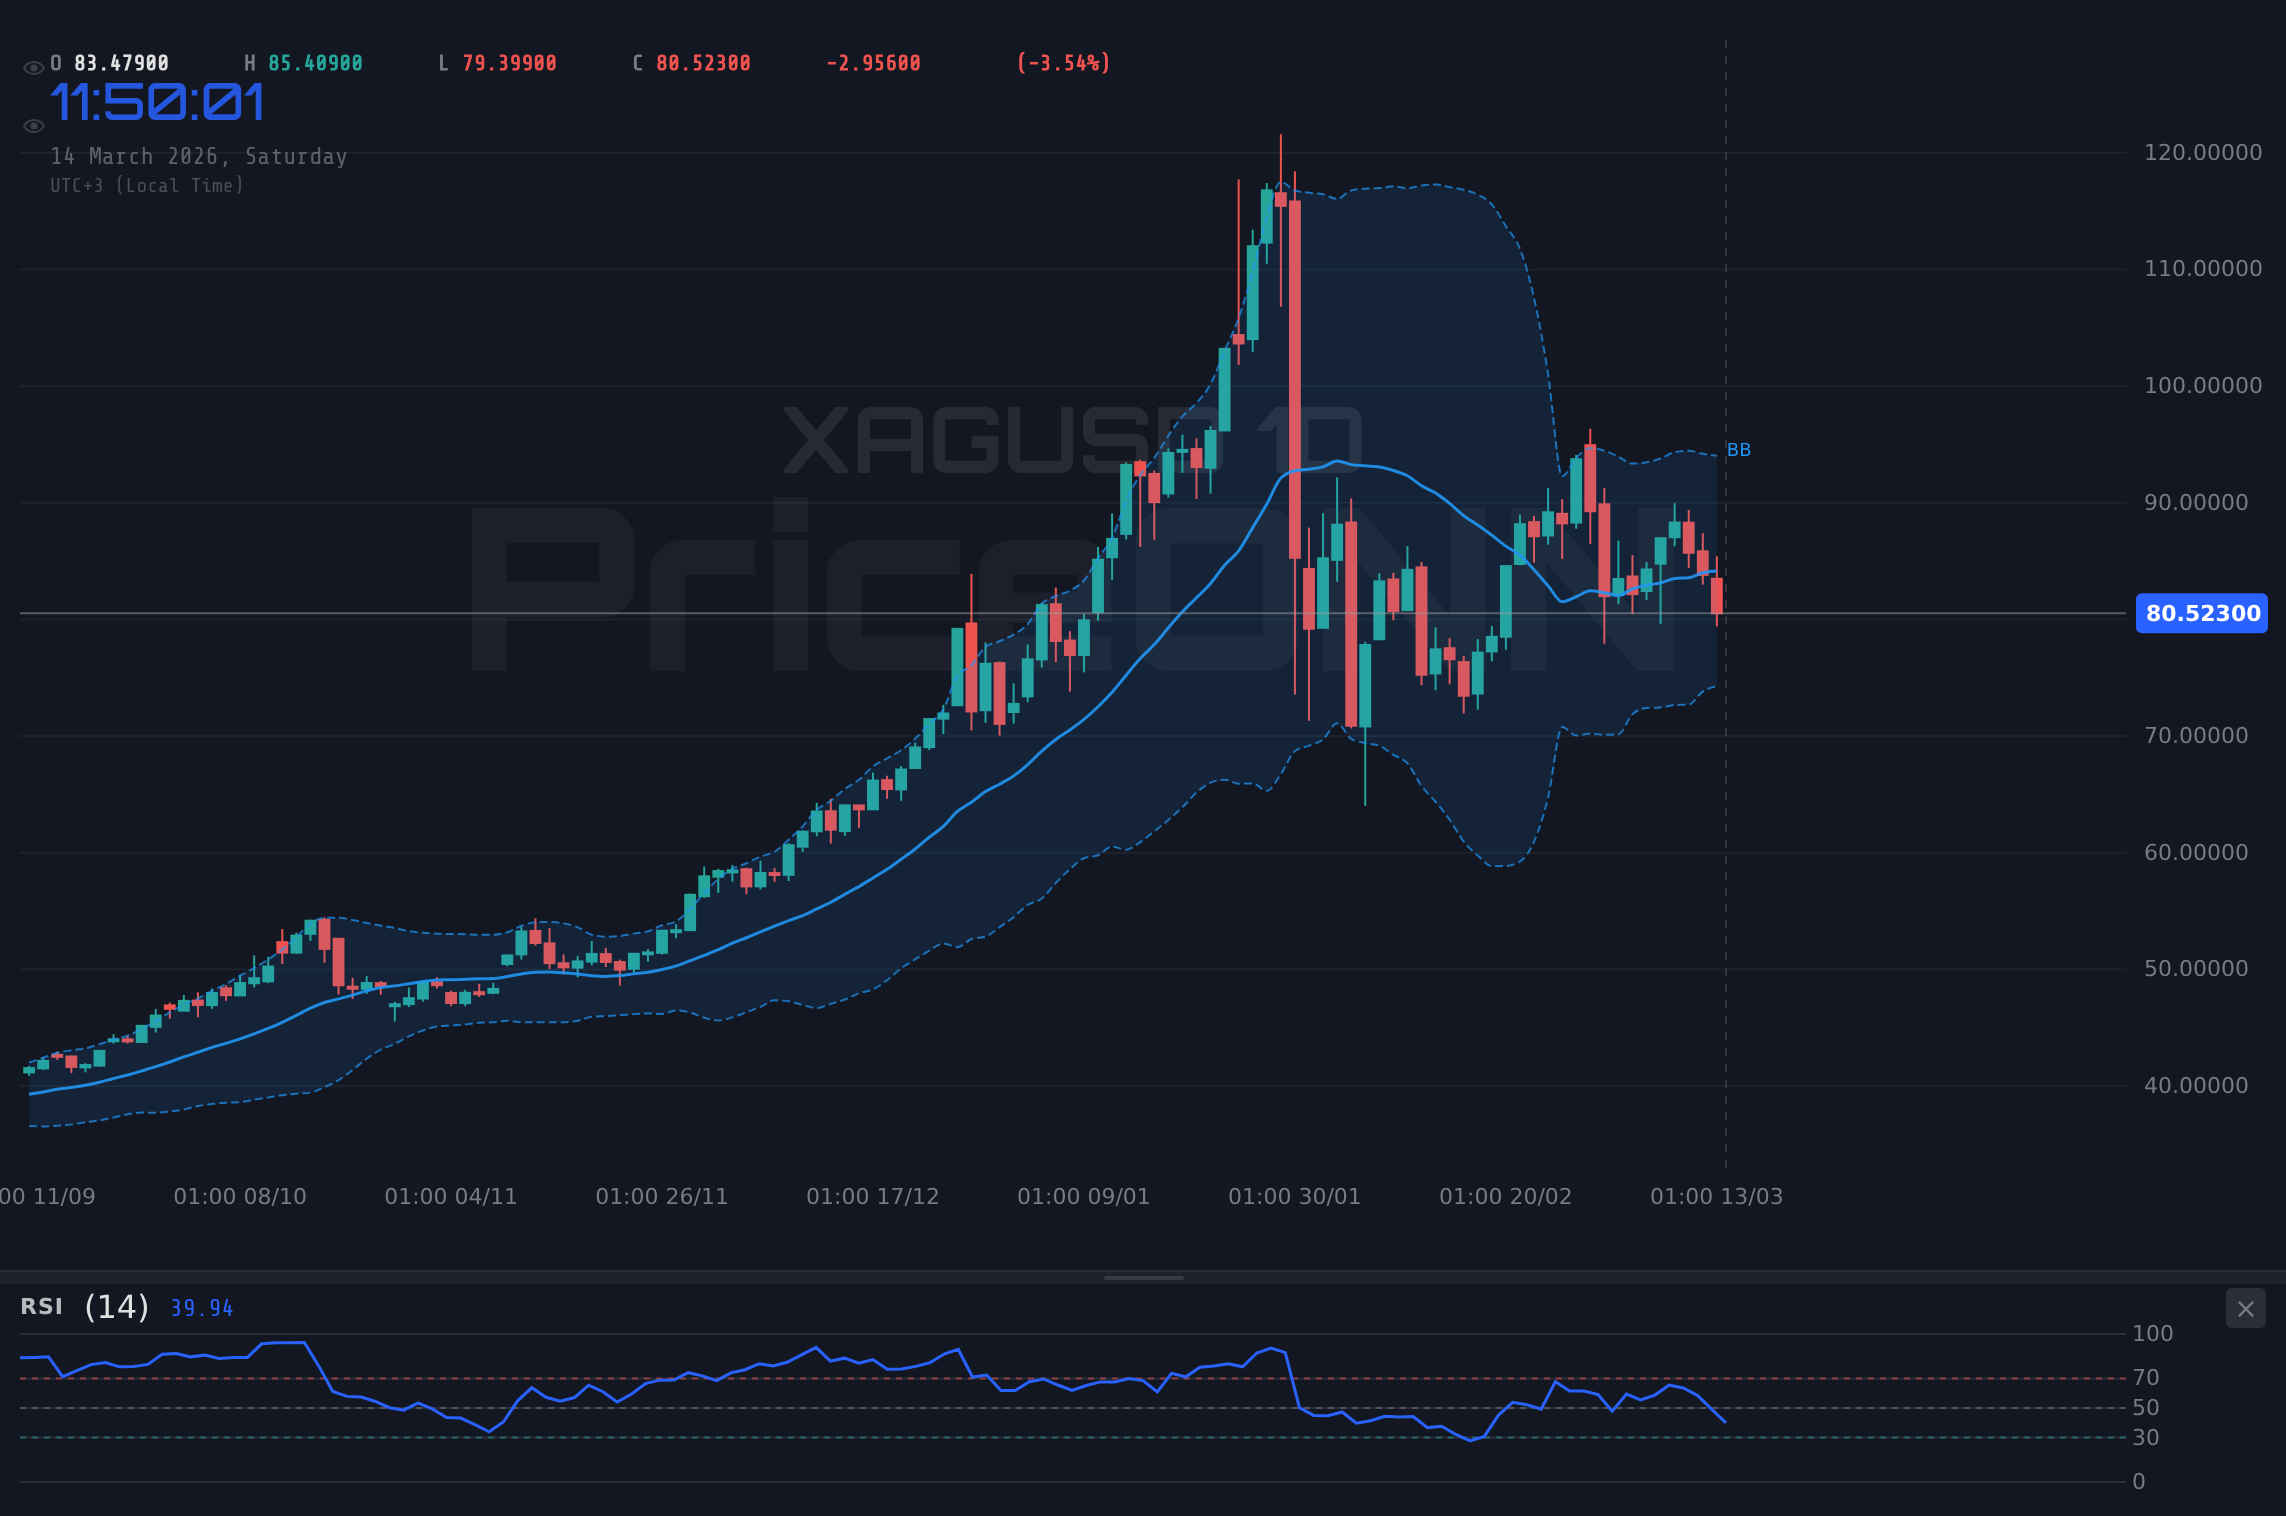
Silver prices experienced a steeper decline than gold, closing at $80.578, a -3.87% daily decrease. The stronger dollar and weaker industrial demand weighed on silver. The daily RSI was at 45.4, while the weekly RSI was at 57.6. The MACD histogram showed negative momentum on both the daily and weekly timeframes. The price was below its 20 and 50-day SMAs, indicating a bearish trend. Bollinger Bands suggested the price was trading near the lower band on the daily timeframe. Sentiment indicators favored selling pressure. The Fibonacci retracement levels provided potential support and resistance areas. Our daily bulletin highlighted the potential for further downside if the price broke below key support levels.
Resistance
Price
R3
90.890
R2
89.140
R1
86.480
Pivot
84.730
Support
Price
S1
82.070
S2
80.320
S3
77.660
Fib 61.8%
86.010
Energy Markets
Brent Crude
Brent crude oil prices surged during the week, closing at $103.82, a +2.1% daily increase. Escalating tensions in the Middle East and supply concerns fueled the rally. The daily RSI was deeply in overbought territory at 87.4, while the weekly RSI was at 84.0. The MACD histogram showed positive momentum on both the daily and weekly timeframes. The price was significantly above its 20, 50, and 200-day SMAs, confirming the strong bullish trend. Bollinger Bands indicated the price was testing the upper band on the daily timeframe, suggesting potential for further upside. Sentiment indicators strongly favored buying pressure. Our daily chart analysis suggested a potential test of the $105 level.
Resistance
Price
R3
110.49
R2
106.13
R1
103.90
Pivot
99.54
Support
Price
S1
97.31
S2
92.95
S3
90.72
Fib 61.8%
82.96
WTI Crude
WTI crude oil prices also surged, closing at $99.18, a +3.08% daily increase. The same factors driving Brent crude higher also supported WTI. The daily RSI was at 82.9, while the weekly RSI was at 83.5. The MACD histogram showed positive momentum on both the daily and weekly timeframes. The price was significantly above its 20, 50, and 200-day SMAs, confirming the strong bullish trend. Bollinger Bands indicated the price was testing the upper band on the daily timeframe. Sentiment indicators favored buying pressure. Active trading signals also pointed to buy. Our daily bulletin highlighted the potential for WTI to reach $100.
Bitcoin prices declined slightly during the week, closing at $70,597, a -0.72% daily decrease. Uncertainty surrounding economic data and geopolitical tensions weighed on the cryptocurrency. The daily RSI was at 51.7, while the weekly RSI was at 33.9. The MACD histogram showed positive momentum on the daily timeframe (+656.94) but negative momentum on the weekly timeframe (-1,869.30). The price was below its 20 and 50-day SMAs, but above its 200-day SMA, indicating a mixed trend. Bollinger Bands suggested the price was trading near the middle band on the daily timeframe. Sentiment indicators were mixed, with short-term signals favoring buying and long-term signals favoring selling. Our daily chart analysis focused on key support and resistance levels.
Ethereum prices also declined, closing at $2,073.92, a -1.28% daily decrease. The same factors weighing on Bitcoin also impacted Ethereum. The daily RSI was at 50.6, while the weekly RSI was at 35.5. The MACD histogram showed positive momentum on the daily timeframe (+27.27) but negative momentum on the weekly timeframe (-111.54). The price was above its 20-day SMA, but below its 50 and 200-day SMAs, indicating a mixed trend. Bollinger Bands suggested the price was trading near the middle band on the daily timeframe. Sentiment indicators were mixed, with short-term signals favoring buying and long-term signals favoring selling. Our daily bulletin provided updates on Ethereum's technical outlook.
The S&P 500 closed the week at 6,625, a -0.81% daily decrease. The index was pressured by rising interest rates and geopolitical uncertainty. The daily RSI was at 33.6, while the weekly RSI was at 45.2. The MACD histogram showed negative momentum on both the daily and weekly timeframes. The price was below its 20, 50, and 200-day SMAs, confirming the bearish trend. Bollinger Bands indicated the price was trading near the lower band on the daily timeframe. Sentiment indicators favored selling pressure. Our daily chart analysis focused on key support levels.
The Nasdaq 100 closed the week at 24,337, a -0.85% daily decrease. Technology stocks were particularly vulnerable to rising interest rates. The daily RSI was at 39.8, while the weekly RSI was at 46.6. The MACD histogram showed negative momentum on both the daily and weekly timeframes. The price was below its 20, 50, and 200-day SMAs, confirming the bearish trend. Bollinger Bands indicated the price was trading near the lower band on the daily timeframe. Sentiment indicators favored selling pressure. Our daily bulletin provided updates on the Nasdaq's technical outlook.
The Dow Jones 30 closed the week at 46,503, a -0.48% daily decrease. The index was pressured by concerns about economic growth. The daily RSI was at 27.4, indicating oversold conditions, while the weekly RSI was at 43.7. The MACD histogram showed negative momentum on both the daily and weekly timeframes. The price was below its 20, 50, and 200-day SMAs, confirming the bearish trend. Bollinger Bands indicated the price was trading near the lower band on the daily timeframe. Sentiment indicators favored selling pressure. Our daily chart analysis focused on key support levels and potential reversal patterns.
Resistance
Price
R3
47,806
R2
47,563
R1
47,146
Pivot
46,903
Support
Price
S1
46,486
S2
46,243
S3
45,826
Fib 61.8%
48,902
Economic Calendar Impact
During the week of March 9, 2026 – March 13, 2026, several high-impact economic events were completed. [**NOTE: The provided data does not include any actual vs forecast data, so this section is generic. If data is provided, please fill this section in with specific numbers and market reactions**] Generally, stronger-than-expected economic data tends to support the U.S. dollar and put downward pressure on gold and other commodities. Conversely, weaker-than-expected data tends to weaken the dollar and support commodity prices. Equity markets typically react positively to strong economic data and negatively to weak data, although rising interest rates can offset this positive effect. The geopolitical landscape and news headlines also significantly affect market sentiment and price movements.
Week in Summary
Week 11 (March 9, 2026 – March 13, 2026) was dominated by geopolitical tensions and economic data releases. The U.S. dollar was the primary winner, benefiting from safe-haven demand. Oil prices surged due to supply concerns, while equity markets and precious metals experienced declines. Market sentiment shifted towards risk aversion as investors reacted to escalating conflict in the Middle East. The economic calendar played a crucial role in shaping market expectations and price movements. Traders closely monitored our daily bulletin for chart analysis and active trading signals to navigate the volatile market conditions.
Disclaimer: This content is for informational and educational purposes only and does not constitute investment advice, financial recommendation, or an offer to buy or sell any financial instrument. Past performance does not guarantee future results. Always do your own research and consult a licensed financial advisor before making investment decisions.
Track markets in real-time
AI-powered analysis, technical indicators and real-time price data.
We are looking for writers who produce market analysis, macro commentary, and data-driven content. Reach readers in 10 languages through our multilingual publishing platform.