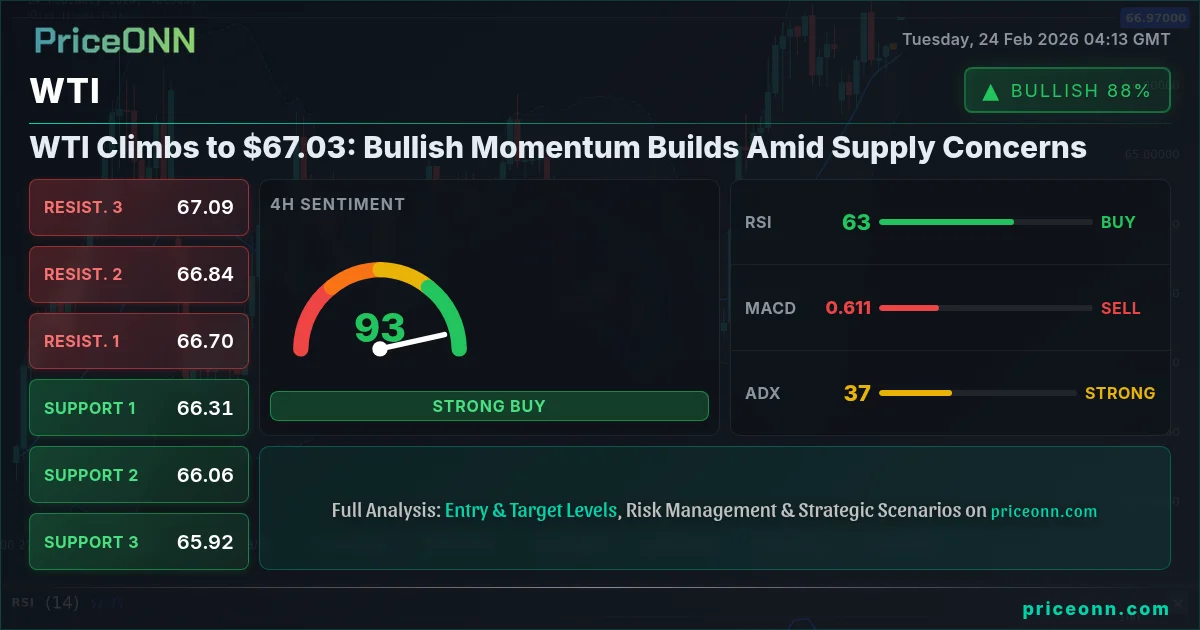
WTI Climbs to $67.03: Bullish Momentum Builds Amid Supply Concerns
WTI crude oil reaches $67.03, fueled by rising concerns over global supply disruptions. Technical indicators suggest further upside potential as bullish momentum strengthens.
Crude oil prices are on the rise, driven by a confluence of factors ranging from geopolitical tensions to tightening supply forecasts. As WTI crude oil climbs to $67.03, traders are closely monitoring both fundamental and technical indicators to gauge the sustainability of this bullish momentum. The interplay between these elements will likely determine the direction of oil prices in the coming weeks.
- RSI at 71.16 on the 1H chart signals overbought conditions, potentially leading to a short-term pullback.
- Key support sits at $66.31, tested multiple times on the hourly timeframe.
- MACD on the daily chart shows positive momentum, indicating a continuation of the upward trend.
- Geopolitical tensions and supply concerns are driving WTI's correlation with the DXY (Dollar Index).
Geopolitical Tensions and Supply Concerns Fueling the Rally
The current surge in WTI prices is largely attributed to growing concerns over global oil supply. According to Reuters, recent geopolitical events in key oil-producing regions have raised the specter of potential disruptions. These concerns are compounded by ongoing production cuts from OPEC+ nations, which are designed to tighten supply and support prices. The market is keenly aware that any further escalation of these tensions could lead to a significant spike in crude oil prices. This macro hook is what's driving the price action, overshadowing typical demand-side considerations for now.
Investors are also factoring in the potential impact of these supply constraints on inflation. Crude oil is a key input in many industries, and higher oil prices can translate into increased costs for businesses and consumers alike. This inflationary pressure could, in turn, prompt central banks to adopt a more hawkish stance on monetary policy. With the DXY currently at 97.53, a stronger dollar could usually put downward pressure on oil, but the supply-side narrative is overpowering that effect for now.
Technical Confirmation of Bullish Momentum
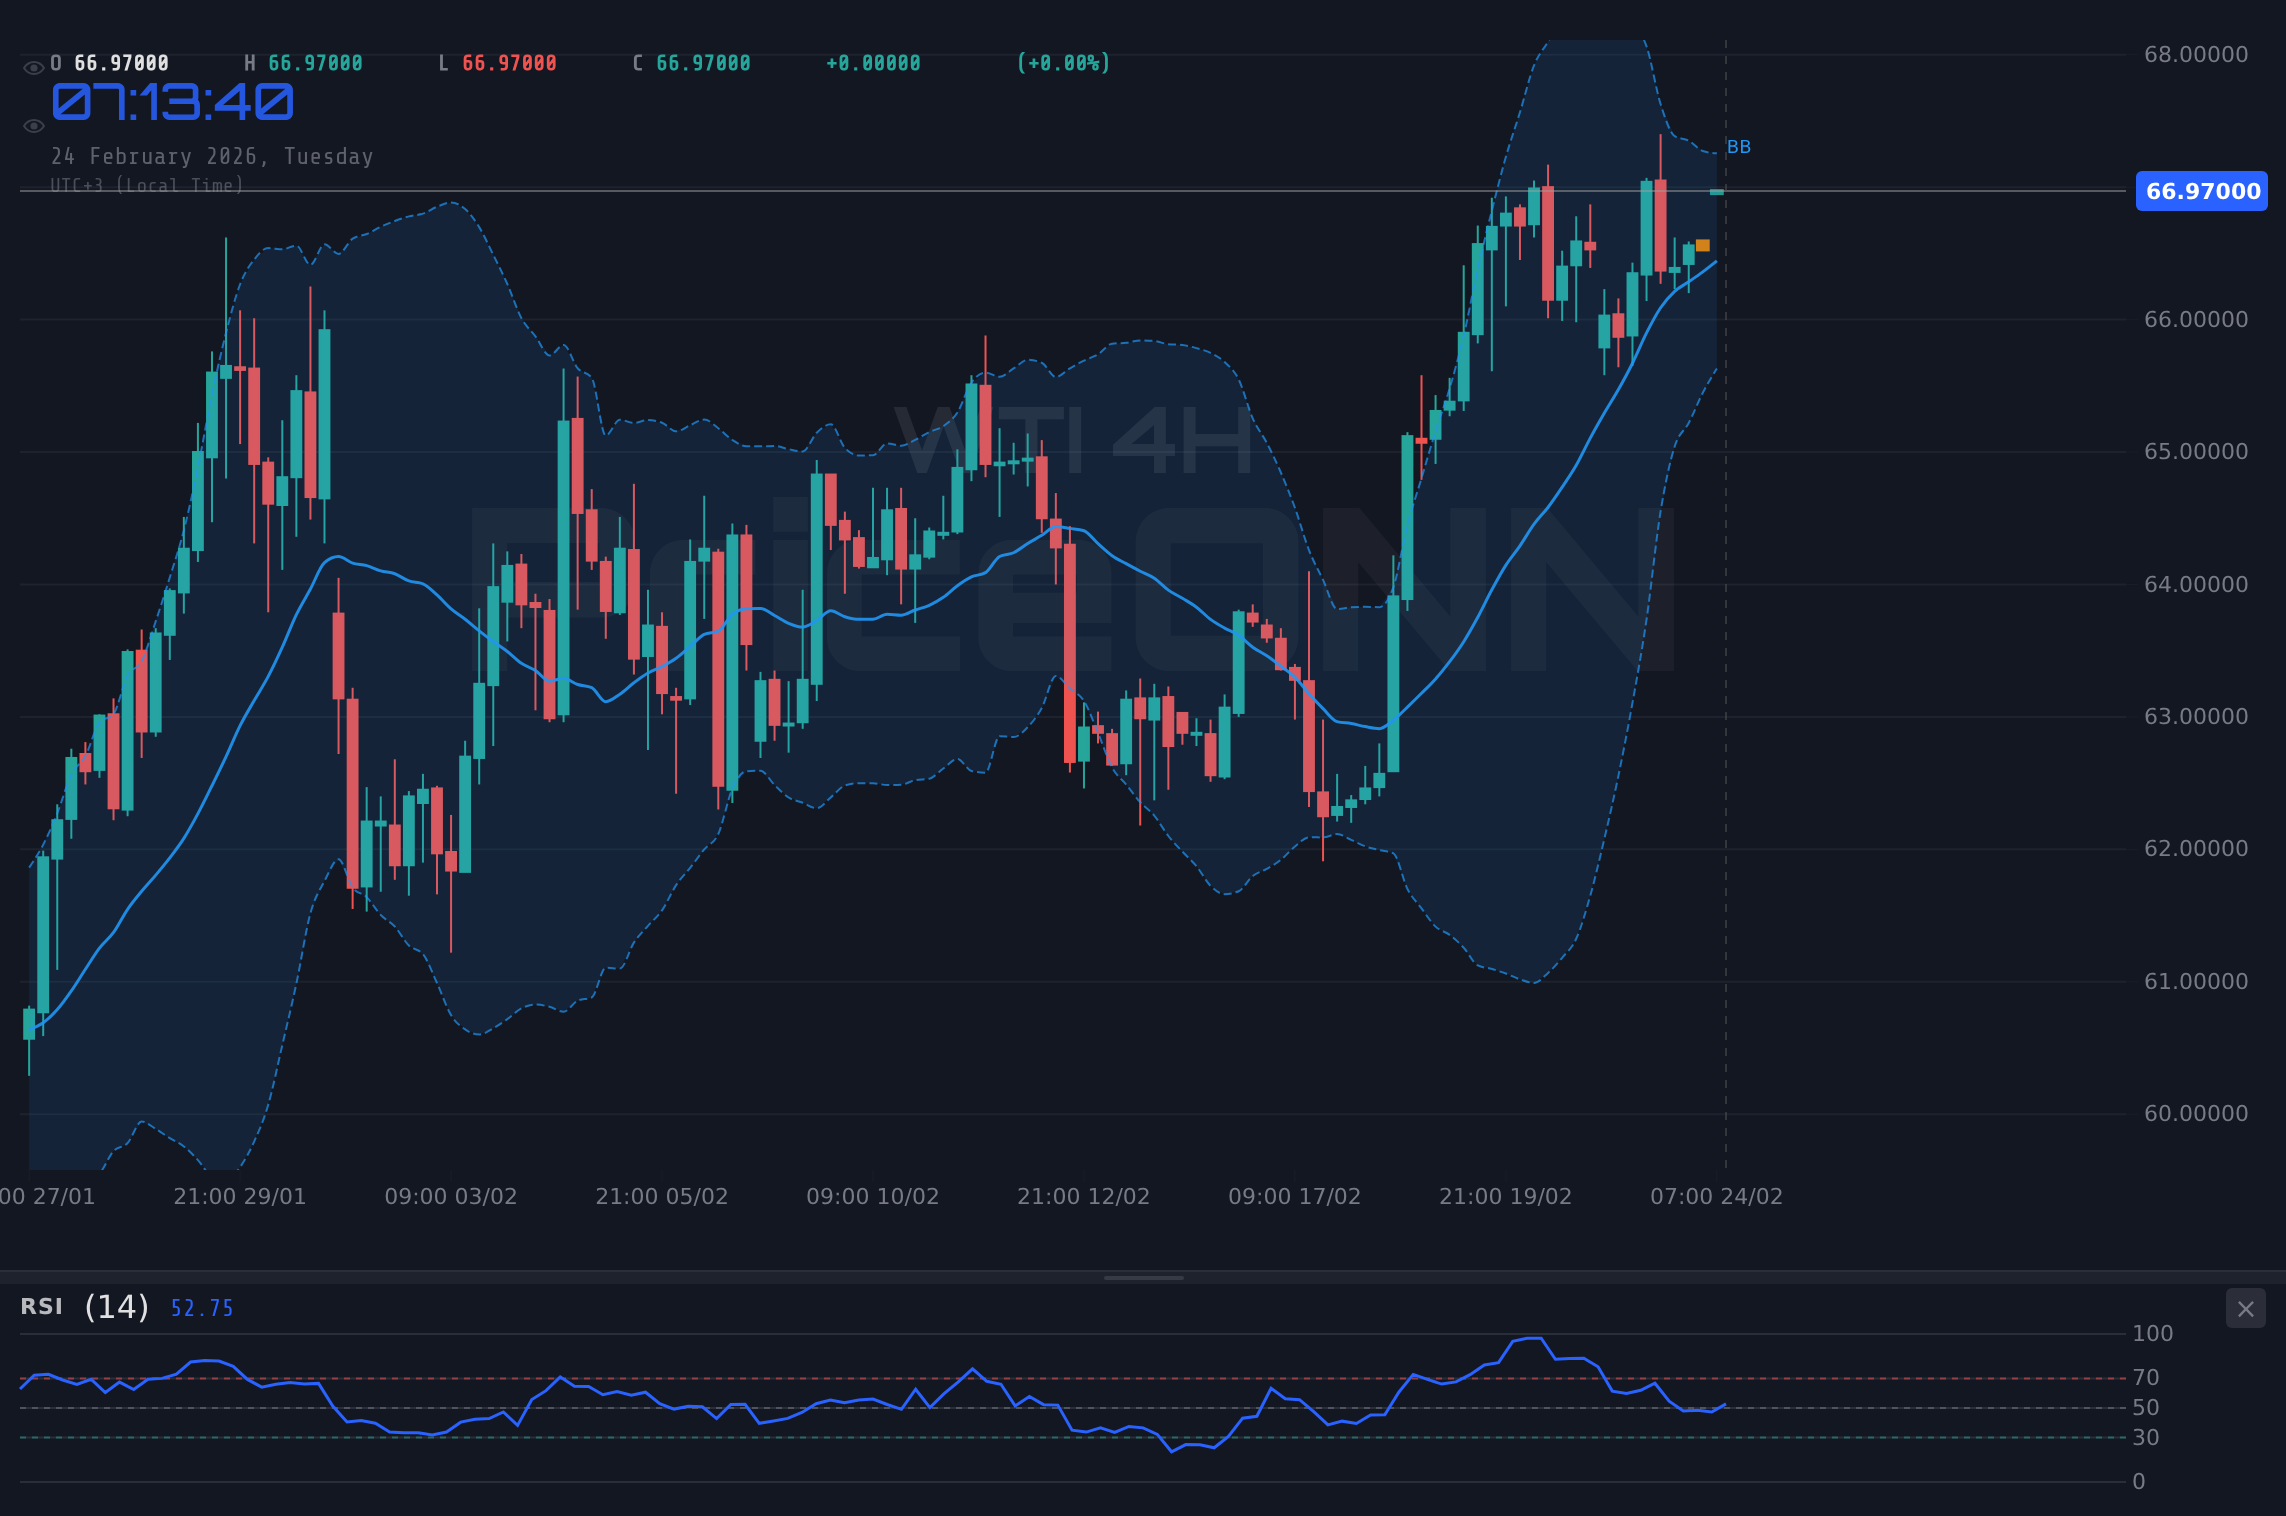
While the fundamental drivers are undoubtedly playing a significant role in the current WTI rally, technical indicators also suggest that bullish momentum is building. On the 1-day timeframe, WTI exhibits an upward trend with 89% strength. The RSI(14) stands at 59.99, residing in neutral territory, suggesting room for further gains. The MACD is also exhibiting positive momentum, further reinforcing the bullish outlook. However, traders should be mindful of the Stochastic indicator, which signals a potential downturn as %K (54.52) falls below %D (58.52).
Zooming into the 4-hour timeframe, the upward trend remains intact with a strength of 82%. The RSI(14) is at 62.33, also in neutral territory, while the MACD continues to show positive momentum. The Stochastic indicator, with %K at 68.29 and %D at 44.75, supports the bullish momentum. However, the ADX at 13.59 indicates a weak trend, suggesting that the rally may lack conviction and could be prone to pullbacks.
Shorter-term traders should also pay close attention to the hourly chart. Although the overall trend is neutral, the RSI(14) is showing a value of 71.16, placing it in overbought territory. The Stochastic indicator is also in overbought territory, with %K at 90.49 and %D at 81.87. These overbought conditions suggest that the rally may be due for a pause or even a reversal. The hourly ADX sits at 19.03, also indicating a weak trend. This is exactly where patience is needed, waiting for the right setup.
Key Levels to Watch
Identifying key support and resistance levels is crucial for managing risk and identifying potential entry and exit points. According to the current data, immediate resistance for WTI lies at $67.33 on the daily chart. A break above this level could open the door for further gains towards $68.28 and $69.15. On the downside, initial support can be found at $65.51. A break below this level could lead to a test of $64.64 and $63.69.
On the 4-hour timeframe, traders should watch the resistance levels at $66.60, $66.80 and $66.99. Key support can be found at $66.21, $66.02 and $65.82. A break of these levels could signal a shift in momentum and provide opportunities for short-term trades. The hourly chart provides additional levels to monitor. Resistance sits at $66.70, $66.84 and $67.09, with support at $66.31, $66.06 and $65.92.
WTI Trade Plan: Riding the Bullish Wave
Given the prevailing bullish momentum and the strength of the underlying fundamental drivers, a long trading strategy may be warranted for WTI. However, traders should remain vigilant and carefully manage their risk. The strong ADX of 36.67 on the 4-hour chart supports the bullish case.
If WTI breaks above the $67.33 resistance level, the next target would be $68.28, followed by $69.15. A sustained break above $69.15 could pave the way for a test of higher levels.
If WTI fails to break above $67.33 and instead falls below the $65.51 support level, the next target would be $64.64, followed by $63.69. A sustained break below $63.69 could signal a deeper correction.
Entry Trigger: A decisive break above the $67.33 resistance level could serve as a trigger for entering a long position. Target 1: $68.28. Target 2: $69.15. Stop/Invalidation: A close below $65.51 would invalidate the bullish thesis and warrant a reassessment of the trade.
Given the current technical picture and the strength of the fundamental drivers, a 60% probability can be assigned to the bullish scenario. However, traders should remain flexible and be prepared to adjust their positions based on evolving market conditions.
Frequently Asked Questions: WTI Analysis
Is WTI a good buy right now?
WTI shows bullish momentum at $67.03, but with RSI in overbought territory on the hourly chart, traders should wait for a decisive break above $67.33 resistance for confirmation before buying. A close above this level suggests further upside potential.
What is the WTI price forecast for this week?
The WTI price forecast for this week is bullish, with a potential move towards $68.28 and $69.15 if the $67.33 resistance is broken. This scenario has a 60% probability given current technicals and supply concerns.
What are the key support and resistance levels for WTI?
Key support levels for WTI are $65.51, $64.64, and $63.69. Resistance levels to watch are $67.33, $68.28, and $69.15. These levels are derived from daily and 4-hour chart analysis.
Why is WTI moving today?
WTI is moving higher today due to rising concerns over global oil supply disruptions stemming from geopolitical tensions and OPEC+ production cuts. These factors are overpowering typical demand-side considerations.
Technical Outlook Summary
| Indicator | Value | Signal |
|---|---|---|
| RSI (14) | 59.99 | Neutral |
| MACD Histogram | Positive | Bullish |
| Stochastic | 54.52/58.52 | Bearish |
| ADX | 28.64 | Strong Trend |
| Bollinger | Middle Band | Watch |
Key Levels
Support Levels
Resistance Levels
Track markets in real-time
AI-powered analysis, technical indicators and real-time price data.
Join Our Telegram Channel
Breaking market news, AI analysis and trading signals instantly.
Join Channel