WTI Eyes $76.02: Bulls Test Resistance Amid Geopolitical Tensions
WTI crude oil is trading around $76.02, testing resistance as geopolitical risks in the Middle East escalate. Is this a breakout or a bull trap?
Is the WTI bull run sustainable at $76.02, or are we seeing a temporary surge fueled by geopolitical fears? The energy market is caught in a tug-of-war between supply concerns and potential demand slowdowns, leaving traders questioning the next move.
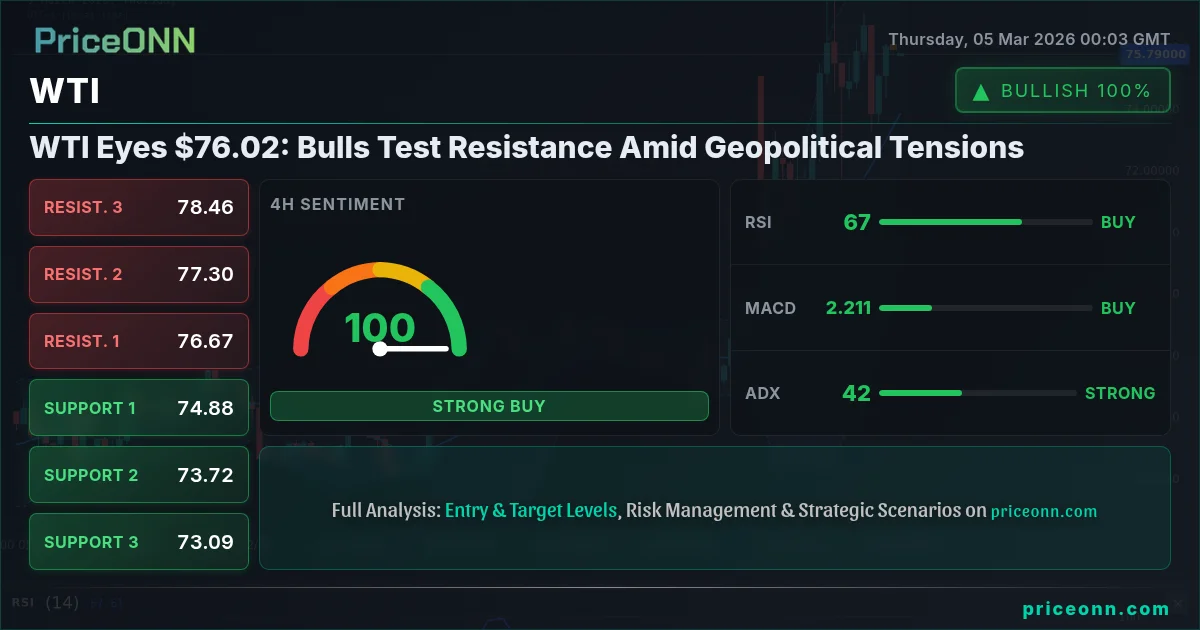
- RSI at 71.16 on the 1H chart suggests short-term overbought conditions, potentially signaling a pullback.
- Key resistance level at $76.39, a break above which could trigger further upside.
- ADX at 42.99 on the 4H chart indicates a strong uptrend, supporting bullish momentum.
- Geopolitical tensions in the Middle East are a major catalyst, driving safe-haven demand and impacting oil prices.
The Bull Case for WTI: Geopolitical Risks and Supply Constraints
The bullish narrative for WTI is heavily influenced by escalating tensions in the Middle East. As reported by several news outlets, including Forex Haber, the conflict is raising concerns about potential disruptions to oil supply routes. This fear factor is a primary driver behind the recent price surge. The potential for supply shocks is amplified by ongoing OPEC+ production cuts, further tightening the market. The Bank of Canada and Bank of Japan decisions are also impacting CAD/JPY, which is sensitive to oil price fluctuations. The "cad jpy news boc boj oil prices" is a rising star on Google, demonstrating the market's focus on this relationship.
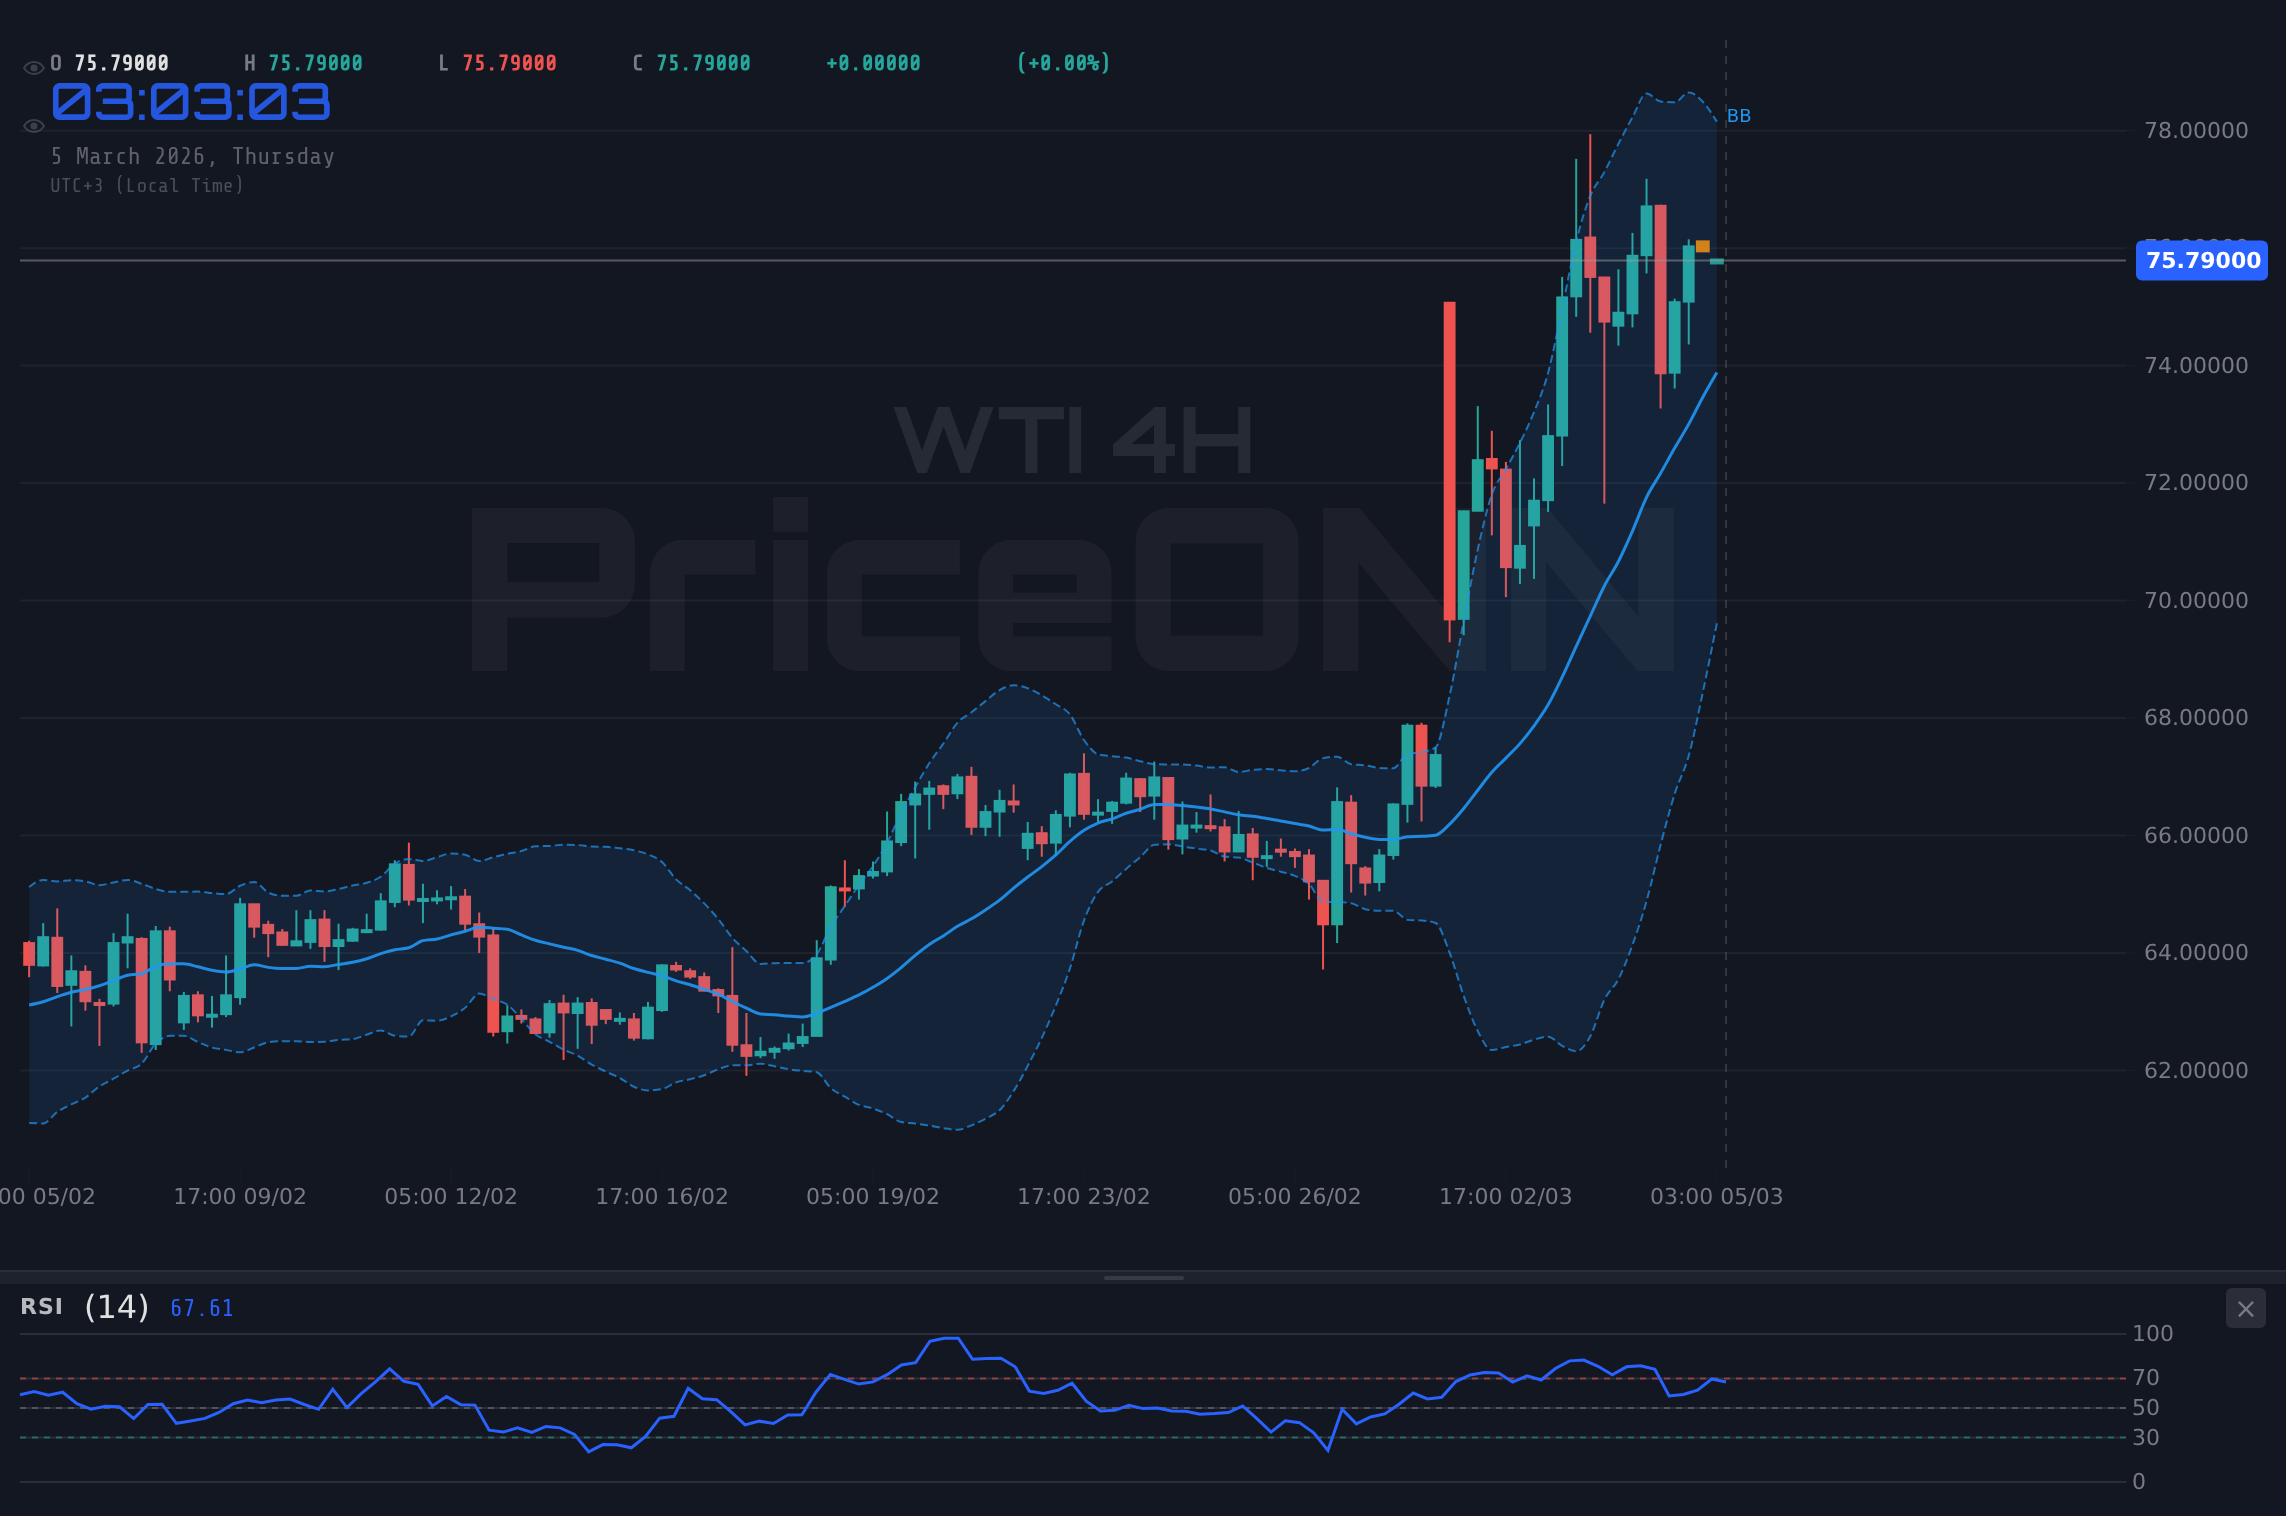
From a technical standpoint, the 4H chart paints a bullish picture. The ADX reading of 42.99 signifies a strong uptrend, suggesting that the current momentum is likely to continue. The RSI, while high at 71.16 on the 1H timeframe, still leaves room for further gains before reaching extreme overbought territory. The MACD histogram on the 1D chart, though showing negative momentum, is poised for a potential bullish crossover, adding another layer of support to the upside scenario. Immediate resistance lies at $76.39; clearing this level could open the door to $76.76 and potentially $77.36.
The WTI crude price prediction this week hinges significantly on the market's assessment of these geopolitical risks. If tensions continue to escalate, we could see a sustained push higher. Moreover, the weaker US Dollar, as reflected by the DXY's current level of 98.52, provides additional tailwinds for WTI. A weaker dollar makes oil cheaper for international buyers, increasing demand. The rise in WTI prices could also be linked to the recent surge in LNG and aluminum prices amid the Middle East tensions, as reported on March 4.
The Bear Case for WTI: Demand Concerns and Overbought Conditions
Despite the bullish factors, a bearish counter-argument exists. Concerns about a potential global economic slowdown are weighing on the demand outlook for oil. A weaker economic backdrop could lead to a decrease in oil consumption, putting downward pressure on prices. Furthermore, the strong gains in WTI may have led to overbought conditions, setting the stage for a potential correction.
Looking at the technicals, the Stochastic indicator on the 1D chart is showing a bearish crossover (K=54.52, D=58.52), indicating that the upward momentum may be waning. The 1H RSI at 71.16 suggests that bulls are losing steam, and a pullback may be imminent. Key support levels to watch are $75.42, $74.82 and $74.45. A break below these levels would confirm the bearish scenario and could lead to a deeper correction. The "fuel price turkey petrol diesel lpg price change news" also impacts the price. It is also important to acknowledge the potential impact of trade tensions between the U.S. and China on global supply chains and energy prices, as reported on March 4.
The upcoming economic data releases, particularly the USD events scheduled for the next seven days, could also play a crucial role. Any disappointing economic figures could exacerbate demand concerns and trigger a sell-off in WTI. The WTI crude price prediction this week must consider these potential headwinds. The market is also closely monitoring the SP500 and Nasdaq100 indexes. If these indices experience a significant pullback, risk appetite could decline, further weighing on WTI.
Technicals as Tiebreaker: Multi-Timeframe Analysis
To reconcile the conflicting signals, a multi-timeframe analysis is essential. On the 1H chart, the trend is neutral, with the RSI indicating overbought conditions. However, the MACD is still showing positive momentum, suggesting that the bulls haven't completely surrendered. On the 4H chart, the trend is bullish, with the ADX confirming strong upward momentum. However, the Stochastic is showing a bearish crossover, warning of a potential pullback. On the 1D chart, the trend is bullish, but the Stochastic is also showing a bearish crossover, and the RSI is approaching overbought territory.
The conflicting signals suggest that WTI is at a critical juncture. A breakout above $76.39 would confirm the bullish scenario and could lead to further gains. However, a break below $75.42 would confirm the bearish scenario and could trigger a deeper correction. The ADX on the 4H chart, which reads 42.99, is the real story here. A strong-trend reading like this suggests the breakout has committed and that the price will likely continue in the same direction.
Trade Plan: Riding the WTI Wave (Probability: 65%)
Given the overall bullish bias and the strong uptrend confirmed by the ADX, a long position appears to be the higher-probability trade. However, caution is warranted due to the overbought conditions on the shorter timeframes.
A sustained break above $76.39 resistance would confirm the bullish momentum, targeting $76.76 and $77.36. This scenario assumes continued geopolitical tensions and a weaker US Dollar.
Failure to hold above $75.42 would signal a trend reversal, with targets at $74.82 and $74.45. This scenario assumes easing geopolitical tensions and a stronger US Dollar.
Key Levels
Key Levels
Support Levels
Resistance Levels
Technical Outlook Summary
| Indicator | Value | Signal |
|---|---|---|
| RSI (14) 1H | 71.16 | Overbought |
| MACD Histogram 1D | Positive | Bullish |
| Stochastic 1D | K=54.52, D=58.52 | Bearish |
| ADX 4H | 42.99 | Strong Trend |
| Bollinger 1H | Upper Band | Watch |
Frequently Asked Questions: WTI Analysis
Is WTI a good buy right now?
WTI at $76.02 presents a mixed picture. The strong uptrend suggests potential gains, but overbought conditions warrant caution. A buy is justified above $76.39, with a stop below $75.42.
What is the WTI price forecast for this week?
The WTI price forecast this week is bullish, with a target of $77.36 if geopolitical tensions persist. However, a break below $75.42 could lead to a correction towards $74.45. Probability assessment: 65% bullish.
What are the key support and resistance levels for WTI?
Key support levels for WTI are $75.42, $74.82, and $74.45. Key resistance levels are $76.39, $76.76, and $77.36, all derived from the current market data.
Why is WTI moving today?
WTI is moving higher today primarily due to escalating geopolitical tensions in the Middle East, which are raising concerns about potential supply disruptions. A weaker US Dollar is also providing support.
Track markets in real-time
AI-powered analysis, technical indicators and real-time price data.
Join Our Telegram Channel
Breaking market news, AI analysis and trading signals instantly.
Join Channel