WTI Surges to $79.55: Hormuz Threat Fuels Bullish Breakout
WTI crude oil jumps to $79.55 amid escalating tensions in the Strait of Hormuz. Is this rally sustainable, or a short-term spike?
The battle between bulls and bears is intensifying around the $79.55 level for WTI crude oil, as geopolitical risks in the Middle East collide with technical breakout signals. The Strait of Hormuz, a critical chokepoint for global oil supply, is once again in the spotlight, injecting volatility into energy markets. The question now is whether this surge is the start of a sustained uptrend or a temporary reaction to external shocks.
- WTI crude oil surged to $79.55, driven by geopolitical tensions in the Strait of Hormuz.
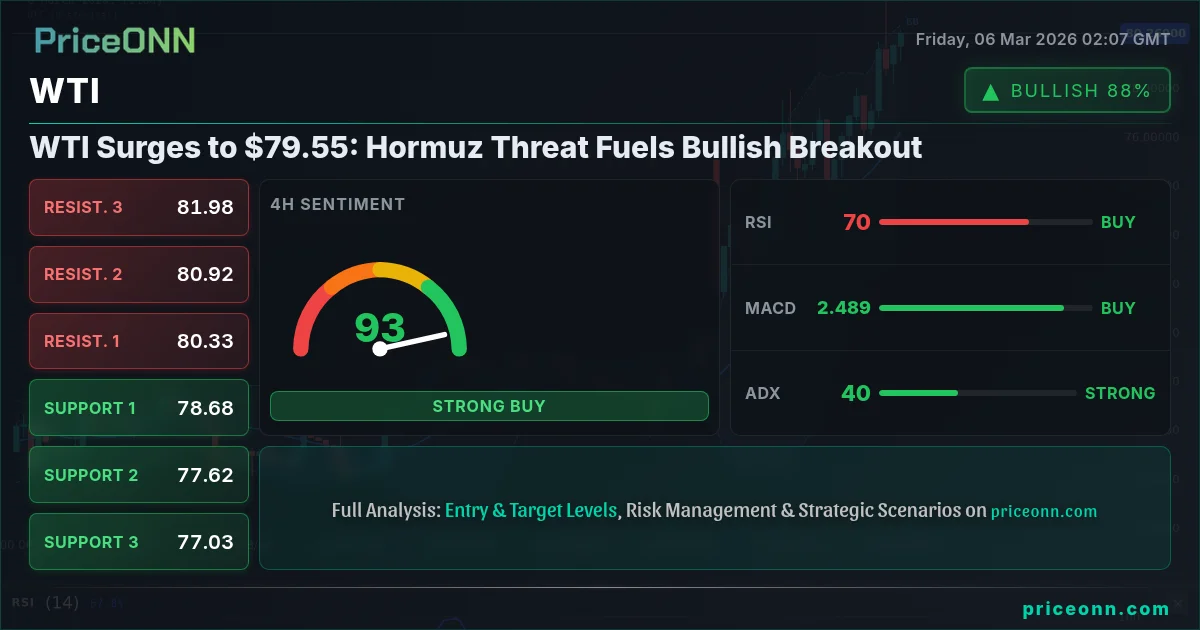
- Key resistance levels to watch are $79.94 and $81.11, potential targets for bullish traders.
- The ADX at 39.98 on the 4-hour chart indicates a strong upward trend, supporting the bullish case.
- Short-term pullbacks are possible, with support at $78.22 and $77.84, offering potential entry points.
The Bull Case: Geopolitics and Technical Momentum
The bullish narrative for WTI crude oil is currently fueled by two primary factors: escalating geopolitical tensions and positive technical momentum. The Strait of Hormuz, a narrow waterway between Oman and Iran, is a vital transit route for nearly a third of the world's seaborne oil. Any disruption to traffic in this region can send shockwaves through global energy markets. Recent news of increased naval activity and threats to shipping have triggered risk premiums, pushing WTI higher. As Reuters reported recently, "geopolitical instability in the Middle East is a key driver of crude oil price volatility." This instability is directly reflected in WTI's surge.
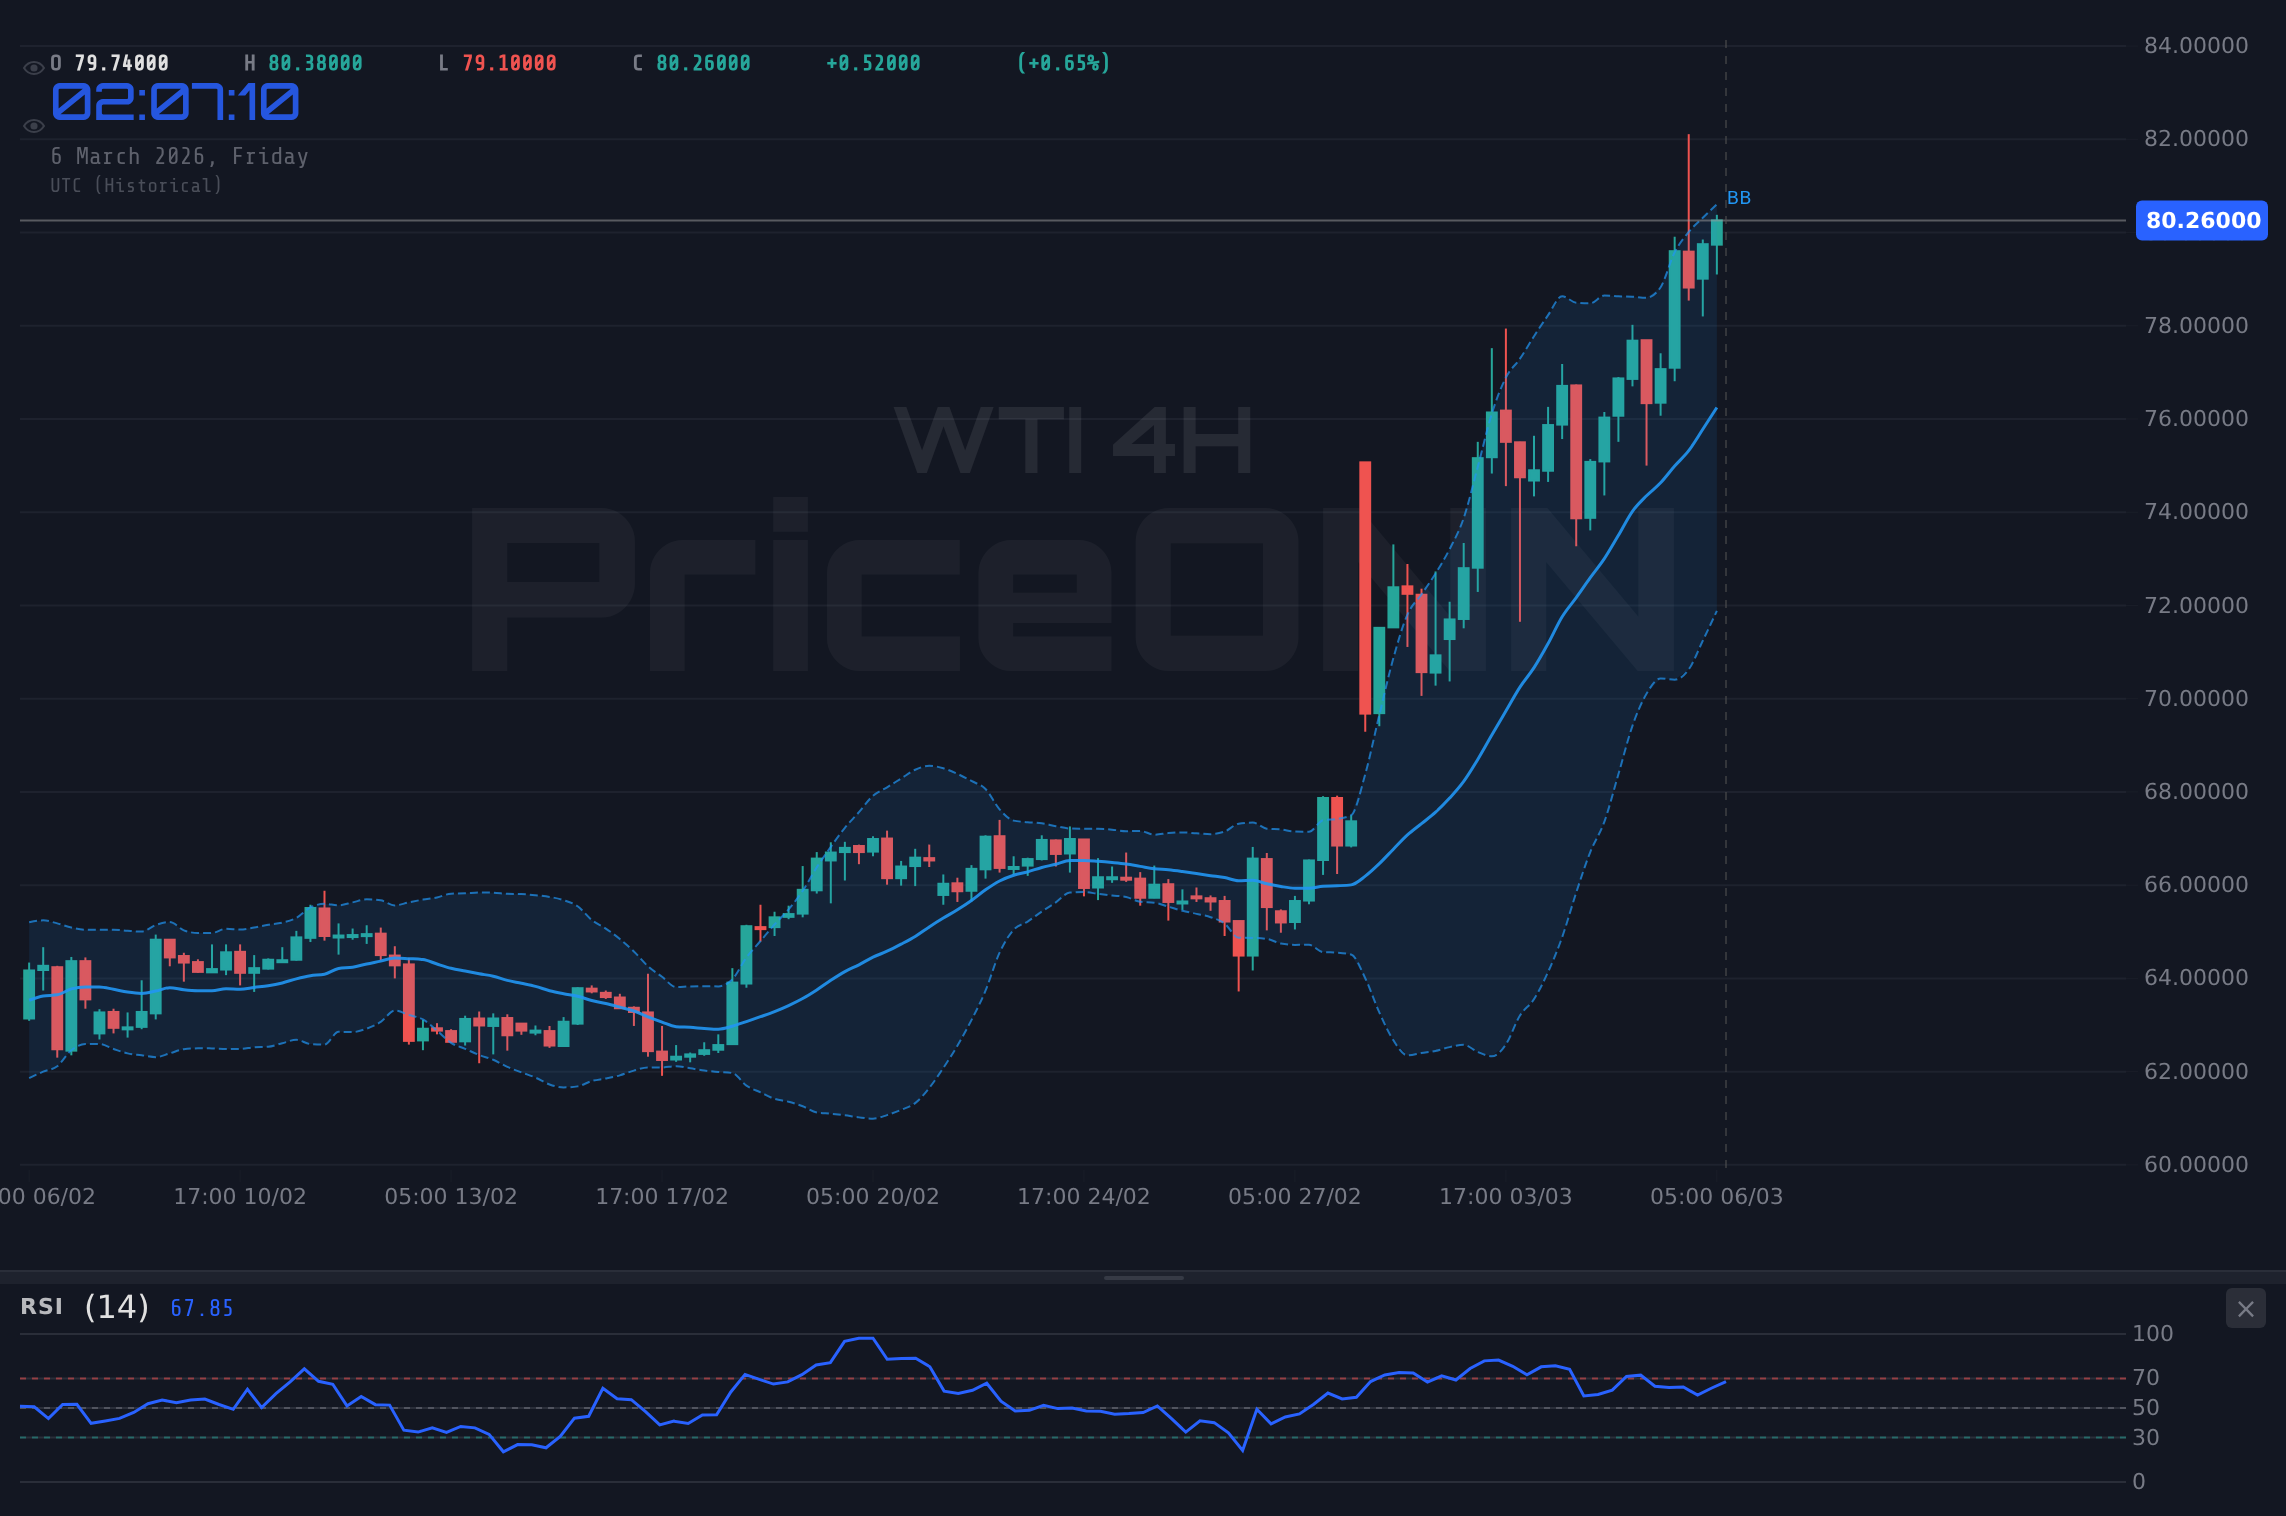
From a technical perspective, the 4-hour chart paints a bullish picture. The ADX, currently at 39.98, confirms a strong upward trend. This is not a weak signal- it's a robust trend that momentum traders will be watching closely. Moreover, the RSI at 68.32, while approaching overbought territory, still has room to run before triggering reversal signals. The MACD histogram is also positive, indicating sustained bullish momentum. The 4H chart's Stochastic reading of K=76, D=79.72 suggests potential for consolidation or a minor pullback but does not signal a significant reversal. These indicators, when viewed together, suggest that the current upward trend is likely to continue, at least in the short term. The immediate resistance level to watch is $79.94, followed by $81.11. A successful breakout above $81.11 could trigger a further rally towards $83.39.
The Bear Case: Overbought Conditions and DXY Strength
Despite the bullish momentum, several factors suggest caution for WTI bulls. The most immediate concern is the overbought conditions on shorter timeframes. The 1-hour chart shows an RSI of 71.16, signaling that WTI may be due for a pullback. The Stochastic indicator, with K=90.49 and D=81.87, reinforces this view, indicating that WTI is overextended in the short term. Profit-taking after the recent surge could trigger a temporary correction, potentially driving WTI back towards support levels.
Another factor weighing on WTI is the strengthening US dollar. The DXY (Dollar Index) is currently trading at 98.67, up 0.16% on the day. A stronger dollar typically puts downward pressure on commodity prices, as they become more expensive for buyers using other currencies. The negative correlation between WTI and the DXY has been evident historically, and any further gains in the dollar could limit WTI's upside potential. The fact that the SP500 is down -0.53% further adds to the risk-off sentiment, potentially reducing demand for risk assets like crude oil. While WTI's price is primarily being moved by the geopolitical scenario, the wider market risk sentiment cannot be ignored.
From a longer-term perspective, the 1-day chart presents a mixed picture. While the overall trend is still up, the Stochastic indicator signals a potential reversal. The RSI at 82.42 is firmly in overbought territory, increasing the risk of a significant correction. The next few trading sessions will be critical in determining whether WTI can sustain its upward momentum or whether a deeper pullback is on the horizon. The support level to watch on the daily chart is $77.72; a break below this level could signal a shift in trend.
Technical Verdict: Bullish with Caution
After weighing the bullish and bearish arguments, the technical picture for WTI crude oil leans bullish, but with a clear need for caution. The geopolitical tensions in the Middle East are a powerful catalyst, and the 4-hour chart confirms a strong upward trend. However, overbought conditions on shorter timeframes and the strengthening US dollar pose significant headwinds. Traders should be prepared for potential pullbacks and manage their risk accordingly.
For scalpers, the 1-hour chart offers potential opportunities for short-term long positions, but with tight stop losses. Swing traders should focus on the 4-hour chart, waiting for pullbacks to support levels before entering new positions. Long-term investors should monitor the daily chart and be prepared to scale into positions during periods of weakness. A key factor to watch will be the weekly close- a close above $79.00 would confirm the bullish breakout and increase the likelihood of further gains.
The upcoming economic data releases will also play a crucial role. The market will be watching for any surprises in the latest inflation figures and employment data, as these could influence the Fed's monetary policy and impact the dollar's strength. It's worth noting that the economic calendar for today, March 6th (Friday), includes key events that could trigger volatility. The forex market may react to geopolitical tensions as well. The EURUSD pair is navigating a complex landscape as the ECB grapples with the economic fallout from geopolitical tensions. According to Reuters, Fed officials are emphasizing that inflation remains "stubborn", which could lead to a tightening of monetary policy and further strength in the dollar.
WTI breaks above $79.94 and sustains momentum, targeting $81.11 and potentially $83.39. A strong close above $80 on the daily chart would confirm this scenario.
WTI fails to hold above $78.22 and declines towards $77.84 and $77.72. A break below $77.72 could trigger a deeper correction towards $75.
Trade Plan: WTI Long Position
Based on the technical analysis and geopolitical context, a long position in WTI crude oil is favored, but with careful risk management. The entry trigger is a sustained break above $79.94, confirmed by increased volume. The first target is $81.11, representing the next level of resistance on the 4-hour chart. The second target is $83.39, a more ambitious level that could be reached if the bullish momentum persists. The stop-loss should be placed below $77.72, representing a key support level on the daily chart. The probability of this scenario playing out is estimated at 60%, reflecting the potential for pullbacks and the influence of external factors.
The upcoming economic data releases and geopolitical developments could trigger significant volatility in WTI crude oil. Traders should closely monitor these events and adjust their positions accordingly.
Frequently Asked Questions: WTI Analysis
Is WTI a good buy right now?
At $79.55, WTI presents a potential buying opportunity if it breaks above $79.94, confirming bullish momentum. However, traders should be cautious of overbought conditions and manage their risk accordingly.
What is the WTI price forecast for this week?
The WTI price forecast for this week is bullish, with potential targets at $81.11 and $83.39 if the upward trend continues. A break below $77.72 could invalidate this forecast.
What are the key support and resistance levels for WTI?
Key support levels for WTI are $78.22 and $77.72, while key resistance levels are $79.94 and $81.11. These levels should be closely monitored for potential trading opportunities.
Why is WTI moving today?
WTI is moving today primarily due to escalating geopolitical tensions in the Strait of Hormuz, which are disrupting global energy supply and increasing risk premiums.
Correlation Analysis
The correlation between WTI crude oil and other key market indicators provides valuable insights into the current market dynamics. The DXY (Dollar Index), currently at 98.67, exhibits a negative correlation with WTI. A stronger dollar typically puts downward pressure on WTI prices, as crude oil is priced in US dollars. Conversely, a weaker dollar tends to support WTI prices. The SP500 and Nasdaq100, currently at 6833.95 and 25043.76 respectively, have a positive correlation with WTI. A strong equity market typically reflects increased risk appetite and economic growth, which tends to boost demand for crude oil. Conversely, a weak equity market suggests decreased risk appetite and economic slowdown, which tends to weigh on WTI prices.
The bond market also provides valuable information. Rising treasury yields typically reflect increased inflation expectations, which can support WTI prices. Conversely, falling treasury yields suggest decreased inflation expectations, which can weigh on WTI prices. The Bank of Japan continues to hold steady while other central banks are considering rate hikes.
Technical Outlook Summary
| Indicator | Value | Signal |
|---|---|---|
| RSI (14) | 68.32 | Neutral |
| MACD Histogram | Positive | Bullish |
| Stochastic | 76, 79.72 | Neutral |
| ADX | 39.98 | Strong Trend |
| Bollinger | Upper Band | Watch |
Key Levels
Support Levels
Resistance Levels
Track markets in real-time
AI-powered analysis, technical indicators and real-time price data.
Join Our Telegram Channel
Breaking market news, AI analysis and trading signals instantly.
Join Channel