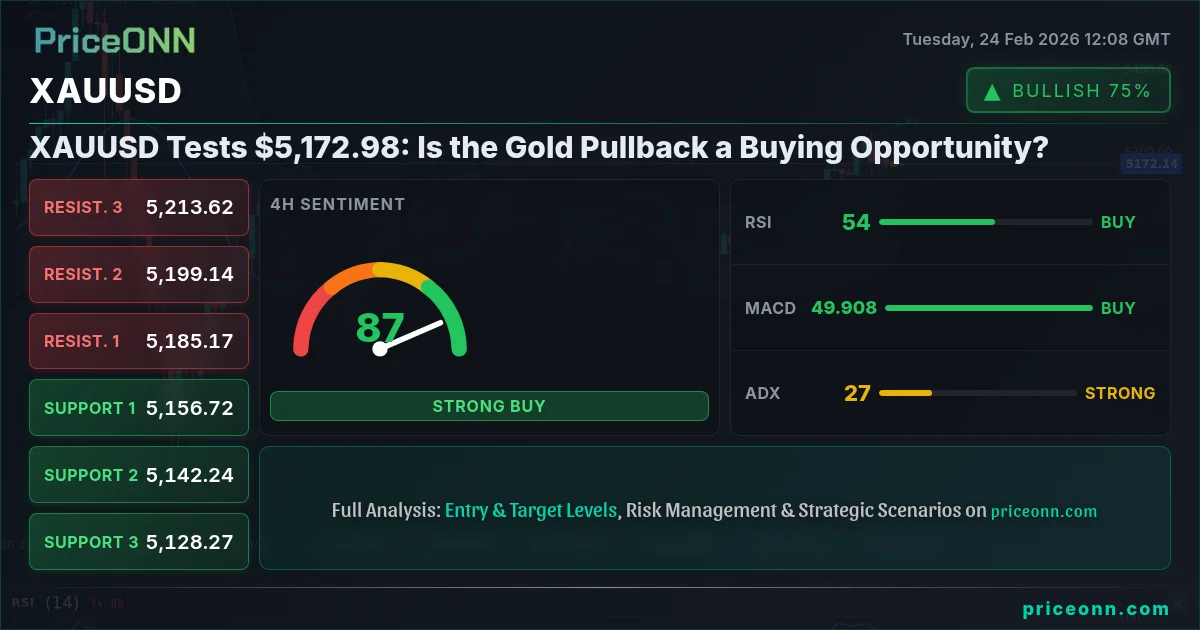
The battle between gold bulls and bears is intensifying around the $5,172.98 level. After a strong rally, XAUUSD is experiencing a pullback, leaving traders wondering if this is a buying opportunity or a sign of further weakness. The dollar index (DXY) is currently at 97.56, exerting downward pressure on gold. The SP500 is up slightly at 6850.55, indicating a mixed risk sentiment.
- RSI at 50.19 on the 1H chart suggests neutral momentum, but a potential bounce could be forming.
- Critical support sits at $5,163.55, a break below which could trigger further selling.
- MACD histogram on the 1H shows negative momentum, indicating bearish pressure in the short term.
- Fed rate expectations and DXY strength are driving the current XAUUSD correlation.
The Bull Case for XAUUSD at $5,172.98
Despite the recent pullback to $5,172.98, the long-term outlook for gold remains bullish. Several factors support this view, including ongoing geopolitical risks, persistent inflation concerns, and central bank policies. Geopolitical tensions in Eastern Europe and the Middle East continue to fuel safe-haven demand for gold. According to Reuters, the conflict in Ukraine is showing no signs of abating, keeping investors on edge. Furthermore, Bloomberg data indicates that global inflation remains elevated, with many countries experiencing inflation rates well above their central bank targets. Gold is often seen as a hedge against inflation, making it an attractive asset in the current environment.
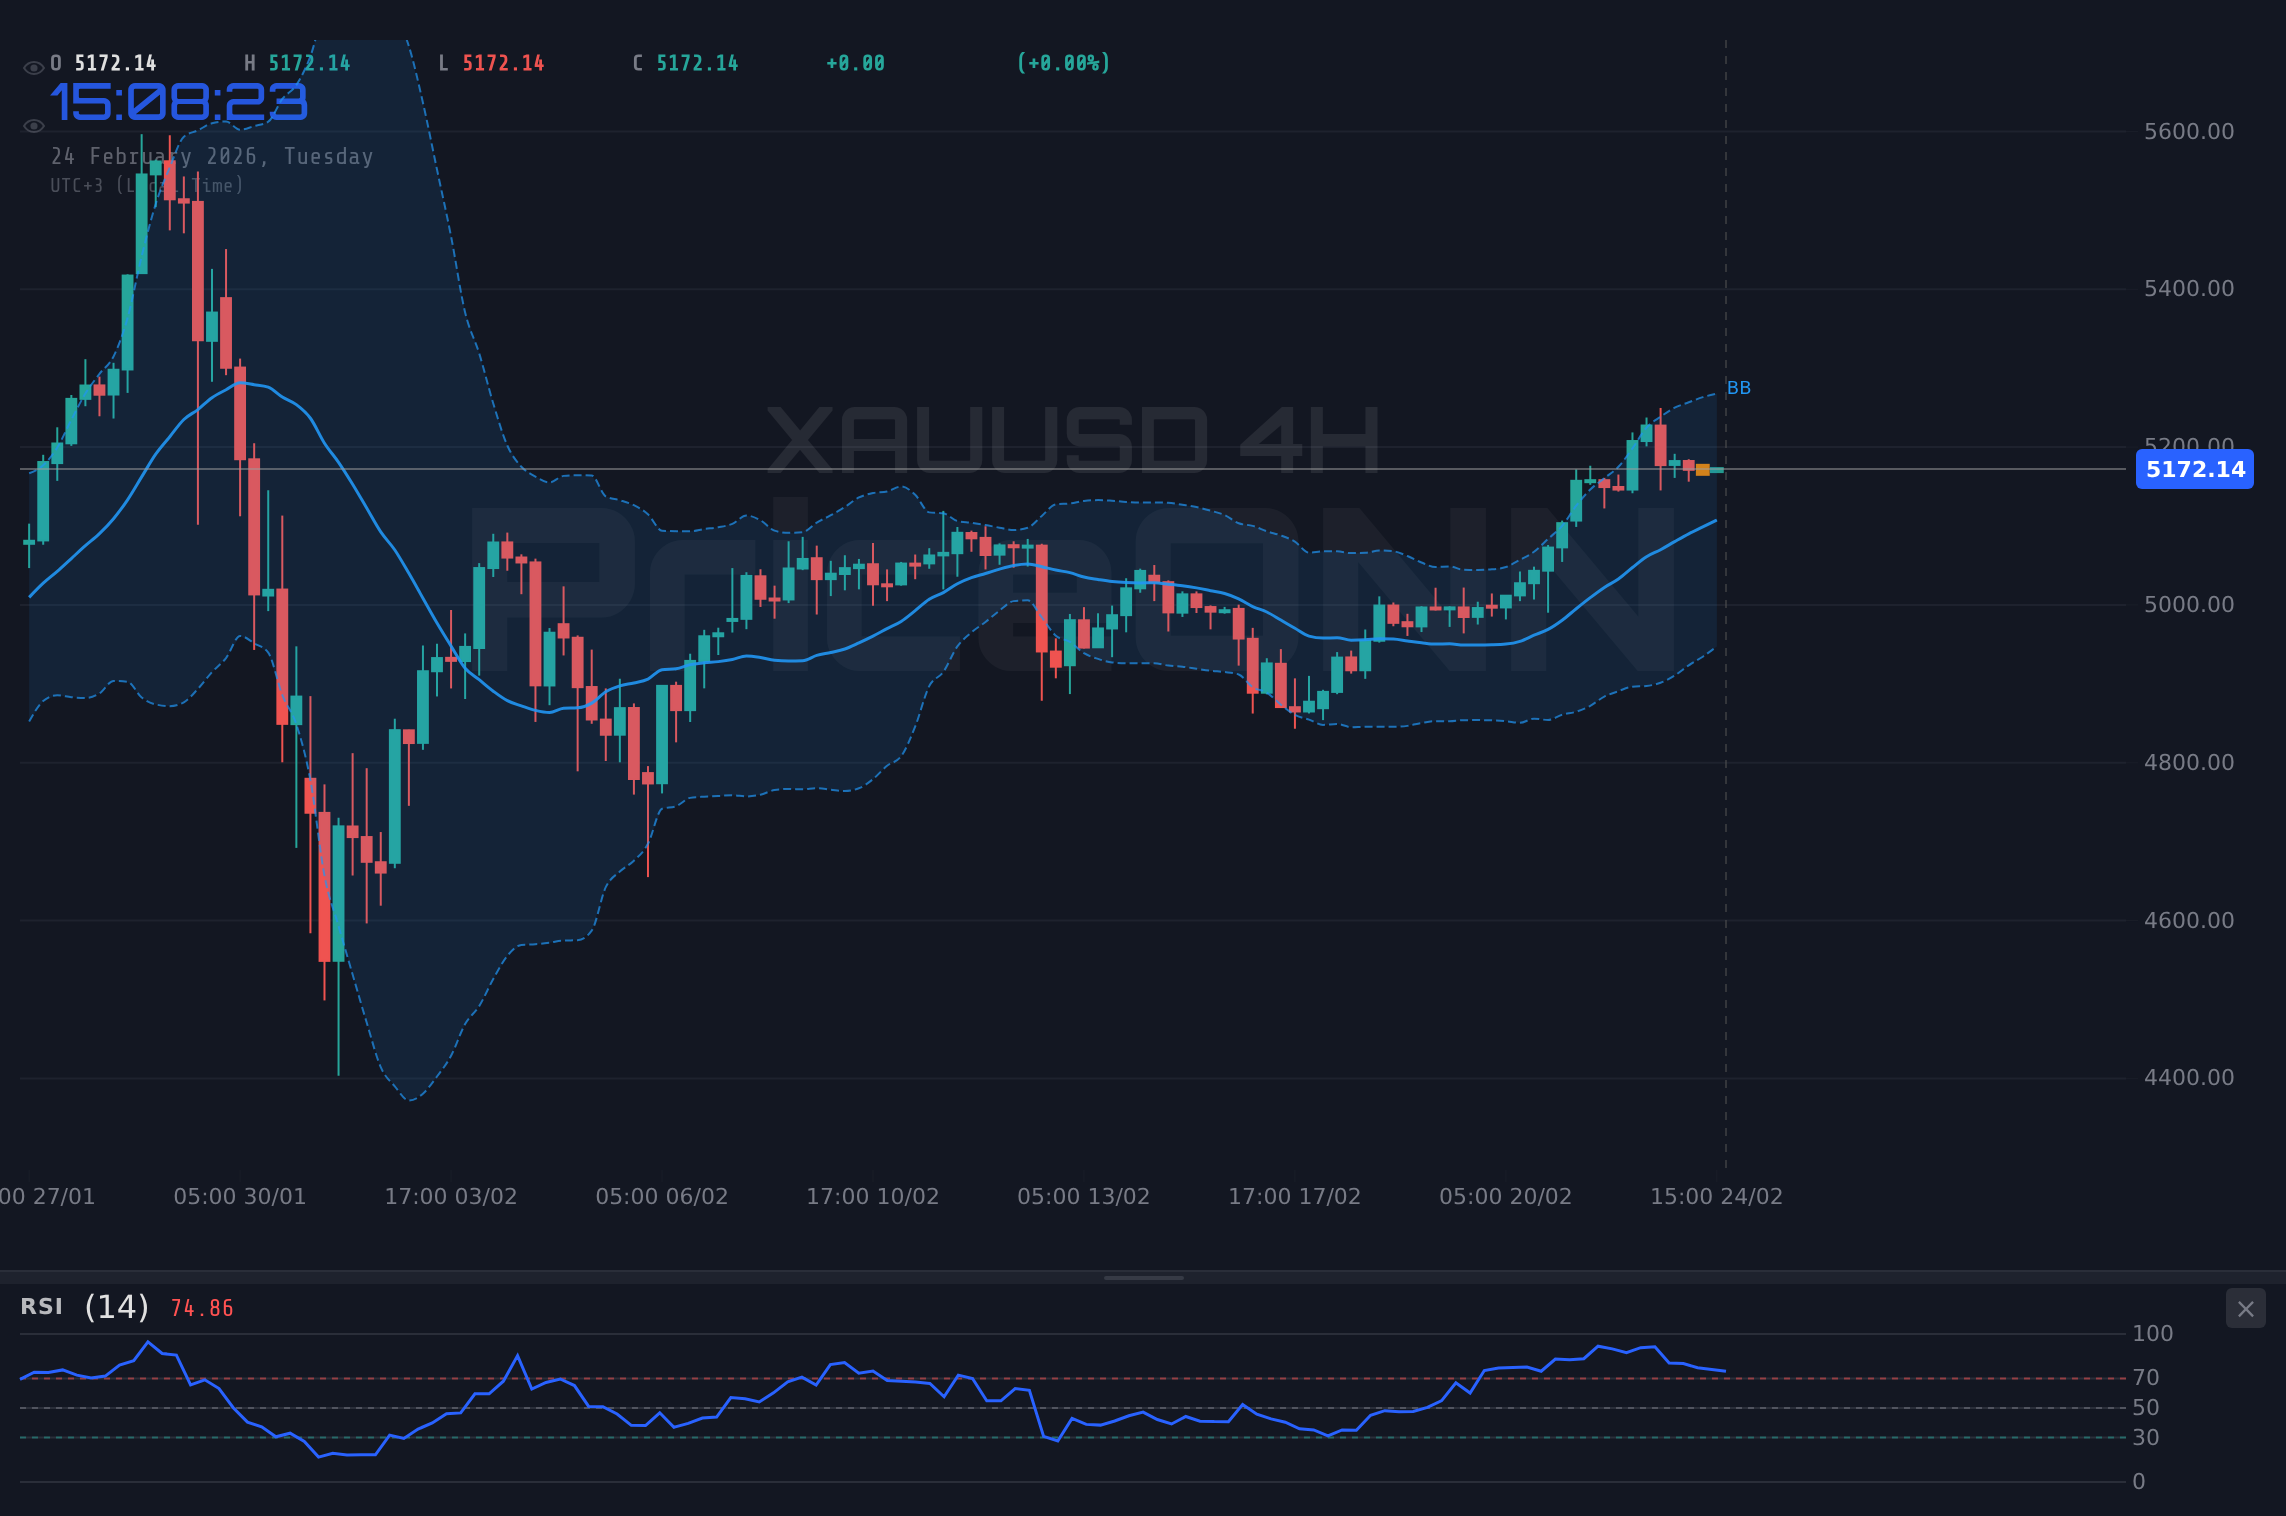
From a technical perspective, the 4H and 1D charts paint a bullish picture. The 4H trend is up with 94% strength, and the 1D trend is also up with 89% strength. The RSI on the 4H chart is at 65.45, indicating that there is still room for further upside before gold becomes overbought. The MACD on both the 4H and 1D charts shows positive momentum, confirming the bullish trend. However, the stochastic on the 4H chart shows a potential sell signal (%K
Brent crude oil is currently trading at $65.73, up 1.96% on the day. Rising oil prices often lead to higher inflation expectations, which can further boost demand for gold. WTI crude is at $66.46, up 0.11%. The Dow Jones is up 0.17% at 48915, indicating a mixed risk sentiment. The Nasdaq is up 0.23% at 24783.74, while the SP500 is up 0.1% at 6850.55. These mixed signals suggest that investors are cautiously optimistic about the economic outlook, but are also wary of potential risks.
The Bear Case for XAUUSD: Dollar Strength and Risk Appetite
Despite the bullish arguments, there are also reasons to be cautious about gold's near-term prospects. The primary headwind for gold is the strength of the US dollar. The DXY is currently trading at 97.56, up 0.15% on the day. A stronger dollar makes gold more expensive for international buyers, reducing demand. The rise in the DXY is putting downward pressure on gold.
From a technical perspective, the 1H chart shows a neutral trend with 50% strength. The RSI on the 1H chart is at 50.19, indicating neutral momentum. The MACD shows negative momentum, confirming the bearish pressure in the short term. The stochastic on the 1H chart shows a potential buy signal (%K > %D), but this signal is weak and should be treated with caution. Initial resistance is at $5,181.37.
The BTCUSD is currently trading at $63209, down 2.13% on the day. ETHUSD is at $1825.14, down 1.95%. The decline in cryptocurrency prices could also be weighing on gold, as some investors may be shifting their funds from safe-haven assets to riskier assets. The AUDUSD is down 0.1% at 0.70467, and the NZDUSD is up 0.02% at 0.59557, indicating a mixed performance in the commodity currency space.
Technicals as the Tiebreaker: Multi-Timeframe Analysis
To resolve the bull vs. bear debate, let's turn to a multi-timeframe analysis. On the 1H chart, the ADX is at 22.39, indicating a moderate downtrend. The RSI is neutral, and the MACD histogram is negative, suggesting bearish momentum. On the 4H chart, the ADX is at 28.28, indicating a strong uptrend. The RSI is at 65.45, still in neutral territory, and the MACD is positive, confirming bullish momentum. On the 1D chart, the ADX is at 18.72, indicating a weak trend. The RSI is at 58.75, still in neutral territory, and the MACD is positive, confirming bullish momentum.
The conflicting signals across different timeframes suggest that XAUUSD is currently in a consolidation phase. The short-term outlook is bearish, while the medium-term and long-term outlooks are bullish. This suggests that a short-term pullback is likely, but the uptrend is expected to resume in the coming weeks. Look for a potential buy entry near the $5,163.55 support level.
XAUUSD Trade Plan: Buy the Dip?
XAUUSD breaks above the $5,181.37 resistance, confirming the resumption of the uptrend. Targets are $5,195.57 and $5,208.81. This scenario is supported by positive momentum on the 4H and 1D charts.
XAUUSD fails to break above $5,181.37 and falls below the $5,163.55 support. Targets are $5,154.44 and $5,145.73. This scenario is supported by negative momentum on the 1H chart and DXY strength.
Economic Calendar Risk: Upcoming Data Releases
Traders should also be aware of upcoming economic data releases that could impact XAUUSD. The U.S. GDP data release is coming up this week. Strong GDP data could boost the dollar and weigh on gold, while weak data could have the opposite effect. Also, keep an eye on any news from the Russia-Ukraine war, as it could impact gold's safe-haven appeal.
Frequently Asked Questions: XAUUSD Analysis
Is XAUUSD a good buy right now?
XAUUSD presents a potential buying opportunity near the $5,163.55 support level. A confirmed break above $5,181.37 would signal a resumption of the uptrend, making it a favorable entry point for bullish positions. However, monitor DXY and risk sentiment for confirmation.
What is the XAUUSD price forecast for this week?
The XAUUSD price forecast for this week is mixed. A bullish breakout above $5,181.37 could lead to targets of $5,195.57 and $5,208.81, with a 60% probability. Conversely, a break below $5,163.55 could trigger a decline to $5,154.44 and $5,145.73, with a 40% probability.
What are the key support and resistance levels for XAUUSD?
Key support levels for XAUUSD are $5,163.55, $5,154.44, and $5,145.73. Key resistance levels are $5,181.37, $5,195.57, and $5,208.81. These levels represent potential areas of buying or selling pressure.
Why is XAUUSD moving today?
XAUUSD is moving today due to a combination of factors, including DXY strength, mixed risk sentiment, and conflicting technical signals. The upcoming U.S. GDP data release could also be a catalyst for further price movement.
Track markets in real-time
AI-powered analysis, technical indicators and real-time price data.
Join Our Telegram Channel
Breaking market news, AI analysis and trading signals instantly.
Join Channel