

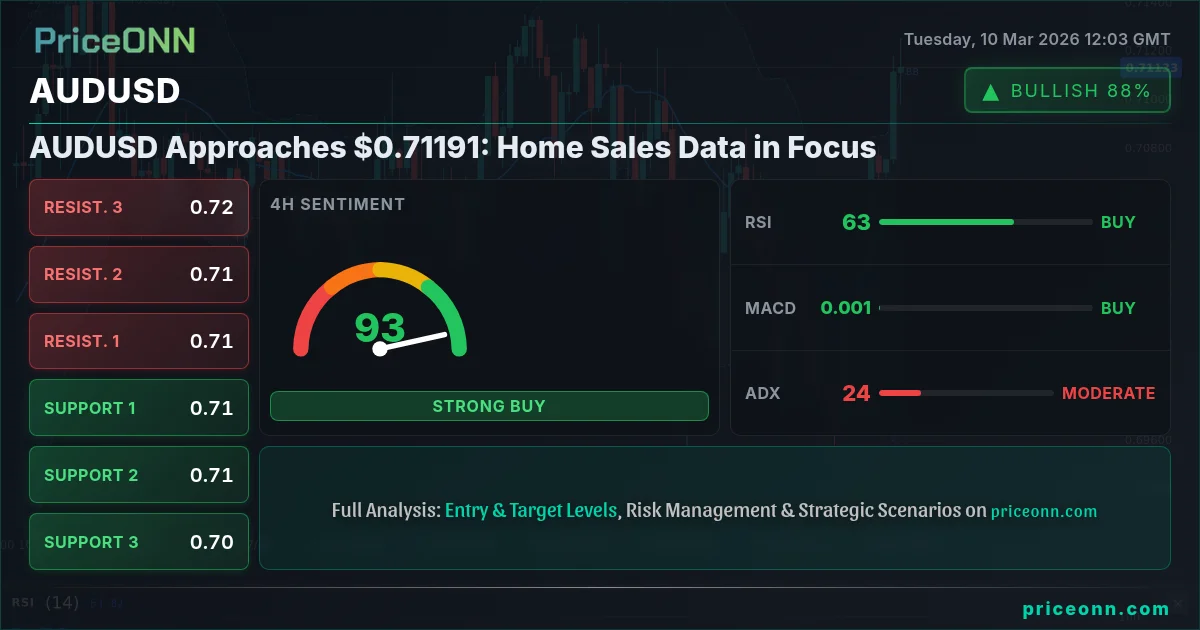
Having tracked AUDUSD through several economic cycles, the current setup is particularly interesting. The pair is hovering around $0.71191, and a breakout seems imminent. The question is: will it be a sustained rally or a false dawn?
- RSI at 69.35 on the 1H chart suggests building upside momentum, but caution is warranted.
- Key resistance lies at 0.71196, a break above which could trigger further gains.
- MACD on the 1H is showing positive momentum, aligning with the short-term bullish outlook.
- Upcoming Australian home sales data and US CPI figures will be critical drivers for AUDUSD correlation with DXY.
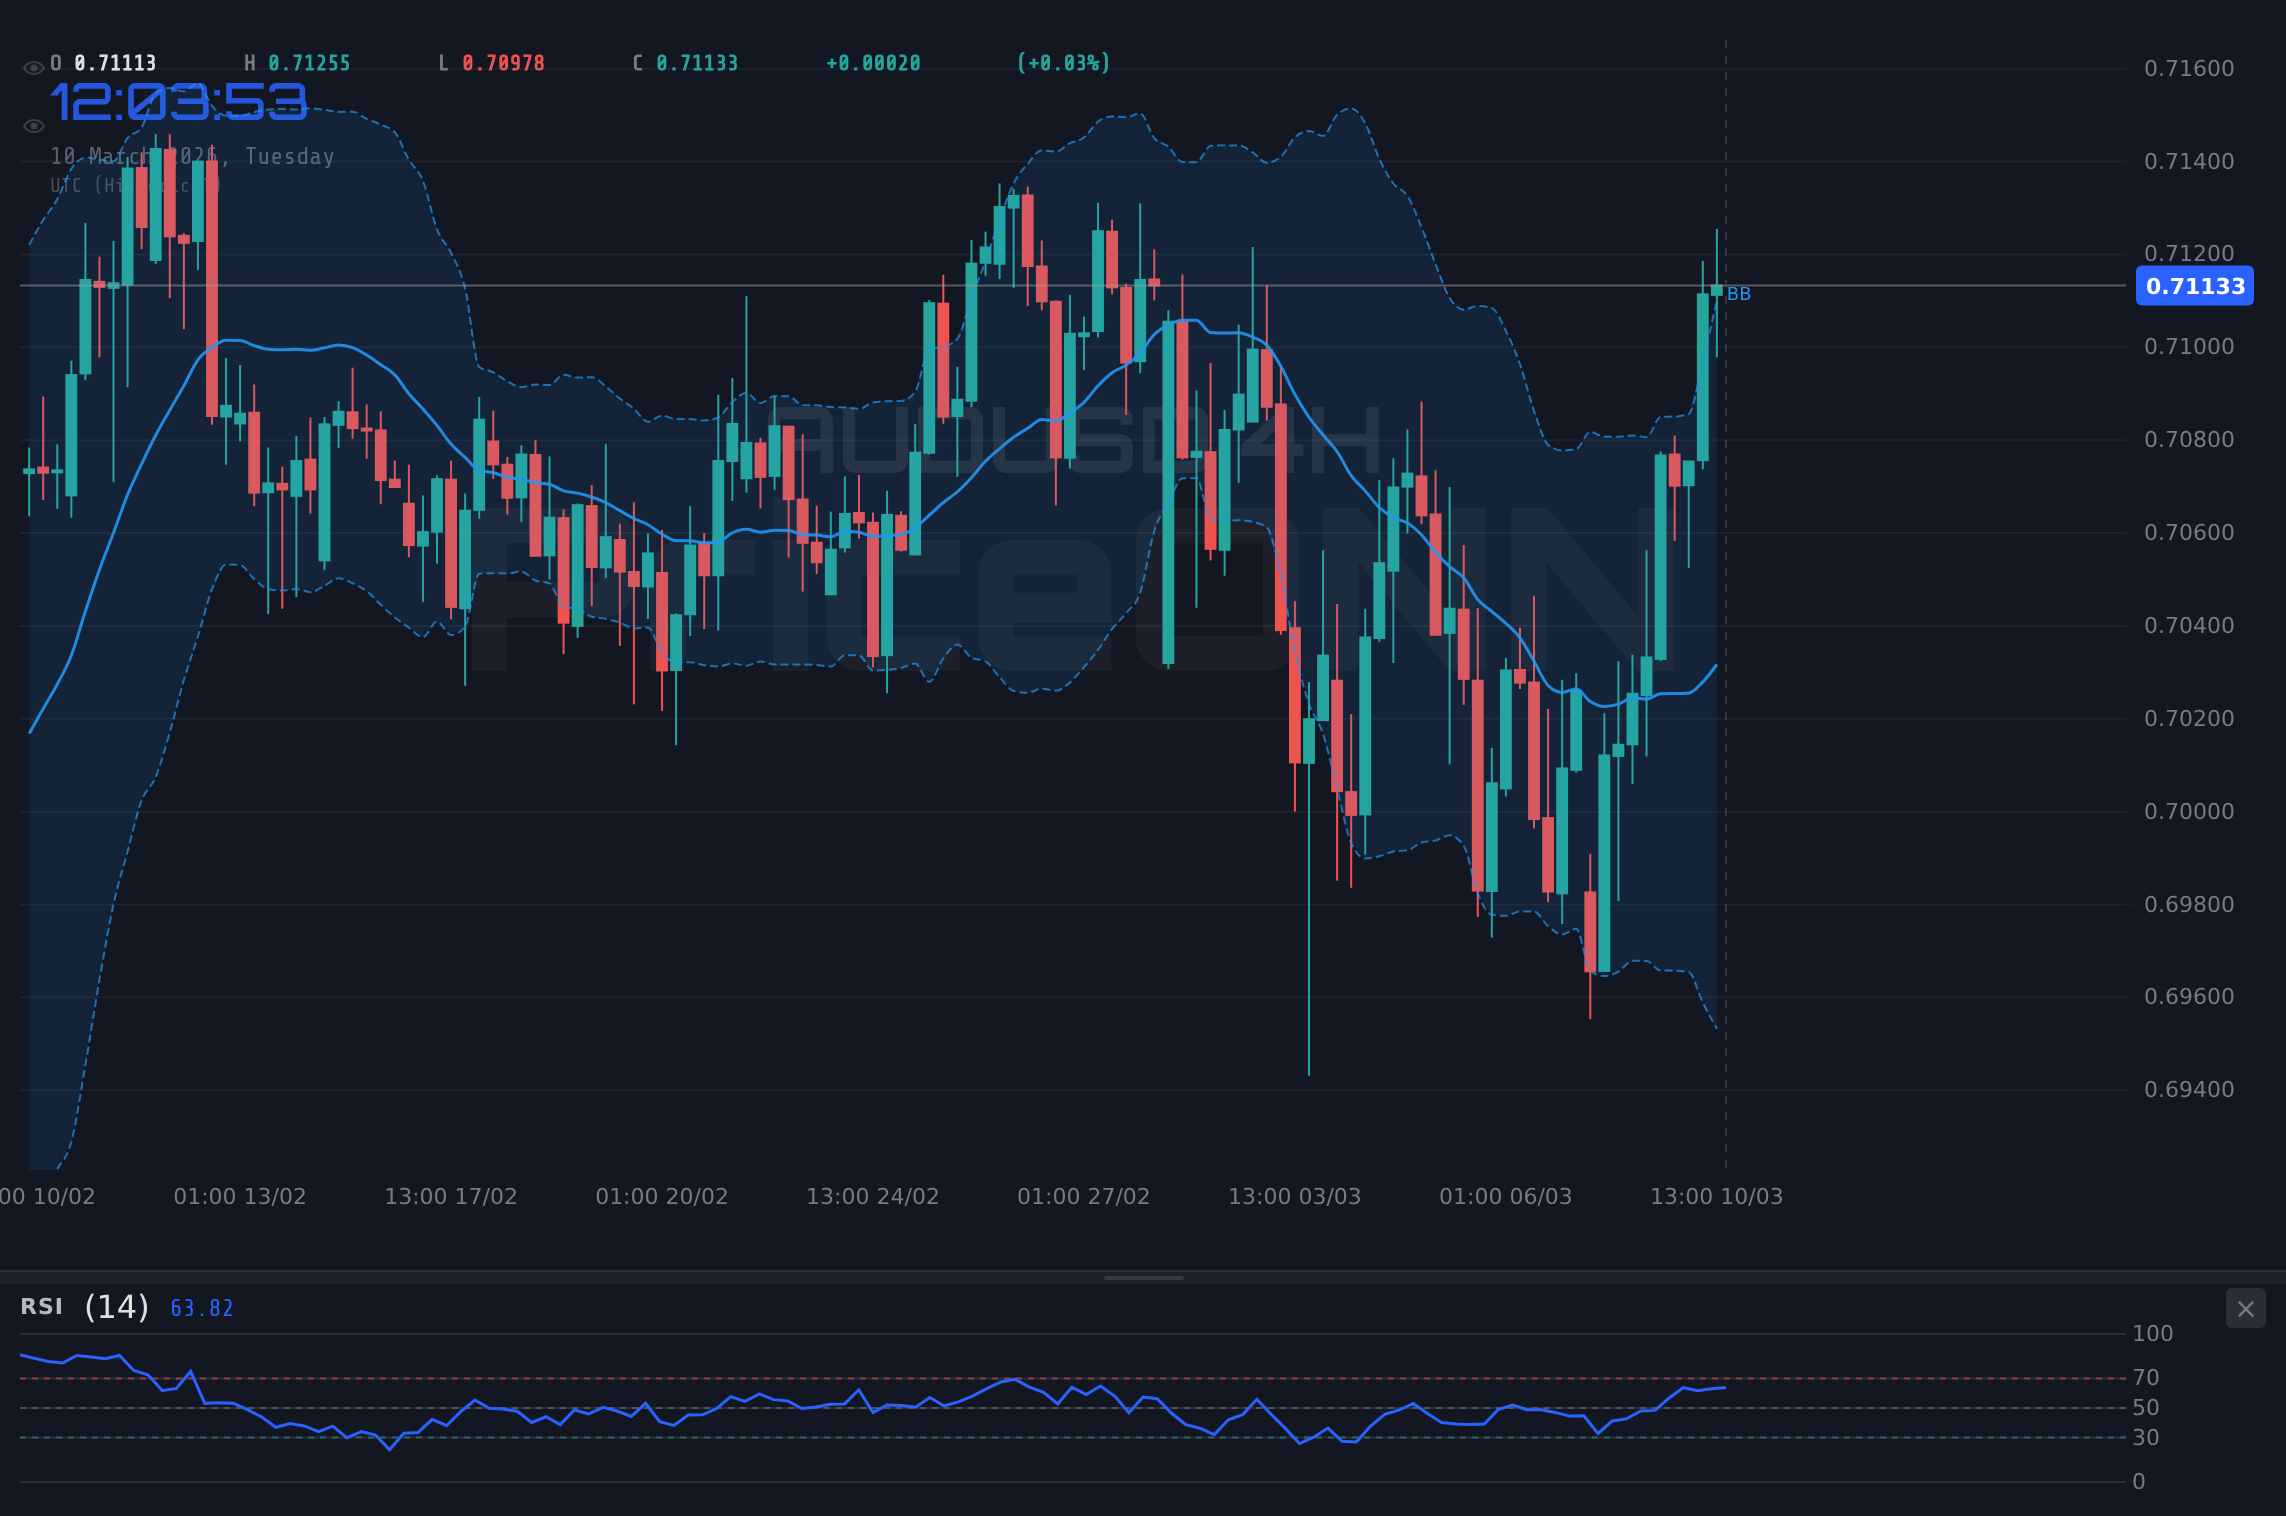
The short-term technical outlook for AUDUSD appears bullish, but several factors warrant caution. The pair's current position at $0.71191 is crucial. A decisive break above the immediate resistance at 0.71196 could open the door for a test of higher levels, potentially targeting 0.71296 and even 0.71405, as indicated by the 1H timeframe data. However, the Stochastic indicator on the 1H chart is showing a bearish crossover (K=63.66, D=65.27), suggesting a possible pullback or consolidation before any significant upward move. This is exactly where you need to pay attention- waiting for confirmation is key.
From a multi-timeframe analysis perspective, the picture is mixed. While the 1H and 4H charts exhibit bullish tendencies with positive MACD momentum and RSI in neutral territory, the 1D chart presents a different story. The 1D chart shows a bearish trend with the price trading above the middle Bollinger Band, and a Stochastic bearish crossover (K=38.75, D=41.67). The ADX on the 1D chart is weak at 13.33, indicating a lack of strong trend, which adds to the uncertainty. This divergence in timeframes suggests that any bullish move in the short term could face resistance from longer-term bearish pressures.
Looking at the broader market context, the DXY (Dollar Index) is currently trading at 98.45, showing a slight upward bias. Historically, a stronger dollar puts pressure on AUDUSD. However, the DXY's own technicals reveal a mixed picture, with the 1H and 4H charts showing bearish trends while the 1D chart is bullish. This suggests that the dollar's strength may be limited, providing some breathing room for AUDUSD to potentially move higher. Risk appetite, as measured by the SP500, is slightly negative with the index down -0.05% at 6783.8. Declining risk appetite typically supports safe-haven currencies like the US dollar, but in this case, the impact appears to be muted.
The upcoming Australian home sales data and US CPI figures are key catalysts to watch. Strong Australian home sales could boost the AUD, while higher-than-expected US CPI data could strengthen the dollar, creating opposing forces on AUDUSD. The forex news suggests “US CPI, Canada jobs, UK GDP in focus as oil crisis reshapes data week”. The market is pricing in a certain level of inflation, so any significant deviation from expectations could trigger a sharp reaction. Patience looks like it will be rewarded here – wait for the data to clarify the direction.
For swing traders, the immediate focus should be on the 0.71196 resistance level. A sustained break above this level, confirmed by increasing volume and a bullish crossover on the Stochastic indicator, could signal a good entry point for a long position. The initial target could be 0.71296, followed by 0.71405. The stop-loss should be placed below the 0.70987 support level to manage risk. Scalpers, on the other hand, could look for opportunities to trade the range between the 0.70987 support and 0.71196 resistance, but this strategy requires tight risk management due to the potential for a breakout. Manage your risk, wait for your setup – the market always gives a second chance.
Long-term investors should focus on the 1D chart and the broader macroeconomic picture. The bearish trend on the 1D chart suggests that any short-term rallies could be temporary. A more conservative approach would be to wait for a clear reversal signal on the 1D chart, such as a break above the 0.71178 resistance level and a bullish crossover on the MACD, before committing to a long-term position. What about the EUR/USD which “softens below 1.1650 as Middle East turmoil boosts US Dollar” this might add pressure on other currencies. Also, “Gold price drops below $5,100 as Oil spike lifts US Dollar” this shows that dollar strength impacts other assets.
The technical indicators present a nuanced picture. On the 1H timeframe, RSI is at 69.35, indicating increasing bullish momentum but not yet in overbought territory. The MACD is positive, supporting the short-term bullish outlook. However, the Stochastic indicator is showing a bearish crossover (K=63.66, D=65.27), suggesting a possible pullback. The ADX is at 37.44, confirming a strong uptrend. These conflicting signals highlight the need for caution and confirmation before taking any trading decisions. This is exactly where you need to pay attention.
Historically, when the RSI reaches this zone on AUDUSD, the outcome has been mixed. In some cases, it has led to a sustained rally, while in others, it has resulted in a pullback or consolidation. The key difference often lies in the underlying fundamental drivers. If the economic data supports the bullish momentum, the rally is more likely to continue. If not, the pullback is more probable. Therefore, it is crucial to pay close attention to the upcoming home sales data and CPI figures. Having tracked AUDUSD through the 2024 rate cycle, I’ve seen this pattern play out before: the market often overreacts to initial data releases, only to correct later based on the broader economic context.
The current technical outlook for AUDUSD is cautiously bullish, but several factors warrant caution. The pair is approaching a key resistance level at 0.71196, and a break above this level could open the door for further gains. However, conflicting signals from the Stochastic indicator and the divergence in timeframes suggest that a pullback or consolidation is possible. The upcoming home sales data and CPI figures will be critical drivers for the pair's next direction. Traders should exercise caution and wait for confirmation before taking any trading decisions. If this condition plays out, we could see a great setup!
A break above 0.71196 resistance, confirmed by rising volume and a bullish Stochastic crossover, could lead to targets at 0.71296 and 0.71405.
Failure to break above 0.71196, coupled with a bearish Stochastic crossover, could lead to a pullback towards 0.70987 and 0.70878 support.
Frequently Asked Questions: AUDUSD Analysis
What happens if AUDUSD breaks above 0.71196 resistance?
A sustained break above the 0.71196 resistance level could trigger a rally towards 0.71296 and potentially 0.71405, as indicated by the 1H timeframe data. Increasing volume and a bullish Stochastic crossover would confirm the breakout.
Should I buy AUDUSD at current levels of $0.71191 given RSI at 69.35?
While the RSI at 69.35 suggests building upside momentum, it is not yet in overbought territory. A more conservative approach would be to wait for a confirmed break above the 0.71196 resistance before considering a long position, with a stop-loss placed below 0.70987.
Is the Stochastic bearish crossover a reliable sell signal for AUDUSD right now?
The Stochastic bearish crossover on the 1H chart (K=63.66, D=65.27) suggests a possible pullback or consolidation in the short term. However, it should not be considered a definitive sell signal. Other factors, such as the MACD and the overall trend, should also be taken into account.
How will the upcoming Australian home sales data affect AUDUSD this week?
Strong Australian home sales data could boost the AUD, potentially leading to a rally in AUDUSD. Conversely, weak data could weigh on the AUD, causing AUDUSD to decline. The market's reaction will depend on the magnitude of the deviation from expectations.
Technical Outlook Summary
| Indicator | Value | Signal |
|---|---|---|
| RSI (14) | 69.35 | Neutral |
| MACD Histogram | Positive | Bullish |
| Stochastic | K=63.66, D=65.27 | Bearish |
| ADX | 37.44 | Strong Trend |
| Bollinger | Upper Band | Watch |
Key Levels
Support Levels
Resistance Levels
Track markets in real-time
AI-powered analysis, technical indicators and real-time price data.
Join Our Telegram Channel
Breaking market news, AI analysis and trading signals instantly.
Join Channel