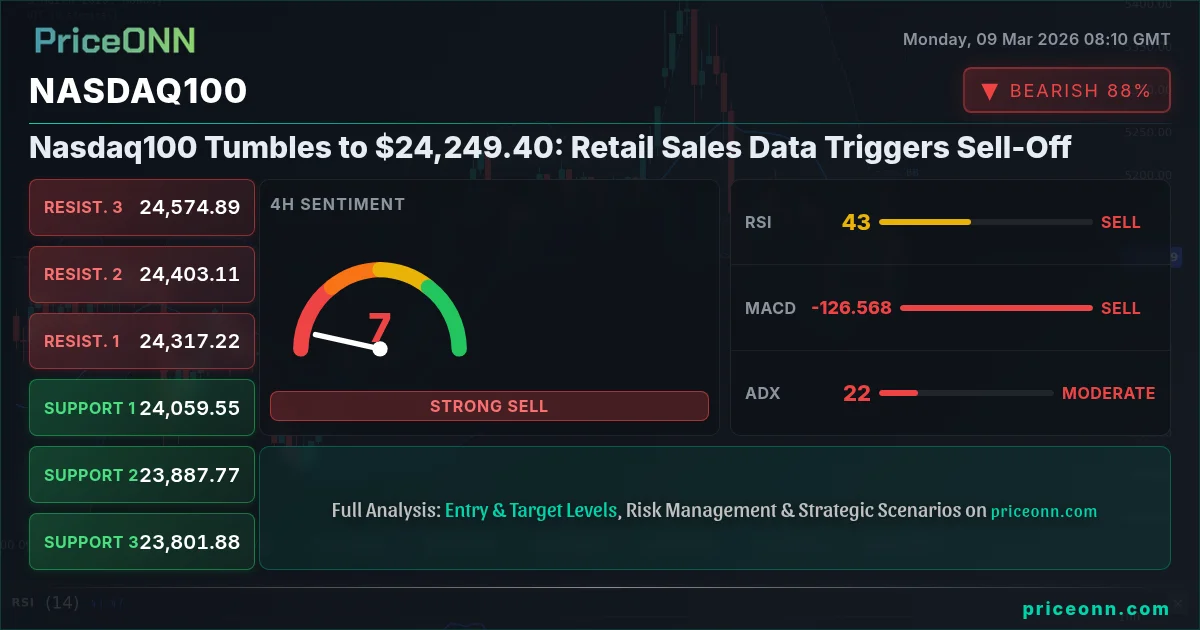
A wave of selling pressure engulfed the Nasdaq100 today, sending the index tumbling to $24,249.40. The catalyst? Weaker-than-expected retail sales data, which reignited concerns about the strength of the US economy and its potential impact on corporate earnings. This move has shaken confidence, and traders are now assessing whether this is a temporary pullback or the beginning of a more sustained downward trend.
- RSI at 37.54 on the 1H chart suggests further downside momentum in the near term.
- Key support level at 24,148.60 must hold to prevent a deeper correction.
- The MACD histogram confirms negative momentum, signaling bearish pressure.
- Rising DXY is exacerbating the Nasdaq100 decline, reflecting risk-off sentiment.
Retail Sales Data Disappoints; Fuels Economic Concerns
The core narrative driving today's sell-off is the disappointing retail sales figures. The data, released earlier this morning, revealed a significant slowdown in consumer spending, a critical component of US GDP. This immediately sparked concerns about the sustainability of the current economic expansion. Such data points are closely watched, and this one clearly acted as the match that lit the fuse. With the Nasdaq100 heavily weighted toward consumer-facing tech companies, the negative impact was amplified.
The impact of this data is further compounded by the broader macroeconomic environment. The Federal Reserve's monetary policy decisions are heavily influenced by economic data, and a weaker retail sales report could prompt a more cautious approach to future interest rate hikes. However, the market is already pricing in a certain level of hawkishness, so any perceived deviation could lead to significant volatility. According to Reuters, "Fed officials have repeatedly stressed the need for data dependency, and this report adds a layer of complexity to their decision-making process." This uncertainty is contributing to the risk-off sentiment in the market.
DXY Strength Adds Pressure; Risk-Off Sentiment Dominates
Adding fuel to the fire is the strengthening US Dollar Index (DXY), currently at 99.06. A rising DXY typically puts downward pressure on risk assets, including equities. The inverse correlation between the dollar and the Nasdaq100 is particularly evident in times of economic uncertainty, as investors flock to the perceived safety of the greenback. The SP500 is also down 1.44% adding to the bearish outlook. This cross-market dynamic underscores the pervasive risk-off sentiment dominating today's trading session.
The recent surge in crude oil prices, with WTI at $102.95, is also contributing to the inflationary pressures in the economy. While rising oil prices can benefit energy companies, they also increase input costs for businesses and reduce disposable income for consumers, further dampening economic activity. This creates a challenging environment for the Nasdaq100, which is sensitive to both economic growth and interest rate expectations.
Technical Analysis Confirms Bearish Momentum
From a technical perspective, the Nasdaq100's chart paints a concerning picture. The one-hour chart shows a strong downward trend, with the index breaking below several key support levels. Currently, the index is testing the 24,183.88 level. A decisive break below this support could trigger a further sell-off towards the next support level at 24,148.60. The ADX, currently at 40.73, indicates a strong downward trend.
The Relative Strength Index (RSI) on the one-hour chart is at 37.54, indicating that the index is approaching oversold territory. However, it's important to note that oversold conditions can persist in a strong downtrend, and a bounce is not guaranteed. The MACD histogram is also negative, confirming the bearish momentum. The Stochastic oscillator, with %K at 60.51 and %D at 22.56, is signaling a potential oversold bounce, suggesting the possibility of a short-term relief rally. However, the overall technical picture remains bearish.
On the four-hour chart, the picture is similarly bleak. The index is trading below its key moving averages, and the RSI is at 39.03. The ADX is at 20.88, confirming the strength of the downtrend. The key resistance level to watch is 24,271.63. A sustained move above this level would be needed to negate the bearish outlook.
Looking at the daily chart, the Nasdaq100 is clearly in a downtrend. The index has broken below its 50-day moving average, and the 200-day moving average is now acting as a key resistance level. The RSI on the daily chart is at 38.74, indicating that there is still room for further downside. The key support level to watch is 24,442.13. A break below this level could trigger a significant sell-off.
Trade Plan: Riding the Bearish Wave
Given the confluence of negative factors - disappointing economic data, a strengthening dollar, rising oil prices, and a bearish technical outlook - a short trading strategy on the Nasdaq100 appears to be the most prudent approach. However, traders should exercise caution and manage their risk carefully.
Enter short position if the Nasdaq100 breaks below 24,183.88 (1H chart). Target 1: 24,148.60. Target 2: 24,096.13. This scenario is supported by the ADX reading of 40.73, confirming a strong downtrend.
A sustained move above 24,271.63 (1H chart) could negate the bearish outlook. However, given the current macroeconomic backdrop, this scenario is less likely. Targets: 24,324.10 and 24,359.38.
Stop Loss: Place a stop-loss order above 24,271.63 to limit potential losses in the event of an unexpected reversal. This level acts as key resistance on the one-hour chart.
Economic Calendar: Watch Out for Tuesday's Data
Traders should also pay close attention to upcoming economic data releases, particularly Tuesday's US data release. Better than expected data could provide a temporary boost to the Nasdaq100, while weaker data could exacerbate the sell-off. According to market analysts, "The market's reaction to these data releases will be critical in determining the near-term direction of the Nasdaq100."
Frequently Asked Questions: Nasdaq100 Analysis
Is Nasdaq100 a good buy right now?
Given the current bearish trend and negative economic data, Nasdaq100 is not a strong buy right now. Wait for a clear break above 24,271.63 or a confirmed bottom before considering a long position.
What is the Nasdaq100 price forecast for this week?
The Nasdaq100 price forecast for this week is bearish. Expect further downside towards 24,148.60 and potentially 24,096.13. A break above 24,271.63 could invalidate this bearish outlook.
What are the key support and resistance levels for Nasdaq100?
Key support levels for Nasdaq100 are 24,183.88 and 24,148.60. Key resistance levels are 24,271.63 and 24,324.10. These levels are derived from the one-hour chart analysis.
Why is Nasdaq100 moving today?
Nasdaq100 is moving lower today due to disappointing retail sales data, a strengthening US dollar, and rising oil prices. These factors are contributing to a risk-off sentiment in the market.
Technical Outlook Summary
| Indicator | Value | Signal |
|---|---|---|
| RSI (14) | 37.54 | Bearish |
| MACD Histogram | Negative | Bearish |
| Stochastic | 60.51 / 22.56 | Potential Reversal |
| ADX | 40.73 | Strong Down Trend |
| Bollinger | Middle Band | Below |
Key Levels
Support Levels
Resistance Levels
Track markets in real-time
AI-powered analysis, technical indicators and real-time price data.
Join Our Telegram Channel
Breaking market news, AI analysis and trading signals instantly.
Join Channel