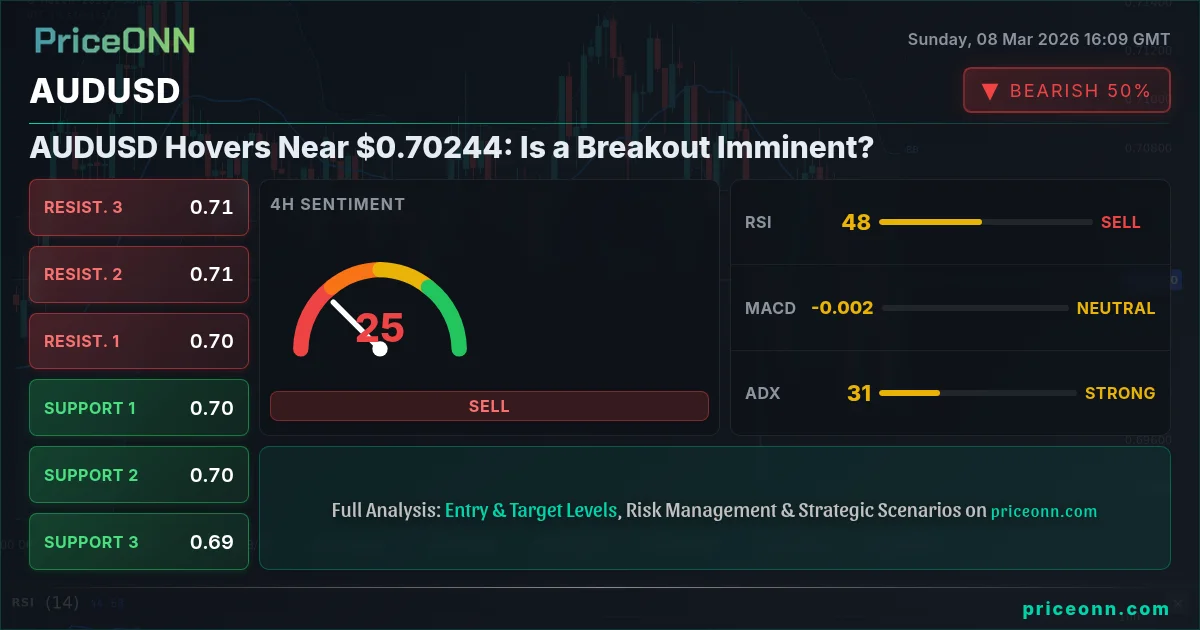
For those tracking AUDUSD, the pair's recent dance around $0.70244 has been a study in patience. Is this a coiled spring ready to unleash, or just another sideways shuffle? I want to share a few thoughts on what I am watching.
- RSI at 51.7 on the 1H chart suggests neutral momentum, but watch for a break above 60 for confirmation.
- Key resistance to watch sits at 0.70296, break above confirms bullish bias.
- The 4H chart shows a strong bearish trend with ADX at 30.73, so the upside is capped unless this reverses.
- Upcoming trade data and risk sentiment are the primary drivers influencing AUDUSD's correlation with DXY.
AUDUSD today analysis reveals a market stuck in neutral, trading around $0.70244 as of last Friday's close. The Australian dollar has been struggling to gain significant traction against the US dollar, and the key question is whether upcoming economic data will provide the catalyst for a breakout. Let's dive into the factors influencing this pair and what traders should be watching.
AUDUSD Weekly Outlook: Trade Data in Focus
The main event for AUDUSD next week will undoubtedly be the release of Australian trade data. As PriceONN highlighted earlier this week, the Australian dollar has been sensitive to trade balance figures, with a narrowing surplus in January leading to some Aussie weakness. Traders will be looking for signs of improvement in export demand and overall economic activity. Keep an eye on iron ore prices as well, as noted by PriceONN, as they often serve as a leading indicator for the Australian economy. The impact of China's growth target on the Australian dollar is also a crucial factor.
However, it's not just Australian data that will move AUDUSD. Global risk sentiment, particularly concerning tensions in the Middle East and their impact on oil prices, is playing a significant role. The oil crisis is shaking forex markets, as noted in recent news reports, and this risk-off sentiment could weigh on the Aussie, which is often seen as a riskier asset. The strength of the US dollar, as measured by the DXY, also remains a critical factor. With the DXY currently at 98.57, any further gains in the dollar could put additional pressure on AUDUSD.
According to recent news, the Canadian economy is forging independence after Trump tariff threats, which is an interesting parallel to Australia's reliance on trade with China. While the specifics differ, both economies are navigating complex trade relationships and seeking to diversify their economic partnerships.
Technical Analysis: A Battle Between Bulls and Bears
Looking at the technical picture, AUDUSD presents a mixed bag of signals. On the 1H chart, the trend is neutral, but the RSI at 51.7 shows a slight upward bias. The MACD is also showing positive momentum, further indicating a potential bullish move. However, the ADX at 14.88 suggests a weak trend, meaning that any breakout attempt could be short-lived. The nearest resistance on this timeframe sits at 0.70296, with further levels at 0.70349 and 0.70422.
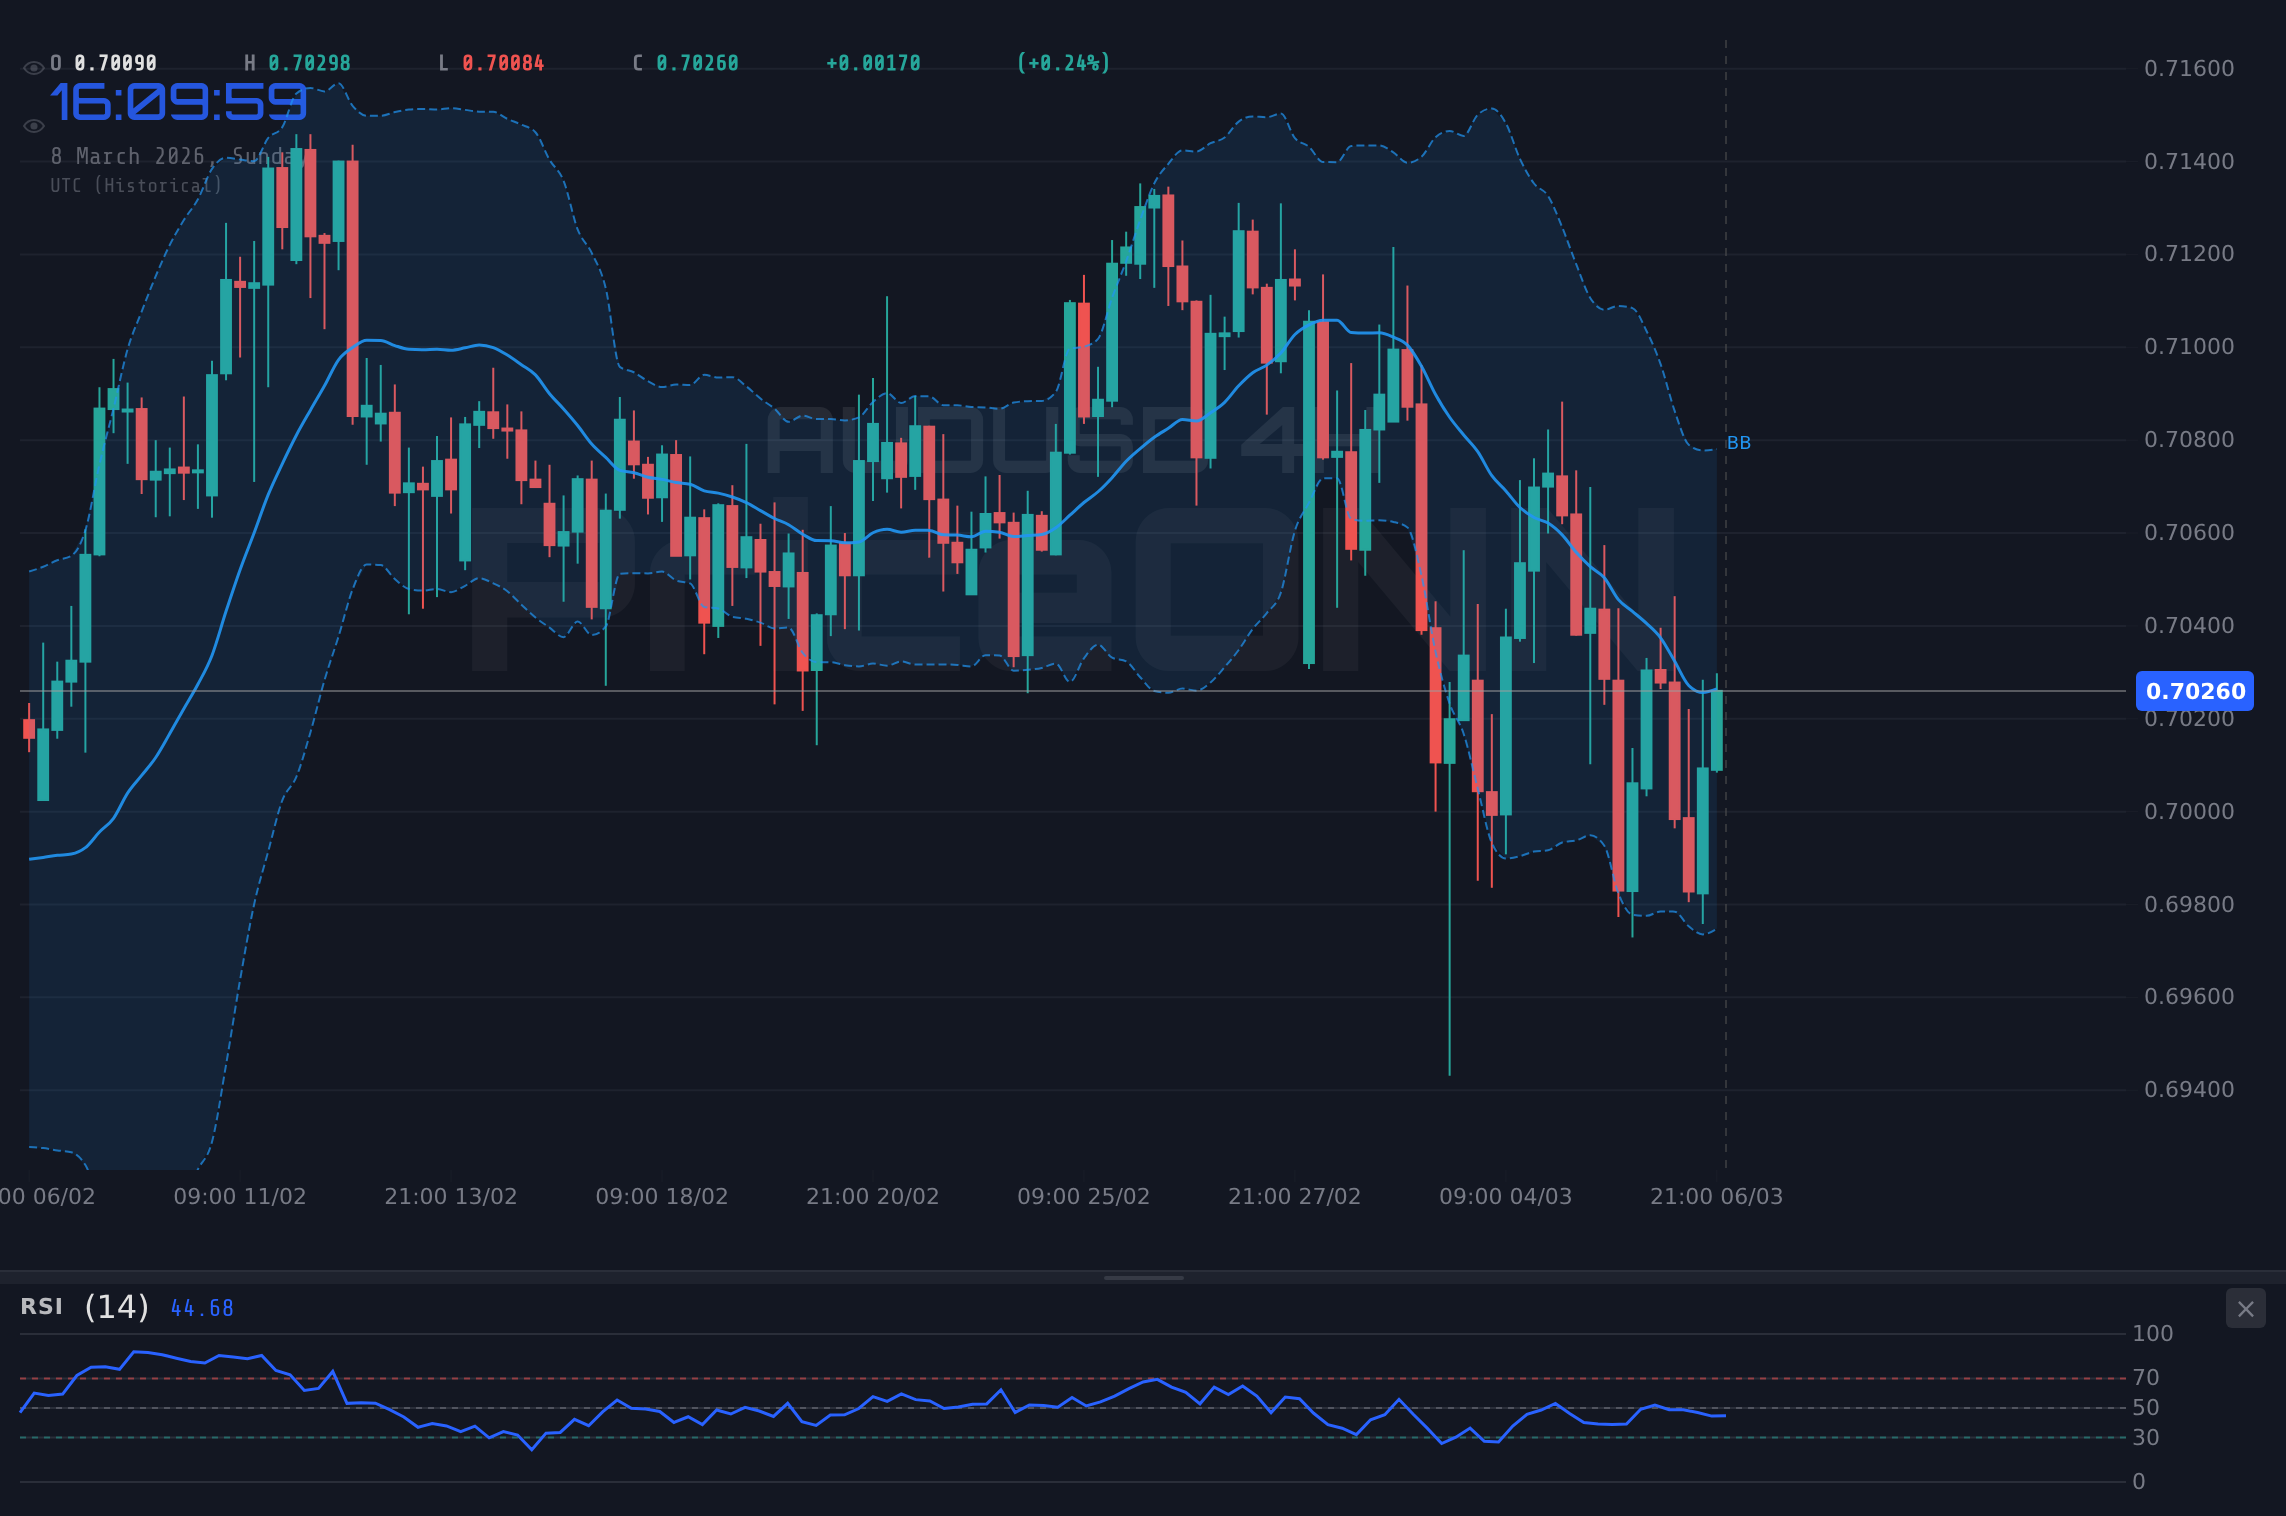
Stepping back to the 4H chart, the picture becomes more bearish. Here, the trend is downward with an ADX of 30.73, indicating a relatively strong trend. The RSI at 44.46 is also leaning bearish, and the Stochastic oscillator is signaling oversold conditions. This suggests that the pair may be due for a bounce, but the overall trend remains downward. Key resistance on this timeframe is at 0.70098, with support at 0.69682.
The daily chart paints a similar picture to the 4H timeframe. The trend is neutral, but the ADX at 31.48 indicates a strong bearish trend. The RSI at 50.82 is also leaning bearish, and the Stochastic oscillator is signaling oversold conditions. Key resistance on this timeframe is at 0.7072, with support at 0.69566.
The multi-timeframe analysis reveals a market in conflict. The short-term charts suggest a potential bullish move, while the longer-term charts indicate a bearish bias. This highlights the importance of waiting for confirmation before taking a position. A breakout above 0.70296 on the 1H chart would signal a potential bullish move, while a break below 0.69682 on the 4H chart would confirm the bearish trend.
Key Levels to Watch
Let's break down the key support and resistance levels for AUDUSD based on the provided data:
These levels represent potential areas where price action could stall or reverse. Traders should watch for breakouts above resistance or breakdowns below support to signal the direction of the next move.
Trade Plan: Waiting for Confirmation
Given the conflicting signals and the upcoming economic data releases, the best approach for AUDUSD may be to wait for confirmation before taking a position. Here are two potential scenarios:
If AUDUSD breaks above the 0.70296 resistance level on the 1H chart, this could signal a potential bullish move. The first target would be 0.70349, followed by 0.70422. A break above 0.70422 would confirm the bullish trend and could lead to further gains.
If AUDUSD fails to break above 0.70296 and instead breaks below the 0.7017 support level, this could signal a potential bearish move. The first target would be 0.70097, followed by 0.70044. A break below 0.70044 would confirm the bearish trend and could lead to further losses.
It's important to note that these scenarios are contingent on the upcoming economic data releases and global risk sentiment. Traders should exercise caution and manage their risk accordingly. Next week's high impact USD events could have a significant effect on AUDUSD.
The AUDUSD Outlook: Patience Will Be Rewarded
The current technical picture for AUDUSD is complex, with conflicting signals across different timeframes. The pair is trading near $0.70244, and the key question is whether it will break out to the upside or continue its sideways movement. The upcoming trade data releases and global risk sentiment will likely be the deciding factors.
Here's my take: While the short-term charts suggest a potential bullish move, the longer-term charts indicate a bearish bias. This means that traders should exercise caution and wait for confirmation before taking a position. A breakout above 0.70296 on the 1H chart would signal a potential bullish move, while a break below 0.7017 on the 1H chart would confirm the bearish trend.
The ADX on the 1H chart is only 14.88. This suggests a weak trend, meaning that any breakout attempt could be short-lived. Wait for the ADX to increase before committing to a trade.
Manage your risk, wait for your setup- the market always gives a second chance.
Frequently Asked Questions: AUDUSD Analysis
Is AUDUSD a good buy right now?
AUDUSD is currently trading near $0.70244 and presents a mixed picture. While short-term indicators suggest potential upside, longer-term trends lean bearish, indicating caution is warranted. It is recommended to wait for a confirmed breakout above 0.70296 before considering a buy.
What is the AUDUSD price forecast for this week?
The AUDUSD price forecast for this week is highly dependent on upcoming trade data and global risk sentiment. A bullish scenario could see the pair testing 0.70349 and 0.70422, while a bearish scenario could lead to a test of 0.7017 and 0.70097. The probability of either scenario is roughly 50/50 until the data is released.
What are the key support and resistance levels for AUDUSD?
Key support levels for AUDUSD are 0.7017, 0.70097, and 0.70044. Key resistance levels are 0.70296, 0.70349, and 0.70422. These levels represent potential areas where price action could stall or reverse, and traders should watch for breakouts or breakdowns to signal the next move.
Why is AUDUSD moving today?
AUDUSD is currently moving sideways due to conflicting technical signals and a lack of clear catalysts. Short-term indicators suggest a potential bullish move, while longer-term charts indicate a bearish bias. Traders are awaiting upcoming trade data and monitoring global risk sentiment for further direction.
Track markets in real-time
AI-powered analysis, technical indicators and real-time price data.
Join Our Telegram Channel
Breaking market news, AI analysis and trading signals instantly.
Join Channel