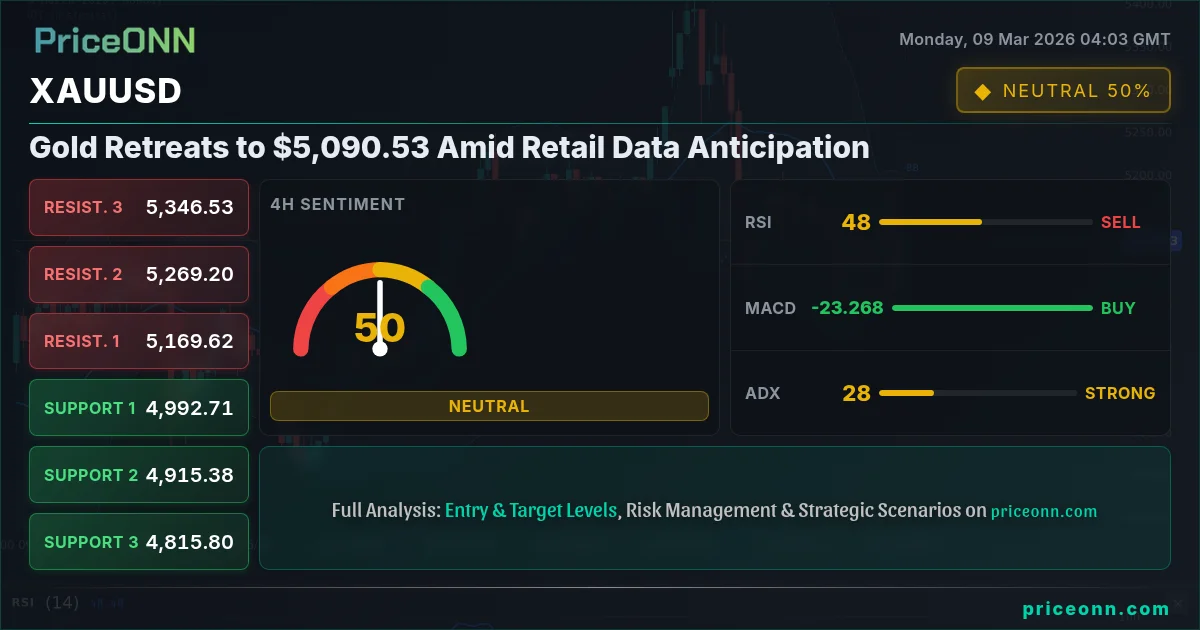
Gold currently trades around $5,090.53, facing headwinds as the market anticipates crucial retail data releases. This data could significantly influence the Federal Reserve's policy decisions, impacting the dollar and subsequently, gold prices. The "gold inflation hedge 2026" narrative is being tested as market participants weigh economic data against geopolitical risks.
- RSI at 51.77 on the daily chart suggests a neutral stance, hinting at potential consolidation around current levels.
- Key support lies at $5,066.77, a break below which could trigger further declines.
- MACD remains negative, indicating sustained bearish momentum in the short term.
- DXY strength, currently at 99.37, continues to exert downward pressure on gold.
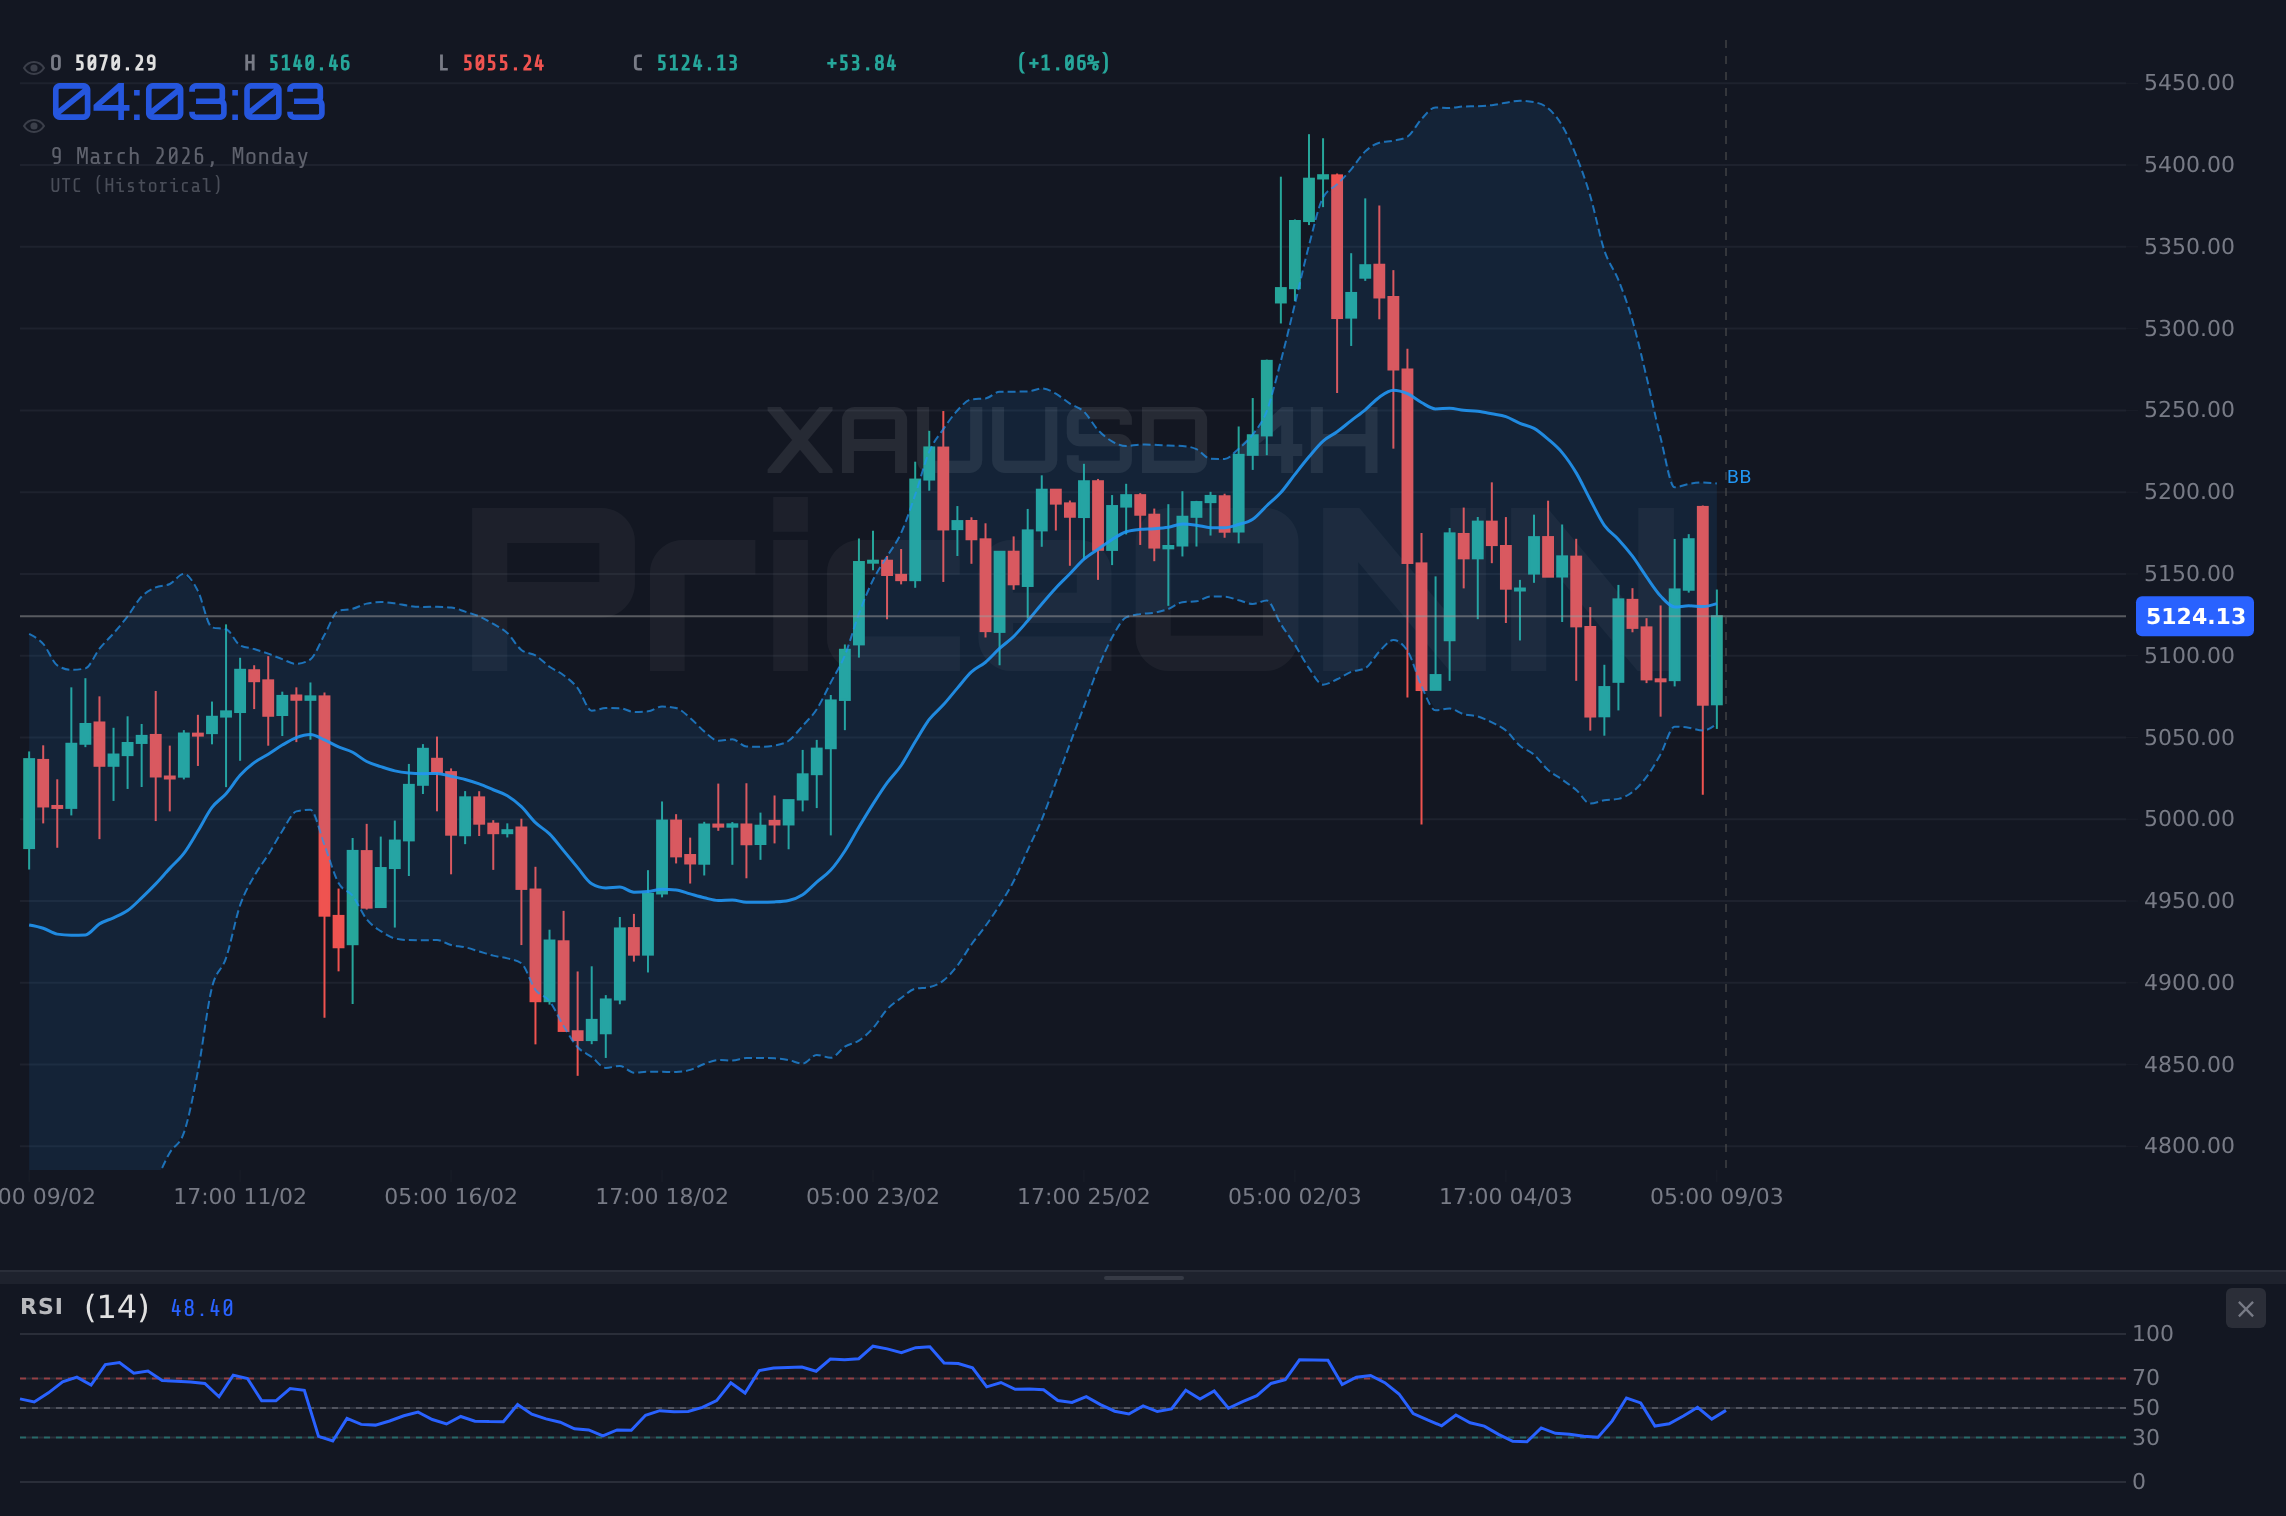
Technical Overview: XAUUSD at a Crossroads
The technical outlook for XAUUSD reveals a market at a critical juncture. The 1-hour chart indicates a neutral trend with the price hovering around $5,090.53. The RSI(14) stands at 44.88, suggesting neither overbought nor oversold conditions, while the MACD exhibits negative momentum, reinforcing the bearish sentiment. The ADX at 25.77 points to a moderately strong downtrend, indicating that the current bearish momentum has some conviction behind it.
On the 4-hour timeframe, the trend also appears neutral. The RSI(14) is at 43.48, mirroring the hourly chart's neutral stance. However, the Stochastic oscillator presents a conflicting signal with %K at 69.82 and %D at 47.83, suggesting a bullish crossover. This divergence requires traders to exercise caution and seek additional confirmation before making trading decisions. The ADX, however, reads 27.06, further supporting the strong downtrend detected in the 1H timeframe.
Stepping back to the daily chart, we see a neutral trend prevailing. The RSI(14) sits at 51.77, indicating a lack of clear directional bias. The MACD remains negative, signaling continued bearish pressure, while the Stochastic oscillator displays a bearish signal with %K at 27.8 and %D at 49.42. The ADX at 13.98 reveals a weak trend, suggesting that the market is consolidating and lacking strong directional conviction. This multi-timeframe analysis paints a mixed picture, requiring traders to carefully assess the prevailing conditions before committing to a position.
Key Levels and Potential Breakout Scenarios
Identifying key support and resistance levels is crucial for understanding potential breakout scenarios. On the 1-hour chart, immediate support lies at $5,066.77, followed by $5,039.19 and $5,023.13. Resistance is observed at $5,110.41, $5,126.47, and $5,154.05. These levels represent potential areas where price could stall, reverse, or accelerate, depending on the prevailing market sentiment.
The daily chart reveals a broader perspective on support and resistance. Key support levels are identified at $5,097.86, $5,024.48, and $4,986.24. Resistance levels are observed at $5,209.48, $5,247.72, and $5,321.1. These levels are significant as they represent longer-term areas of interest for both buyers and sellers. A break above $5,209.48 could signal a potential bullish reversal, while a break below $5,024.48 could indicate further downside potential.
With DXY at 99.37, gold faces sustained pressure. As the dollar index strengthens, gold typically weakens due to its inverse correlation. This relationship is a key factor influencing the current price action. The SP500, currently at 6606.25, is also showing weakness, which could lead to some safe-haven buying in gold, but the dollar's strength is currently the dominant force.
Trade Plan: Riding the Downtrend
Given the overall technical picture, a short-term bearish trading strategy appears to be the most prudent approach. The key is to identify specific entry triggers, profit targets, and stop-loss levels to manage risk effectively.
Enter short position if price breaks below $5,066.77 (1H support). Target levels are $5,039.19 (S2) and $5,023.13 (S3). Expect continued downward pressure amid strong DXY and risk-off sentiment.
A long position could be considered only if price breaks above $5,110.41 (1H resistance). Target levels are $5,126.47 (R2) and $5,154.05 (R3). This scenario requires a significant shift in market sentiment and a weakening dollar.
Economic Calendar Impact
The economic calendar plays a crucial role in shaping market expectations and influencing asset prices. This week's key event is the US retail data release on Tuesday, March 10th. Strong retail sales data could reinforce the dollar's strength, placing further downward pressure on gold. Conversely, weak data could prompt a reversal in the dollar and provide a temporary boost to gold prices.
The Japanese monetary policy release on Monday, March 9th, will also be closely watched. Any deviation from the Bank of Japan's current stance could have implications for global currency markets and potentially impact gold prices. Additionally, the Eurozone industrial production data on Wednesday, March 11th, could provide insights into the health of the European economy and influence the EURUSD pair, which has an indirect correlation with gold.
Geopolitical and Fundamental Factors Weighing on Gold
Escalating tensions in the Middle East, as highlighted by recent news regarding the oil crisis, have historically fueled safe-haven demand for gold. However, the current strength of the dollar is offsetting this traditional relationship. As reported by Reuters, concerns over global growth are mounting, which typically supports gold, but the dollar's dominance is overshadowing these factors.
Furthermore, rising bond yields are also contributing to the downward pressure on gold. As yields increase, the opportunity cost of holding gold, which provides no yield, rises, making it less attractive to investors. The combination of a strong dollar, rising yields, and subdued inflation expectations is creating a challenging environment for gold.
Strategic Considerations for Different Trader Types
Different trader types should adopt different strategies based on their risk tolerance and time horizon. Scalpers may look for short-term opportunities around key support and resistance levels, taking advantage of intraday volatility. Swing traders may focus on the 4-hour and daily charts, seeking to capture larger price swings. Long-term investors may view the current pullback as an opportunity to accumulate gold at lower prices, anticipating a potential resurgence in safe-haven demand or a weakening dollar.
Having tracked XAUUSD through the 2024 rate cycle, it's clear that patience looks like it will be rewarded here. Manage your risk, wait for your setup- the market always gives a second chance.
Frequently Asked Questions: XAUUSD Analysis
Is XAUUSD a good buy right now?
Given the current downtrend and strong dollar, XAUUSD is not a clear buy right now. A break above $5,110.41 or a weakening DXY would be needed to confirm a bullish entry.
What is the XAUUSD price forecast for this week?
The XAUUSD price forecast is bearish in the short-term, with potential targets at $5,039.19 and $5,023.13. This forecast is based on technical indicators and a strong dollar.
What are the key support and resistance levels for XAUUSD?
Key support levels for XAUUSD are $5,066.77, $5,039.19, and $5,023.13. Key resistance levels are $5,110.41, $5,126.47, and $5,154.05. These levels are based on the 1H chart.
Why is XAUUSD moving today?
XAUUSD is moving lower today due to a strengthening dollar (DXY at 99.37) and anticipation of key US retail data on Tuesday. Rising bond yields are also contributing to the pressure.
Technical Outlook Summary
| Indicator | Value | Signal |
|---|---|---|
| RSI (14) | 51.77 | Neutral |
| MACD Histogram | Negative | Bearish |
| Stochastic | 27.8/49.42 | Bearish |
| ADX | 13.98 | Weak Trend |
| Bollinger | Middle Band | Watch |
Key Levels
Support Levels
Resistance Levels
Track markets in real-time
AI-powered analysis, technical indicators and real-time price data.
Join Our Telegram Channel
Breaking market news, AI analysis and trading signals instantly.
Join Channel