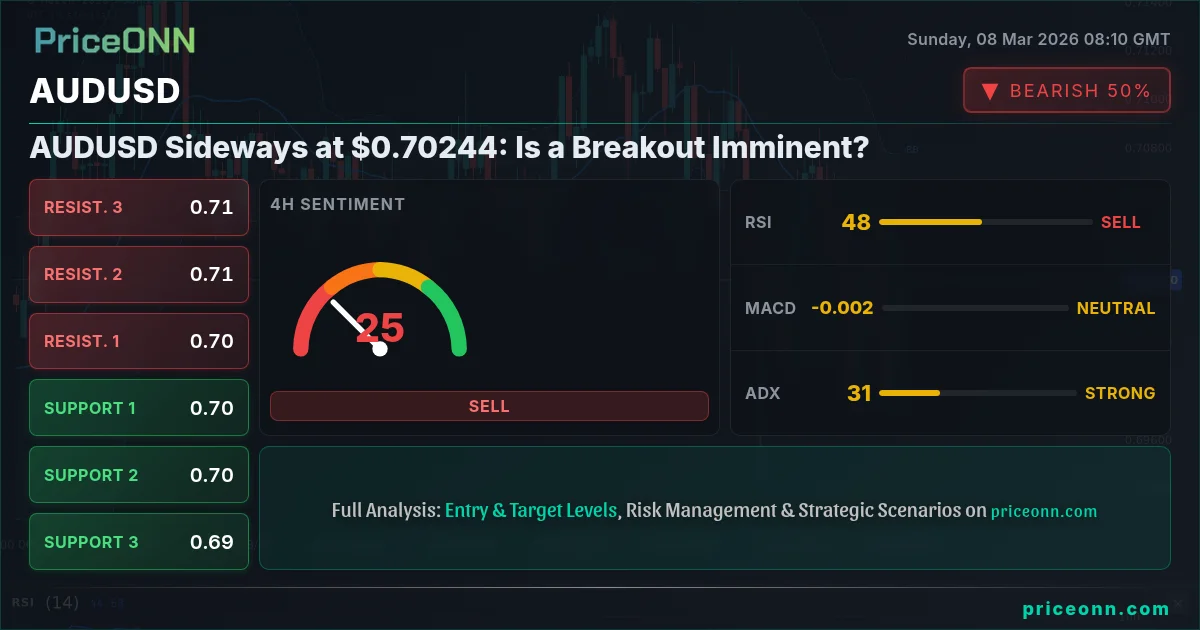
AUDUSD is currently caught in a sideways grind at $0.70244, leaving traders wondering if a breakout is imminent. The pair's recent price action suggests indecision, with neither bulls nor bears able to establish sustained control. The next week promises to be pivotal, with trade data and global sentiment poised to inject volatility into the market.
- RSI at 51.7 signals neutral momentum, indicating a lack of clear directional bias.
- Key resistance sits at $0.70296, a level that has capped rallies in the near term.
- MACD histogram shows positive momentum, but the signal line is closely intertwined, suggesting caution.
- Global risk sentiment and upcoming trade data are primary drivers of AUDUSD's short-term direction.
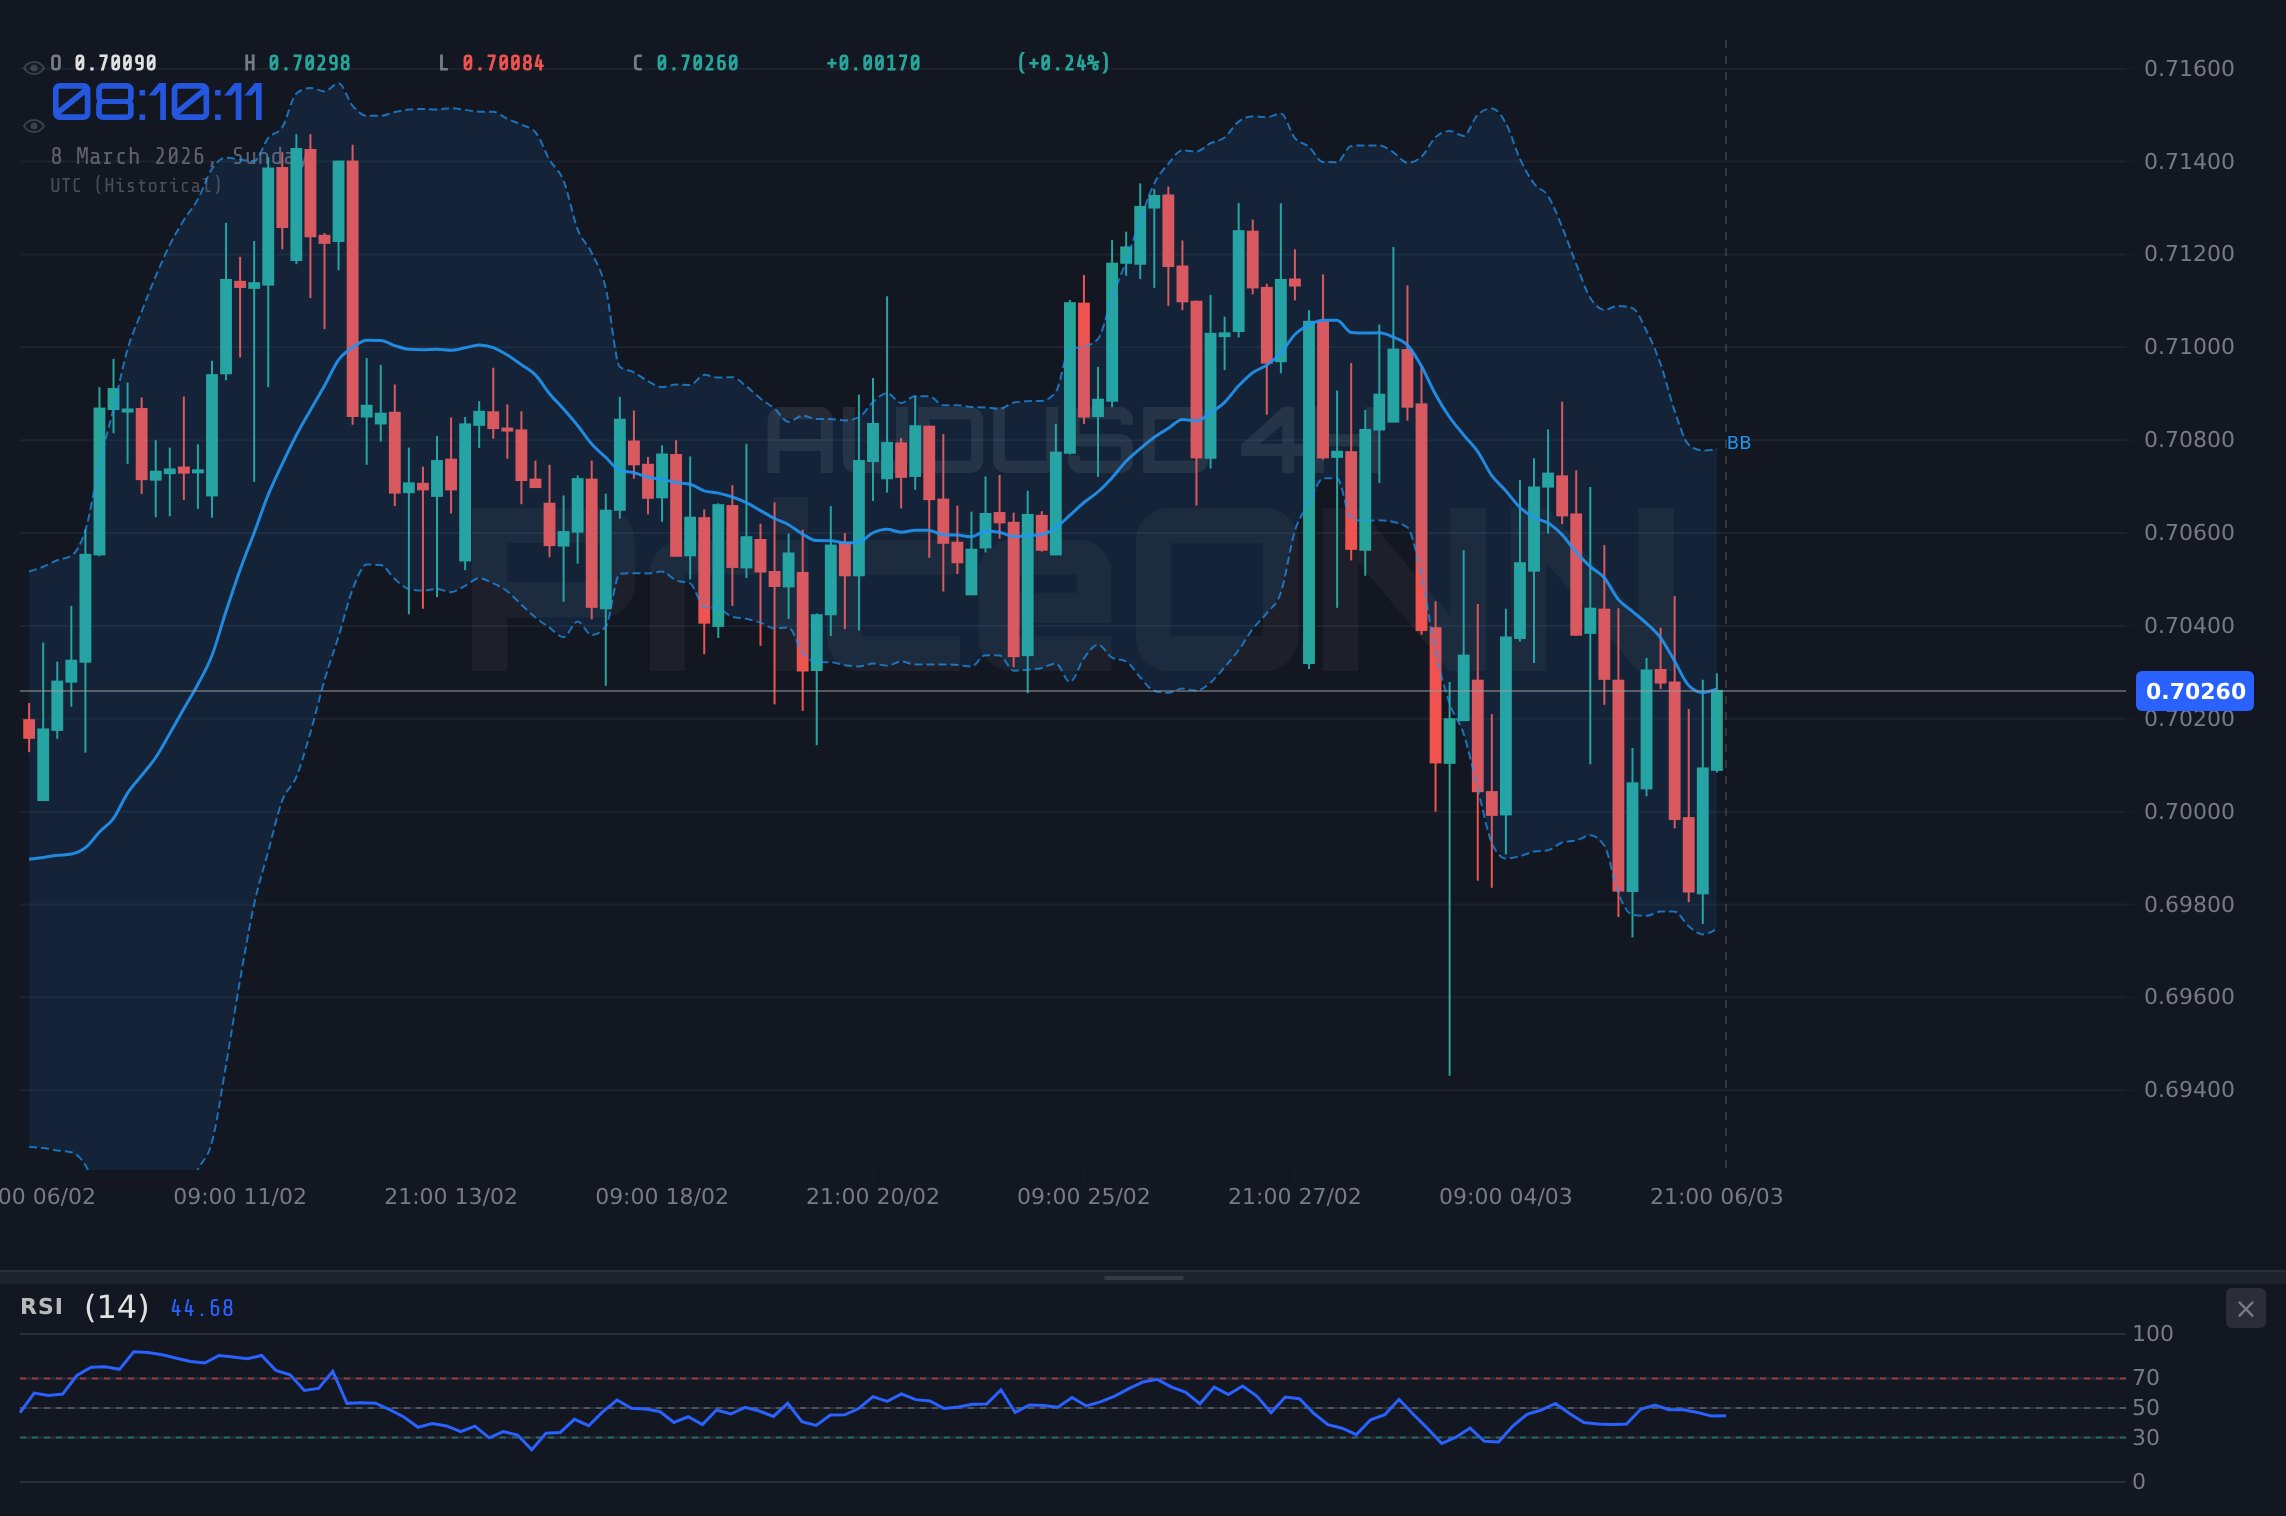
Last Week's Price Action: A Choppy Affair
Last week was characterized by choppy price action in AUDUSD, with the pair oscillating within a relatively narrow range. The Australian Dollar initially benefited from positive risk sentiment, fueled by hopes of a resolution to global trade tensions. However, these gains were short-lived, as concerns about the global economic outlook resurfaced, weighing on the Aussie. According to PriceONN market news, the Australian Dollar strengthened against its peers ahead of US NFP data. The initial optimism faded as the week progressed, with the AUD/USD pair eventually settling near its opening levels. PriceONN also noted that the AUD/USD remains sticky to the 20-day EMA for almost a week. This week's close near $0.70244 reflects the ongoing tug-of-war between bullish and bearish forces.
Upcoming Economic Data: A Potential Catalyst
The economic calendar for the coming week is packed with high-impact data releases that could provide the catalyst for a breakout in AUDUSD. Traders will be closely watching the upcoming trade data and inflation figures from both Australia and the United States. Any surprises in these data releases could trigger significant volatility in the pair. Specifically, the market is awaiting the JPY data on Monday, March 9, and the USD data on Tuesday, March 10. Furthermore, the EUR data on Wednesday, March 11, may indirectly influence the AUDUSD. The market is also looking for the USD data on Wednesday, March 11. These events are likely to set the tone for AUDUSD trading in the week ahead.
The Bullish Scenario: A Break Above Resistance
The bullish scenario for AUDUSD hinges on a decisive break above the immediate resistance at $0.70296. A sustained move above this level could pave the way for a test of the next resistance at $0.70349. Positive trade data from Australia would likely support this bullish outlook, as would any signs of easing global trade tensions. The one-hour chart shows an uptrend, with the stochastic at K=84.44 and D=56.48 showing a bullish signal. If the bulls can maintain momentum, a push towards the daily resistance at $0.7072 could be in the cards. The RSI on the daily timeframe, currently at 50.82, suggests there is room for further upside before the pair becomes overbought.
The Bearish Scenario: A Slide Below Support
On the downside, a break below the immediate support at $0.7017 could trigger a bearish move in AUDUSD. Further support lies at $0.70097 and $0.70044. Weak trade data or a deterioration in global risk sentiment would likely fuel this bearish scenario. The 4-hour chart shows a downtrend, with the ADX at 30.73 indicating a strong downtrend. If the bears can gain control, a move towards the daily support at $0.69566 could be possible. A break below this level would open the door for a deeper correction towards the $0.6907 level.
Multi-Timeframe Analysis: Conflicting Signals
A multi-timeframe analysis of AUDUSD reveals conflicting signals, further underscoring the pair's current indecision. The hourly chart is showing bullish momentum, with the Stochastic oscillator signaling a potential oversold bounce. However, the 4-hour chart paints a more bearish picture, with the ADX indicating a strong downtrend. The daily chart is neutral, with the RSI hovering near the 50 level. This mixed picture suggests that traders should exercise caution and wait for further confirmation before taking a directional bias. The 1H timeframe shows that RSI(14) is at 51.7, the MACD shows positive momentum, the Bollinger band is above the middle band, and the Stochastic is showing K=84.44, D=56.48. The 4H timeframe shows that RSI(14) is at 44.46, the MACD shows negative momentum, the Bollinger band is above the middle band, and the Stochastic is showing K=23.15, D=30.85. The 1D timeframe shows that RSI(14) is at 50.82, the MACD shows negative momentum, the Bollinger band is below the middle band, and the Stochastic is showing K=47.8, D=62.69. The ADX is at 31.48, indicating a strong downtrend.
The DXY Factor: A Key Influence
The Dollar Index (DXY) is a key factor influencing AUDUSD. A rising DXY typically puts downward pressure on AUDUSD, while a falling DXY tends to support the pair. Currently, the DXY sits at 98.57, showing a slight downtrend in the 1H timeframe. The RSI(14) is at 41.01, and the Stochastic is showing K=20.05, D=32.4. However, the 4H timeframe shows an uptrend, with the ADX at 44.54 indicating a strong uptrend. The daily timeframe also shows an uptrend. Therefore, the DXY's direction is uncertain, adding to the confusion in AUDUSD. Traders should closely monitor the DXY for clues about the future direction of AUDUSD. Furthermore, the SP500, currently at 6743.17, shows a downtrend, which may influence the AUDUSD pair.
Trade Plan: Waiting for Confirmation
Given the conflicting signals and the upcoming economic data releases, a conservative approach is warranted. Traders should wait for a clear breakout above $0.70296 or a breakdown below $0.7017 before initiating a position. The high importance of the upcoming economic data means that there will be increased volatility and potential for rapid price swings.
A break above $0.70296, confirmed by strong volume, could target $0.70349 and potentially $0.7072. This would require positive Australian trade data and a weaker DXY.
A break below $0.7017, confirmed by increased selling pressure, could target $0.70097 and $0.69566. This would require weak Australian data or a stronger DXY.
Frequently Asked Questions: AUDUSD Analysis
Is AUDUSD a good buy right now?
Given the current sideways movement and conflicting signals, AUDUSD is not a clear buy at $0.70244. Waiting for a breakout above $0.70296 or a breakdown below $0.7017 is prudent before taking a position.
What is the AUDUSD price forecast for this week?
The AUDUSD price forecast for this week is highly dependent on upcoming economic data. A break above $0.70296 could target $0.70349, while a break below $0.7017 could target $0.70097.
What are the key support and resistance levels for AUDUSD?
Key support levels for AUDUSD are $0.7017, $0.70097, and $0.70044. Key resistance levels are $0.70296, $0.70349, and $0.7072.
Why is AUDUSD moving today?
AUDUSD is moving sideways today due to conflicting technical signals and uncertainty surrounding upcoming economic data releases, particularly trade data and inflation figures.
Track markets in real-time
AI-powered analysis, technical indicators and real-time price data.
Join Our Telegram Channel
Breaking market news, AI analysis and trading signals instantly.
Join Channel