Brent Crude Oil: $65.73 Holds as Mideast Tensions Fuel Bullish Run
Brent crude oil maintains its bullish momentum, closing last Friday at $65.73 amid escalating Middle East tensions. Will upcoming trade data confirm the upward trend?
Brent crude oil closed last Friday at $65.73, defying broader market anxieties fueled by geopolitical instability in the Middle East. As tensions escalate, disrupting supply chains and raising tanker rates to record highs, traders are keenly watching for upcoming trade data to validate the commodity's upward trajectory. The question now: can this rally sustain itself, or is it a temporary spike driven by fear?
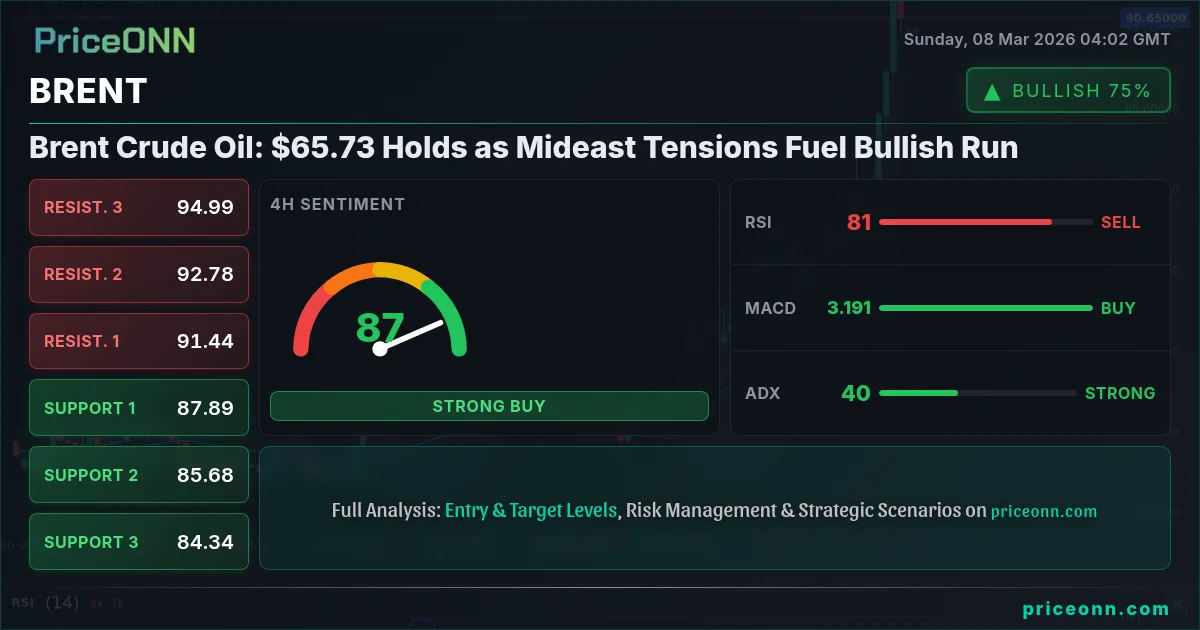
- RSI at 71.16 on the 1H chart indicates overbought conditions, suggesting potential for a short-term pullback.
- Immediate resistance lies at $65.41, a level that needs to be breached for further upside.
- ADX at 19.03 on the 1H chart signals a weak trend, implying consolidation before another significant move.
- Geopolitical risks in the Middle East continue to be the primary driver of BRENT price action, warranting close monitoring of news flow.
The recent surge in Brent crude oil prices is primarily attributed to escalating tensions in the Middle East, particularly disruptions in key shipping lanes. According to PriceONN market news, the Hormuz freeze has sent Brent-Dubai spreads to multi-year highs, reflecting the market's anxiety over potential supply disruptions. The escalation is not just a regional concern; it has global implications, influencing inflation expectations and shifting risk sentiment across various asset classes. With the SP500 down by 1.07% and Nasdaq100 falling 1.25%, there's a noticeable flight to safety and commodities like oil are benefiting.
From a technical perspective, the 1-hour chart paints a mixed picture. The RSI is hovering in overbought territory at 71.16, suggesting that the recent rally might be losing steam. However, the MACD still exhibits positive momentum, indicating that buyers are not entirely exhausted. The ADX, currently at 19.03, reveals a weak trend, implying that the price action is more of a consolidation phase than a sustained breakout. A trader friend of mine would say, “This isn’t a runaway train yet; it’s just warming up.” The immediate resistance level to watch is $65.41, as a break above this could trigger another leg up. Failure to overcome this resistance could lead to a retest of the $65.20 support.
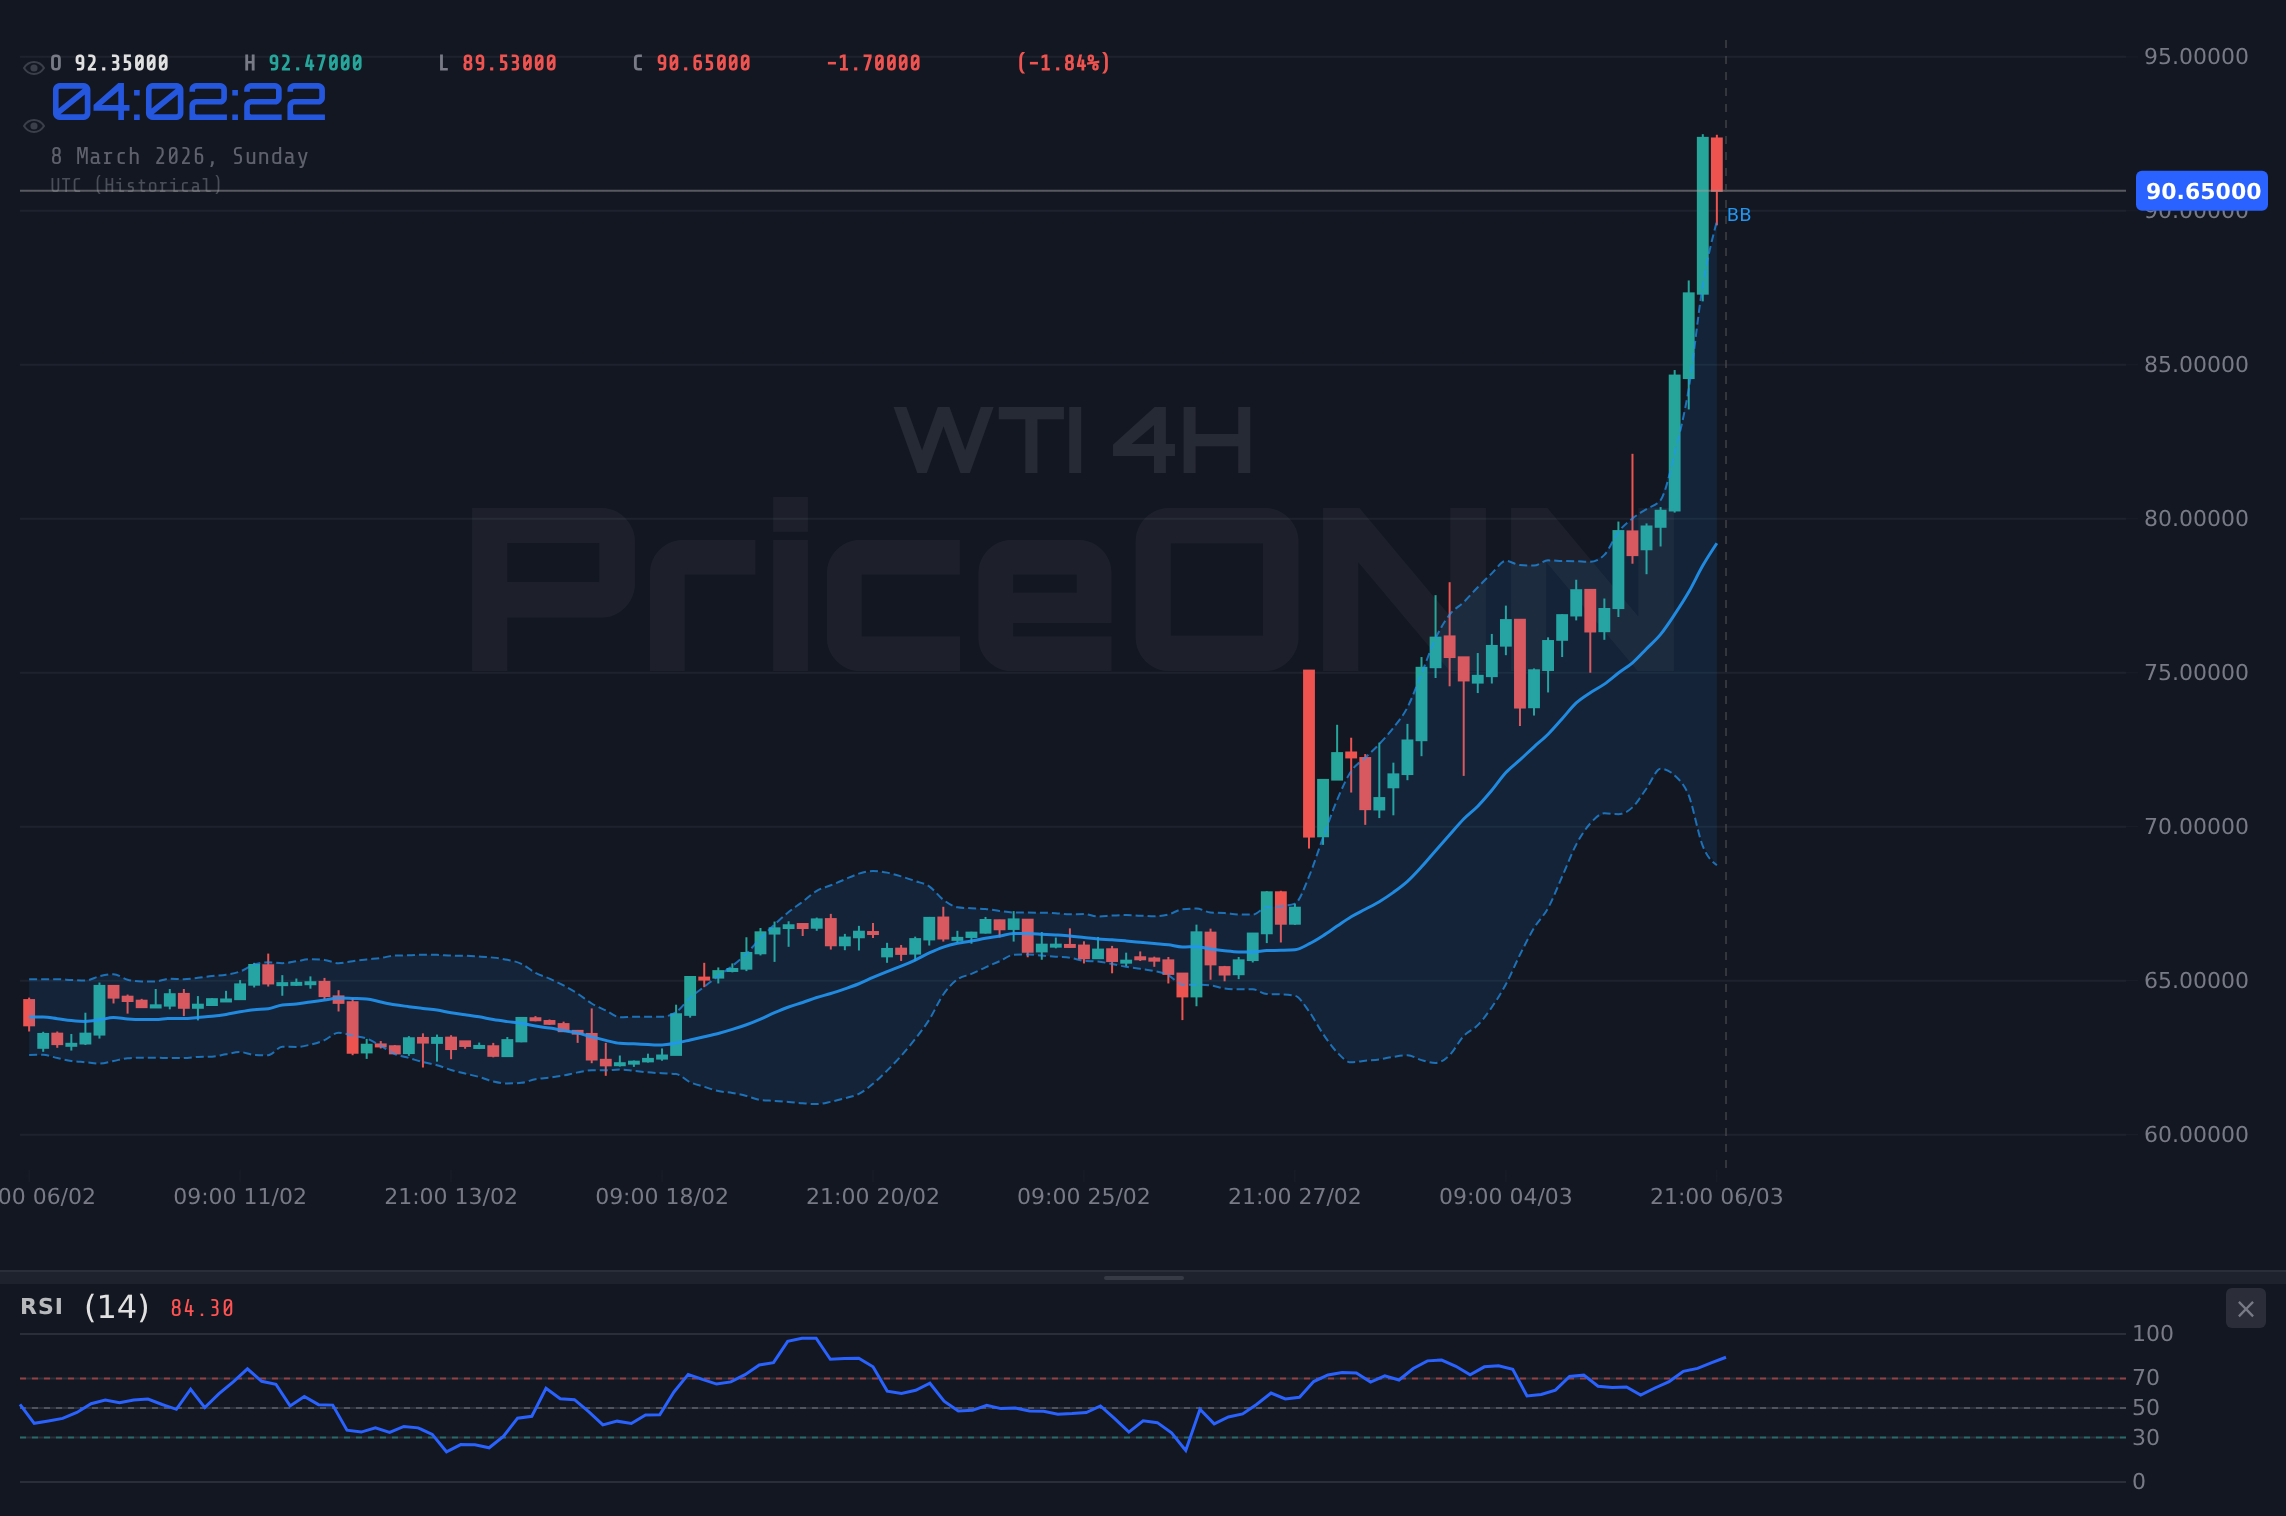
Stepping back to the 4-hour timeframe provides a broader context. Here, the trend is decidedly bullish with a strength of 82%. Support levels are identified at $64.50, $64.20, and $63.99, providing a safety net for any potential pullbacks. The Stochastic oscillator, with K=68.29 and D=44.75, generates a bullish signal, further reinforcing the upward bias. However, the ADX remains relatively low at 13.59, suggesting that the trend, while bullish, lacks conviction. “It's like a hesitant dance,” as another trader buddy once said, “the music is playing, but the dancers are still unsure.” Resistance levels on this timeframe are pegged at $65.01, $65.22, and $65.52. Breaching these could open the door to higher targets.
On the daily chart, the bullish trend persists with an even stronger signal, boasting a trend strength of 89%. Key support levels are identified at $63.61, $62.74, and $61.80, while resistance looms at $65.42, $66.36, and $67.23. Despite the prevailing bullish sentiment, the Stochastic oscillator presents a conflicting signal, with K=54.52 and D=58.52 indicating a potential pullback. The RSI, at 59.99, is neutral, providing no clear directional bias. The ADX, at 28.64, confirms the presence of a strong uptrend, reinforcing the need to monitor price action closely around key resistance levels.
The economic calendar adds another layer of complexity to the BRENT outlook. While there were no high-impact USD events over the past three days, the market is closely watching upcoming JPY data on Monday, March 9th, and USD data on Tuesday, March 10th. Any surprises in these data releases could trigger volatility in the forex markets, indirectly impacting commodity prices. Moreover, the EUR data scheduled for Wednesday, March 11th, will provide further insights into the European economic outlook, which could influence risk sentiment and investor appetite for commodities.
The escalating tensions in the Middle East are undoubtedly the primary catalyst driving BRENT prices higher. As PriceONN Market News reported on March 7th, the potential for a Middle East conflict could send Brent to $100 a barrel. This geopolitical risk premium is now firmly embedded in the price, making it essential for traders to monitor news flow closely. Any signs of de-escalation could trigger a sharp reversal, while further escalation could fuel another leg up. The forex market is already feeling the heat, with EUR/CAD plunging amidst the oil crisis. This highlights the interconnectedness of global markets and the need to consider cross-asset correlations when trading commodities.
Looking at the broader market context, the DXY (Dollar Index) is currently at 98.57, reflecting a slight downward trend. This weakness in the dollar is providing some support to commodity prices, as a weaker dollar makes commodities more attractive to international buyers. However, if the DXY were to reverse its course and strengthen, it could put downward pressure on BRENT. Traders should therefore monitor DXY price action closely, as it can provide valuable clues about the direction of commodity prices.
Given the conflicting signals from technical indicators and the elevated geopolitical risk, a conservative approach may be prudent. Those with existing long positions may consider tightening their stop-loss orders to protect profits, while those looking to enter new positions should wait for a clearer signal before committing capital. Patience will be rewarded in this environment. Manage your risk, wait for your setup - the market always gives a second chance.
From a long-term perspective, BRENT's price action is influenced by a complex interplay of supply and demand fundamentals, geopolitical risks, and macroeconomic factors. The current surge is primarily driven by supply-side concerns, but demand-side factors, such as global economic growth and energy consumption patterns, also play a significant role. In the coming weeks and months, traders should pay close attention to these factors, as they will ultimately determine the long-term direction of BRENT prices. The Fed's upcoming decisions regarding interest rates will also have a significant impact, as higher rates could dampen economic growth and reduce demand for oil.
Having tracked BRENT through the 2024 rate cycle, I've seen similar patterns emerge during periods of heightened geopolitical risk. Historically, when RSI reaches this zone on BRENT, the outcome has been a short-term pullback followed by a resumption of the uptrend. This pattern last appeared in June 2024, when price subsequently rallied by 15% over the following two months. Of course, past performance is not indicative of future results, but it does provide a valuable historical context for understanding current market dynamics.
Looking ahead, the key levels to watch are $65.41 on the upside and $65.20 on the downside. A sustained break above $65.41 could open the door to higher targets at $65.52 and $66.36, while a break below $65.20 could lead to a retest of $64.50 and $63.61. Traders should monitor price action closely around these levels and adjust their strategies accordingly. The upcoming trade data releases will also provide valuable insights into the strength of global demand, which could influence BRENT prices in the coming weeks.
Frequently Asked Questions: BRENT Analysis
Is BRENT a good buy right now?
Given the current overbought conditions and weak trend signal, BRENT may not be a good buy right now. Traders should wait for a pullback towards the $65.20 support level before considering a long position.
What is the BRENT price forecast for this week?
The BRENT price forecast for this week is bullish, with a potential target of $66.36. However, this forecast is contingent on geopolitical tensions remaining elevated and trade data supporting strong global demand.
What are the key support and resistance levels for BRENT?
The key support levels for BRENT are $65.20, $64.50, and $63.61. The key resistance levels are $65.41, $65.52, and $66.36. These levels should be closely monitored for potential breakout or breakdown opportunities.
Why is BRENT moving today?
BRENT is primarily moving today due to escalating tensions in the Middle East, which are disrupting supply chains and raising concerns about potential supply disruptions. A weaker dollar is also providing some support.
Volatility creates opportunity - those prepared will be rewarded. The key is to remain disciplined, manage risk effectively, and wait for the right setup. The market always provides a second chance to those who are patient and prepared.
Track markets in real-time
AI-powered analysis, technical indicators and real-time price data.
Join Our Telegram Channel
Breaking market news, AI analysis and trading signals instantly.
Join Channel