BRENT Eyes $65.73: Weekly Bullish Run Amid Middle East Tensions
Brent crude oil approaches $65.73 after a 1.96% daily gain, driven by escalating Middle East tensions. Traders eye key economic data releases this week for further direction.
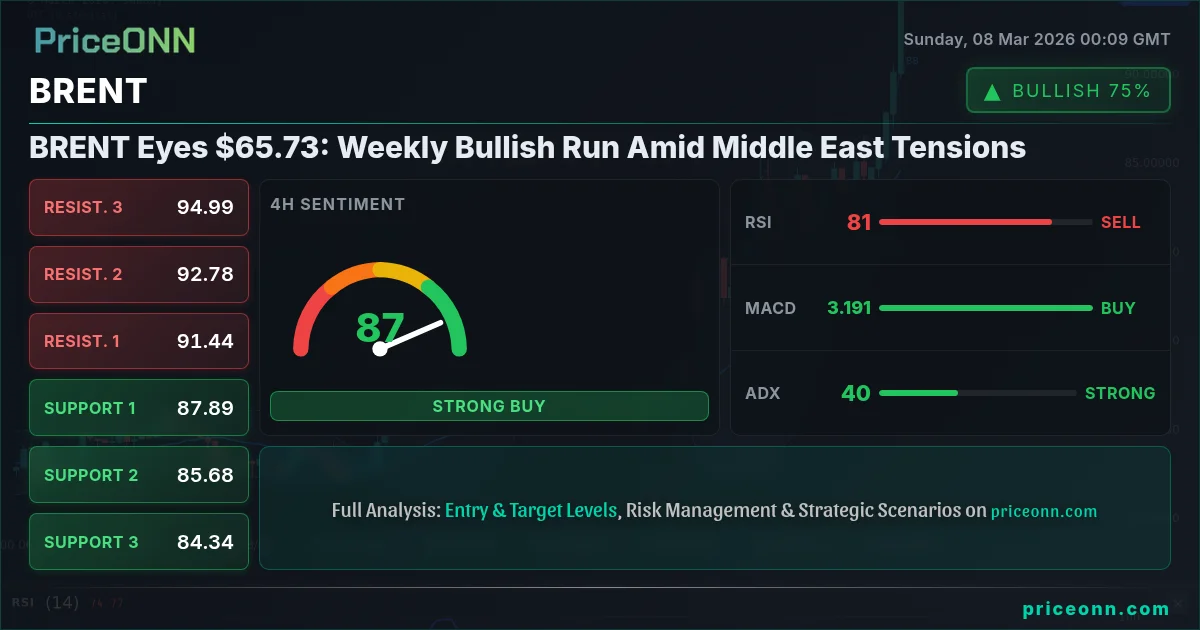
Brent crude oil is currently trading at $65.73, marking a 1.96% daily increase. This bullish run is fueled by escalating tensions in the Middle East, raising concerns about potential supply disruptions. With the RSI at 71.16 on the 1-hour chart, the market may be entering overbought territory, suggesting a possible pullback in the near term. However, the underlying bullish sentiment, coupled with a positive MACD signal, indicates that the upward momentum could persist. Traders are closely monitoring geopolitical developments and upcoming economic data releases for further clues about the future direction of oil prices.
- RSI at 71.16 on the 1H chart signals overbought conditions for BRENT.
- Immediate resistance lies at $65.42, a break above which could trigger further gains.
- MACD histogram shows strengthening positive momentum, supporting bullish bias.
- Geopolitical tensions in the Middle East are the primary catalyst driving BRENT's recent rally.
Technical Overview: A Multi-Timeframe Perspective
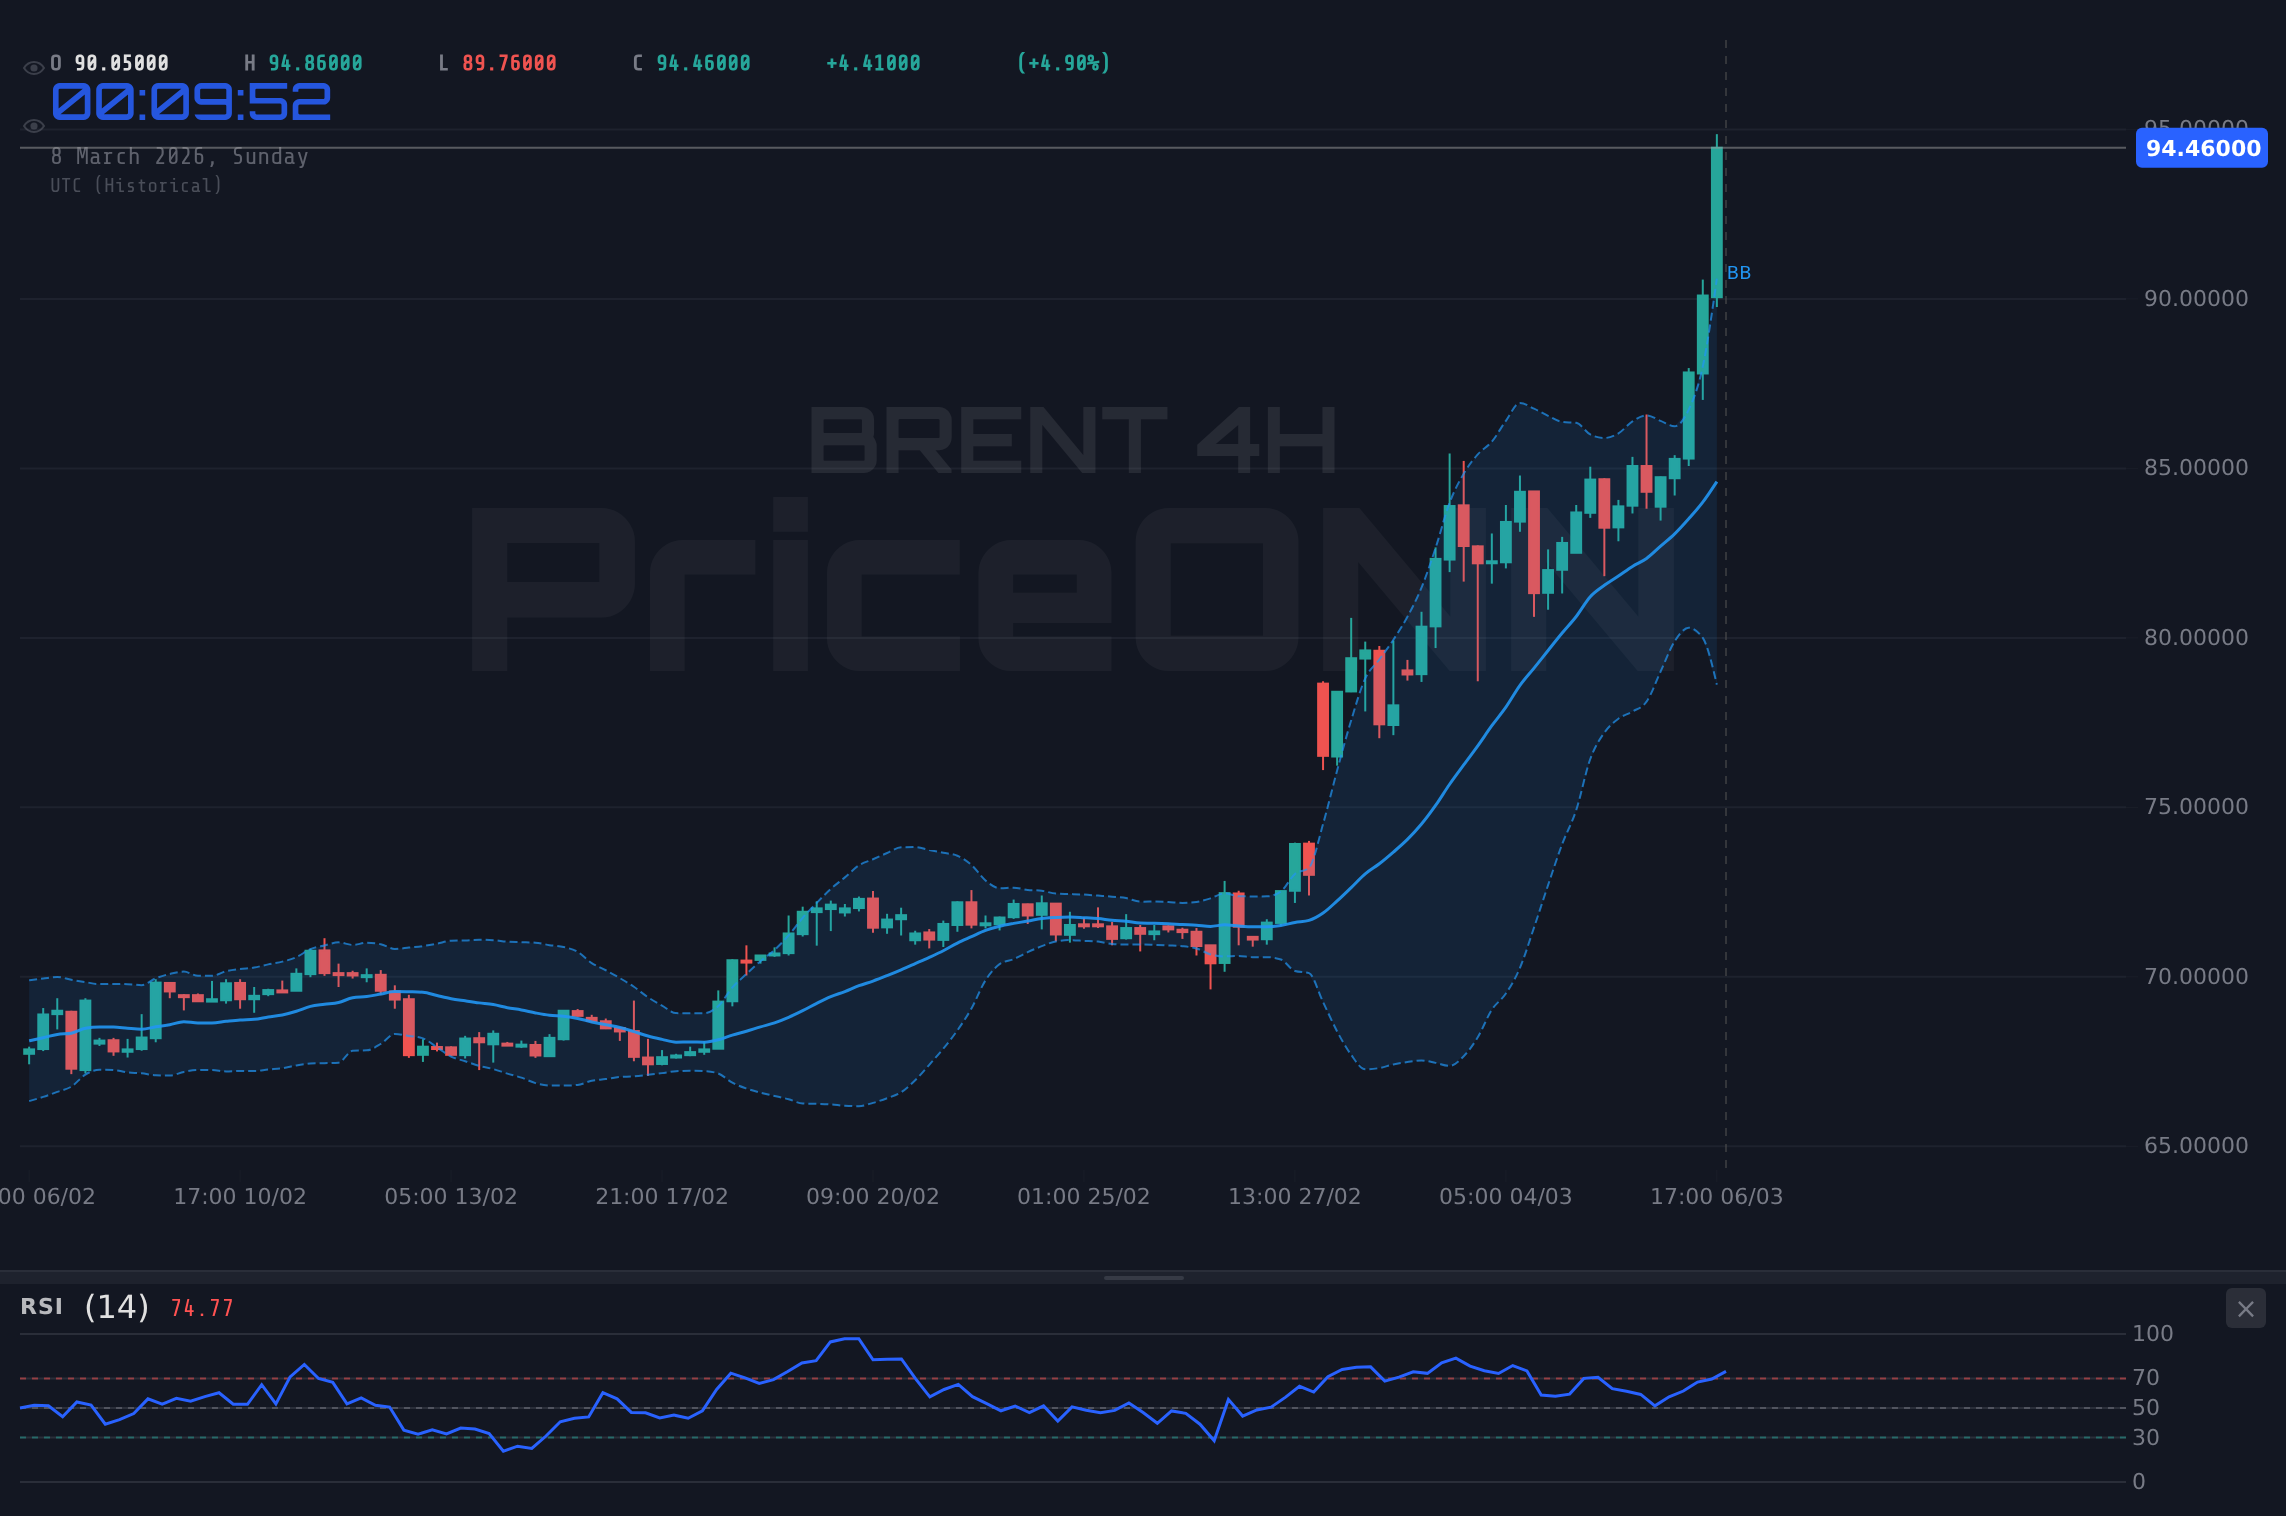
A multi-timeframe analysis reveals a mixed picture for Brent crude oil. On the 1-hour chart, the trend is neutral, while the 4-hour and daily charts show a bullish trend. The ADX on the daily chart stands at 28.64, indicating a strong upward trend, while the 1-hour ADX is at a weak 19.03. This suggests that the short-term momentum may be waning, but the overall trend remains bullish. The Stochastic oscillator on the 1-hour chart is in overbought territory at 90.49, further supporting the possibility of a near-term pullback. However, the 4-hour Stochastic at 68.29 suggests that there is still room for further upside before the market becomes overbought on a larger timeframe. Scalpers should watch the $65.20 level for potential short-term pullbacks, while swing traders may look for opportunities to enter long positions on dips towards the $64.50 level. Long-term investors should focus on the broader trend and consider adding to their positions on any significant weakness.
Key Levels to Watch: Support and Resistance
Key support levels for Brent crude oil are identified at $65.20, $64.50, and $63.61. These levels could provide potential entry points for long positions or act as areas of price consolidation. Conversely, resistance levels are located at $65.42, $66.36, and $67.23. A break above these resistance levels could signal a continuation of the bullish trend and trigger further gains. The $65.42 level is particularly important, as it represents the immediate resistance on the daily chart. A decisive break above this level could pave the way for a test of the $66.36 level. The current price action suggests that the market is consolidating near the $65.73 level, with bulls attempting to push the price higher. However, the overbought conditions on the 1-hour chart suggest that caution is warranted in the near term. Scalpers should be aware of the potential for volatility and manage their risk accordingly. Swing traders should wait for a clear breakout above resistance or a pullback to support before entering new positions. Long-term investors should remain focused on the broader trend and consider adding to their positions on any significant weakness.
BRENT's Bullish Momentum: Geopolitical Factors and Supply Concerns
The recent surge in Brent crude oil prices is primarily attributed to escalating geopolitical tensions in the Middle East. The region has been a major source of oil supply disruptions in the past, and any renewed conflict could significantly impact global oil markets. According to PriceONN market news, tensions in the Middle East are fueling speculation of Brent crude nearing $90 a barrel. The situation in the Hormuz Strait, a critical chokepoint for oil tankers, is particularly concerning. Any disruptions to shipping in this area could send oil prices soaring. In addition to geopolitical factors, supply concerns are also contributing to the bullish sentiment. OPEC+ has been implementing production cuts in an effort to balance the market, and any further reductions could exacerbate the supply squeeze. The market is also watching for any potential disruptions to oil production in other regions, such as Libya and Nigeria. These factors, combined with a generally positive economic outlook, are creating a favorable environment for oil prices. However, it is important to note that the market is also vulnerable to downside risks, such as a slowdown in global economic growth or an unexpected increase in oil production.
Economic Data and Market Sentiment: What to Expect This Week
This week, traders will be closely watching a number of key economic data releases that could impact oil prices. The U.S. Weekly Economic & Financial Commentary, released on March 7, provided insights into the health of the U.S. economy, which is a major driver of global oil demand. The upcoming data releases on Canadian Unemployment Rate are expected to rise, which could impact traders and markets. Traders will also be closely monitoring any news related to the Middle East tensions and OPEC+ production decisions. Market sentiment is currently bullish, but this could quickly change if any negative news emerges. The dollar index (DXY) is also an important factor to watch. A stronger dollar could put downward pressure on oil prices, while a weaker dollar could provide support. The current DXY level of 98.57 suggests that the dollar is relatively strong, which could limit the upside potential for oil prices. However, the overall bullish sentiment and supply concerns are likely to outweigh the negative impact of a strong dollar in the near term. The SP500 is currently trading at 6743.17, down 1.07%, and the Nasdaq100 is at 24657.05, down 1.25%. The risk-off sentiment in the equity markets could lead to some safe-haven buying in oil, providing additional support to prices.
Correlation Analysis: DXY, Equities, and Bond Yields
Brent crude oil exhibits complex correlations with other asset classes. Typically, a rising dollar index (DXY) puts downward pressure on oil prices, as oil is priced in dollars. With DXY at 98.57, the strength of the dollar could act as a headwind for further BRENT gains. However, geopolitical tensions and supply concerns are currently overriding this negative correlation. Equities, particularly the SP500 and Nasdaq100, often move in tandem with oil prices, as both are sensitive to economic growth. However, the current risk-off sentiment in the equity markets is decoupling this correlation, as investors seek safe-haven assets like oil. Bond yields also play a role, as rising yields can signal inflationary pressures, which can be supportive of oil prices. However, the current low-yield environment suggests that inflation is not a major concern, which could limit the upside potential for oil prices. Overall, the correlation analysis suggests that a complex interplay of factors is influencing oil prices, and traders need to consider all of these factors when making investment decisions.
Historical Perspective: Lessons from Past Oil Price Shocks
Analyzing past oil price shocks can provide valuable insights into the current market dynamics. The oil price shocks of the 1970s, triggered by geopolitical events and supply disruptions, led to significant economic consequences, including inflation and recession. The more recent oil price spike in 2008, driven by strong demand and limited supply, also had a significant impact on the global economy. These historical episodes highlight the importance of understanding the factors that can drive oil prices higher and the potential consequences for the broader economy. The current situation shares some similarities with these past episodes, including geopolitical tensions and supply concerns. However, there are also important differences, such as the current low-interest-rate environment and the increasing importance of renewable energy sources. By studying these past episodes, traders can gain a better understanding of the potential risks and opportunities in the current oil market.
Risk Management: Navigating Volatility in the Oil Market
The oil market is known for its volatility, and traders need to implement robust risk management strategies to protect their capital. Stop-loss orders are essential for limiting potential losses, and position sizing should be carefully considered to avoid overexposure. Traders should also be aware of the potential for unexpected events, such as geopolitical shocks or supply disruptions, to trigger sharp price swings. Diversification is another important risk management technique, as it can help to reduce the overall portfolio risk. Traders should also avoid using excessive leverage, as this can amplify both profits and losses. The current market conditions, characterized by geopolitical tensions and supply concerns, call for a particularly cautious approach to risk management. Traders should be prepared for increased volatility and be ready to adjust their positions accordingly. The Brent crude oil's ADX on the 1-hour chart is at a weak 19.03. This indicates a lack of a strong trend and suggests that the market may be range-bound. In such conditions, traders should consider using range-bound trading strategies, such as buying at support and selling at resistance.
Trading Strategies for Different Time Horizons
Different trading strategies are appropriate for different time horizons. Scalpers, who trade on very short timeframes, should focus on identifying small price movements and taking quick profits. They should be aware of the potential for volatility and use tight stop-loss orders to limit their risk. Swing traders, who trade on medium timeframes, should look for opportunities to enter long positions on dips towards support levels or short positions on rallies towards resistance levels. They should use wider stop-loss orders and be prepared to hold their positions for several days or weeks. Long-term investors should focus on the broader trend and consider adding to their positions on any significant weakness. They should be less concerned about short-term volatility and more focused on the long-term potential of the oil market. The current market conditions, characterized by geopolitical tensions and supply concerns, may be more favorable for swing traders and long-term investors than for scalpers. The potential for sharp price swings could make it difficult for scalpers to consistently generate profits. Swing traders and long-term investors, on the other hand, may be able to capitalize on the volatility by entering positions at favorable prices.
Frequently Asked Questions: BRENT Analysis
Is BRENT a good buy right now?
BRENT is experiencing bullish momentum at $65.73, but with an RSI of 71.16 on the 1H chart, it's nearing overbought territory. A cautious approach is advised, waiting for a pullback towards support levels before considering a long position.
What is the BRENT price forecast for this week?
The forecast hinges on Middle East tensions and upcoming economic data. A break above the $65.42 resistance could lead to $66.36, while failure to hold $65.20 support may signal a pullback towards $64.50.
What are the key support and resistance levels for BRENT?
Key support levels are at $65.20, $64.50, and $63.61. Resistance levels are at $65.42, $66.36, and $67.23. These levels are crucial for identifying potential entry and exit points.
Why is BRENT moving today?
BRENT's rise is primarily due to escalating Middle East tensions, raising concerns about potential supply disruptions. This geopolitical risk is overshadowing a relatively strong dollar and weakness in equity markets.
Volatility creates opportunity-those prepared will be rewarded.
Track markets in real-time
AI-powered analysis, technical indicators and real-time price data.
Join Our Telegram Channel
Breaking market news, AI analysis and trading signals instantly.
Join Channel