As Middle East tensions escalate and oil prices surge, broader market uncertainty is pushing investors to re-evaluate risk positions. The recent oil crisis, as reported by Reuters, is impacting forex markets, adding another layer of complexity to the current trading environment. This backdrop sets the stage for a closer look at ETHUSD, where retail data is now in sharp focus amidst a persistent neutral trend.
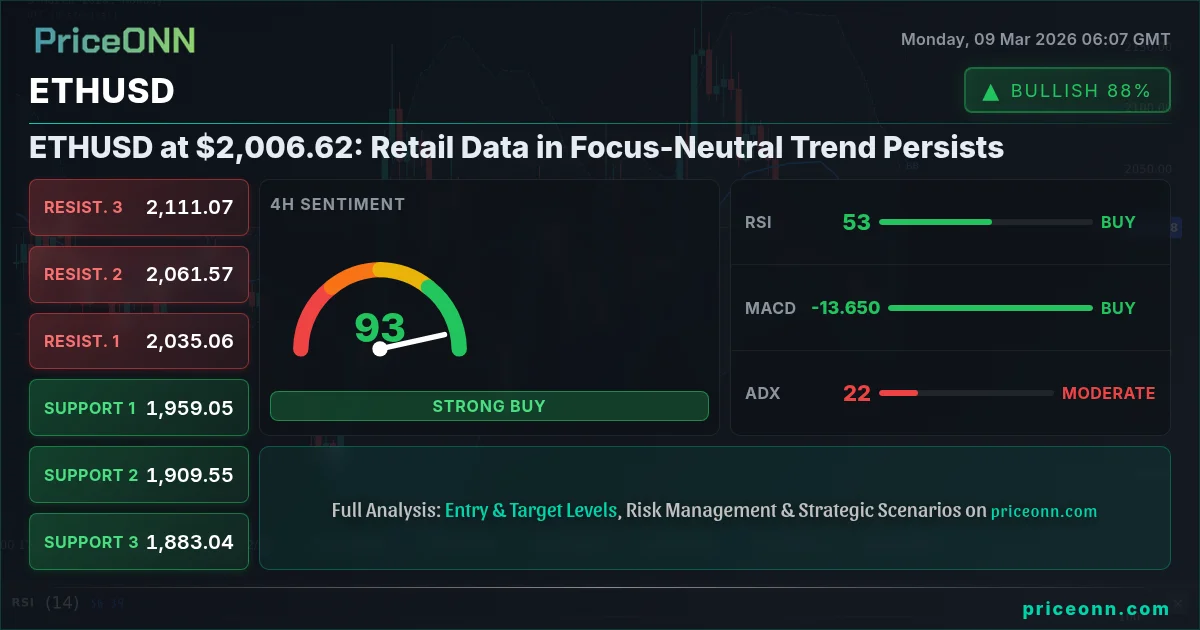
- ETHUSD is currently trading near $2,006.62, reflecting a neutral trend with a slight bullish bias on shorter timeframes.
- Key support level to watch is $1,968.04, a breach of which could signal further downside.
- The 1-hour Stochastic indicator shows a bullish signal with K=78.43 and D=66.64, suggesting potential short-term upward momentum.
- Overall market sentiment remains cautious due to ongoing geopolitical tensions and rising energy costs, impacting ETHUSD volatility.
Navigating the Sideways Channel: Is a Breakout Imminent?
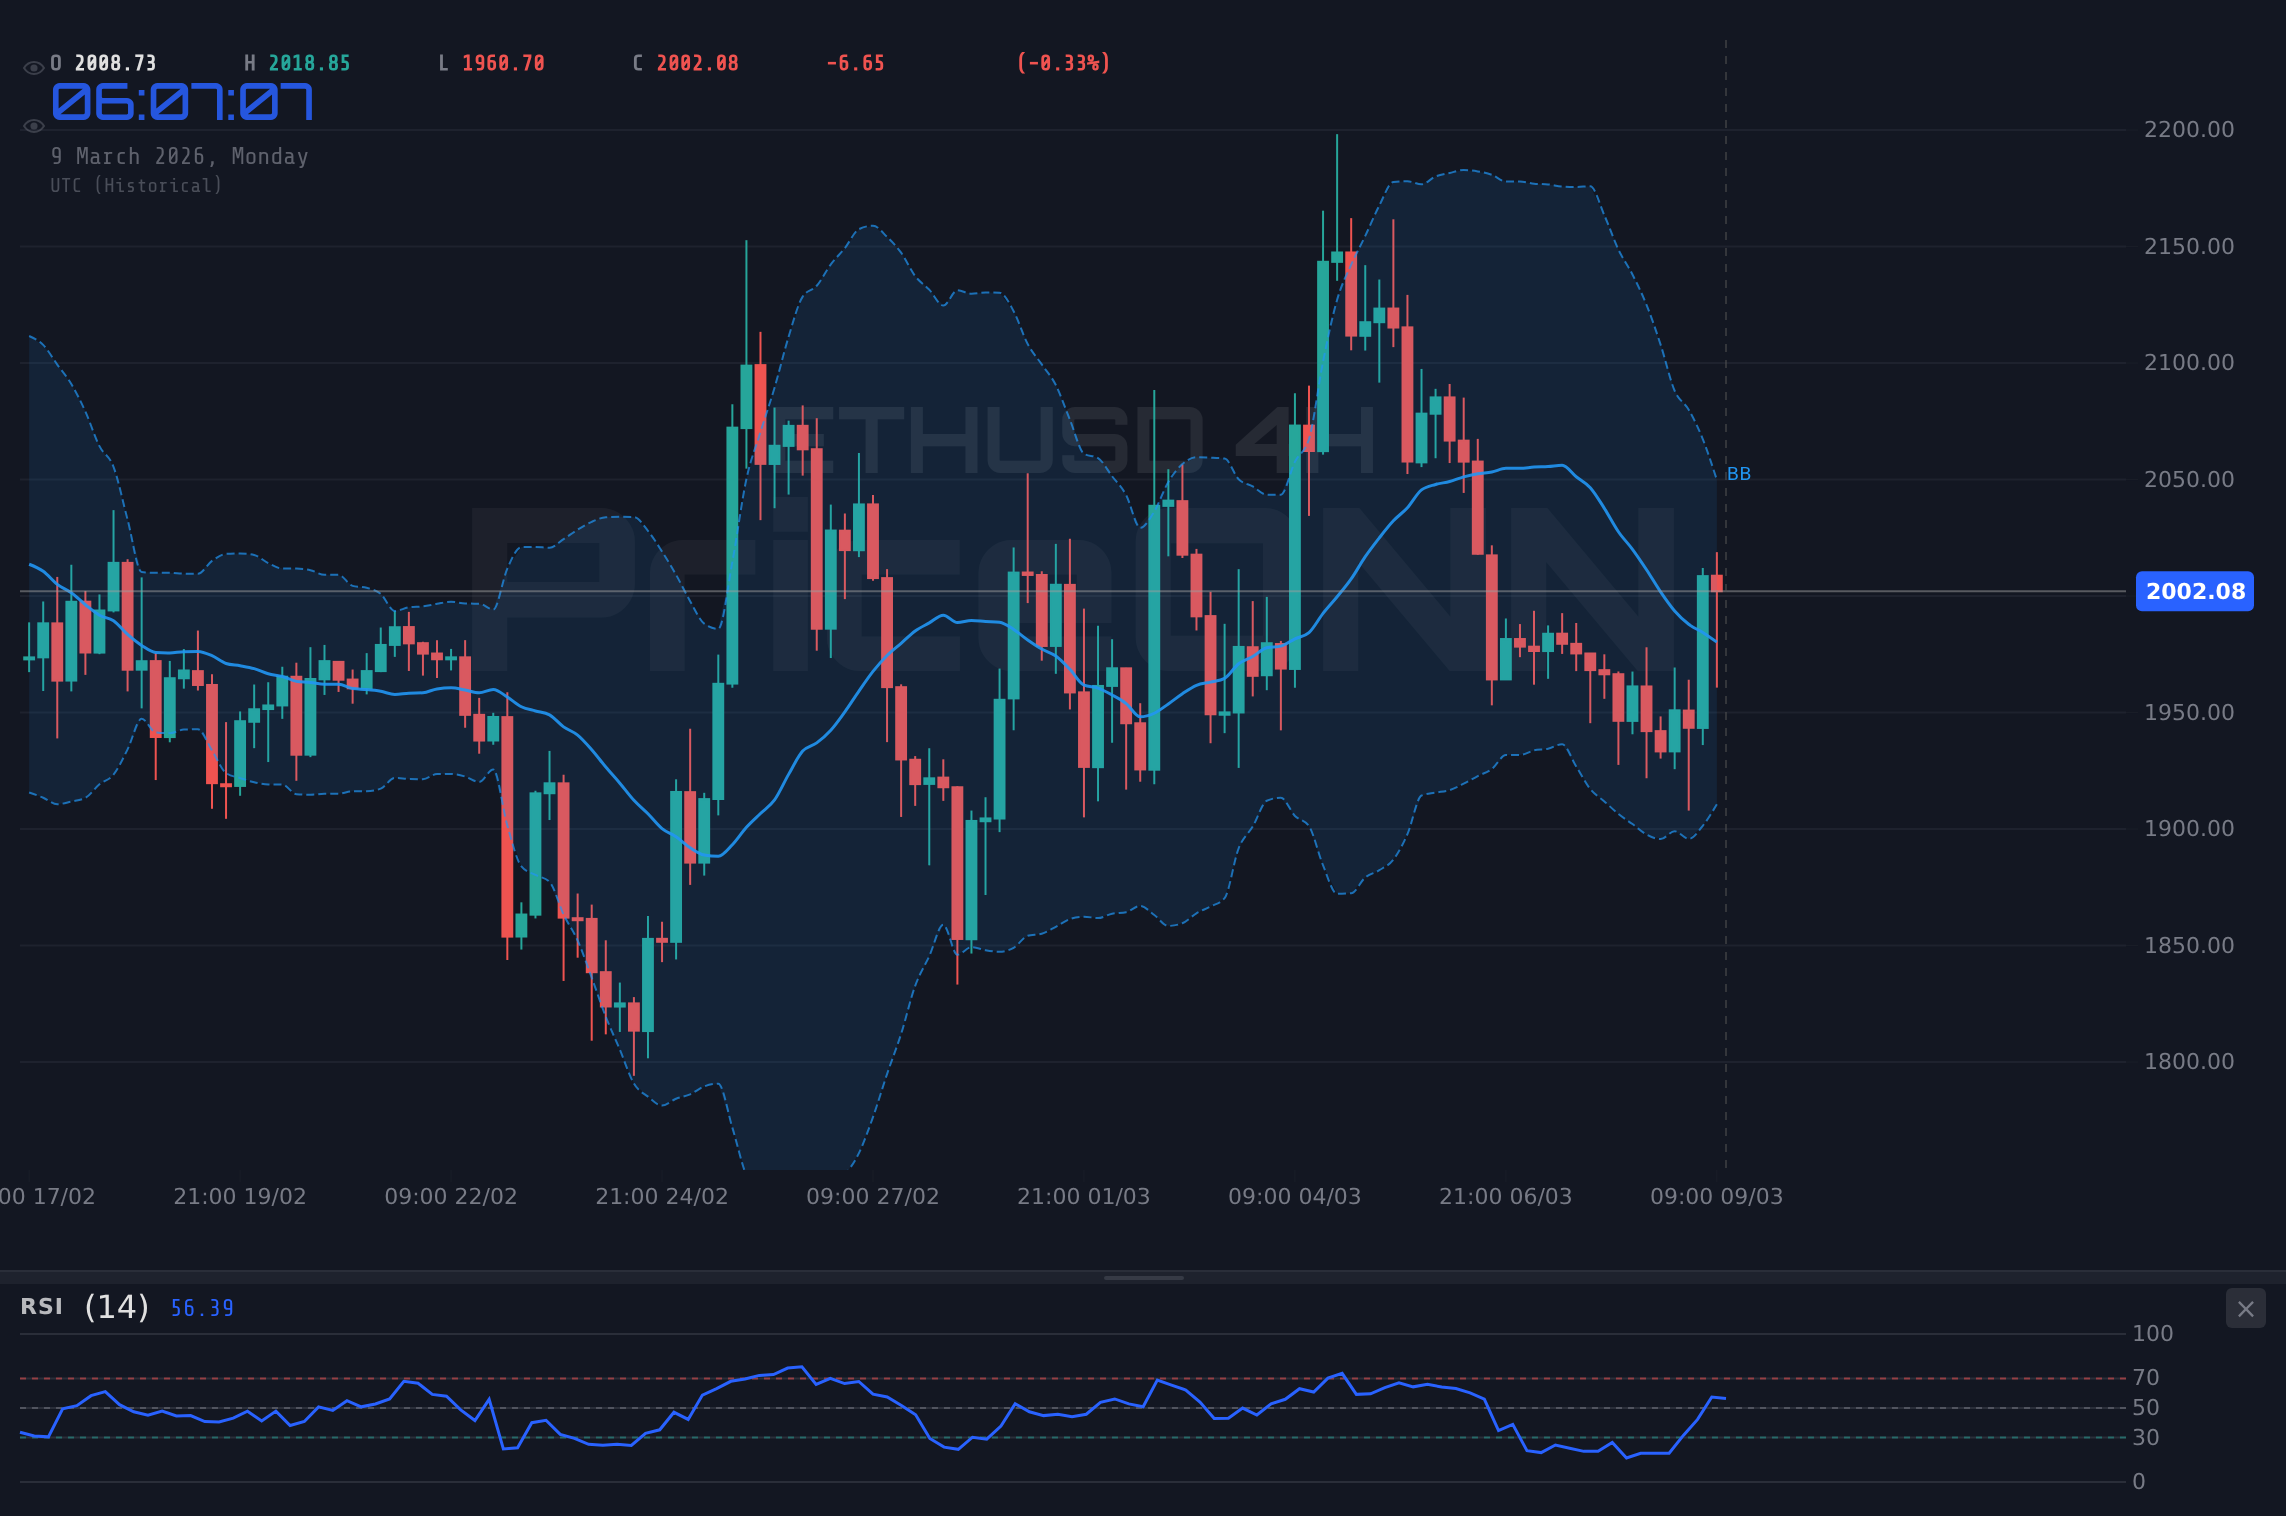
ETHUSD currently trades around $2,006.62, caught within a sideways channel. This consolidation phase presents a conundrum for traders. The key question is whether this period of indecision will resolve into a sustained bullish or bearish breakout. The answer likely lies in upcoming retail data releases, which could act as a catalyst to shift market sentiment and drive price action. Keep a close watch on the $1,968.04 support level; failure to hold could open the door to lower targets.
Technical Indicators: A Mixed Bag of Signals
A deeper dive into the technical indicators paints a complex picture. On the 1-hour chart, the RSI stands at 68.27, indicating that bulls are showing some strength but are not yet in overbought territory. The MACD, while positive, shows momentum is starting to fade. This divergence suggests caution. Meanwhile, the Stochastic indicator on the 1-hour timeframe is showing a bullish signal with K=78.43 and D=66.64, hinting at a potential short-term upward move. However, the ADX at 27.75 suggests a moderate trend strength, indicating that the current trend is not particularly strong in either direction. Multi-timeframe analysis, particularly focusing on chart pattern recognition on the 4-hour and daily charts, is crucial to get a more complete picture.
Key Levels to Watch: Support and Resistance
Identifying critical support and resistance levels is essential for any ETHUSD trader. Immediate support can be found at $1,968.04 on the 1-hour chart. A break below this level could see price test the $1,912.90 support on the 4-hour chart. On the upside, immediate resistance is at $1,984.73. A sustained move above this level could open the door to the $2,001.42 resistance level. These key levels serve as potential entry and exit points for both scalpers and swing traders.
The Impact of Geopolitical Tensions and Economic Data
The broader market context plays a significant role in ETHUSD price action. The ongoing tensions in the Middle East, as highlighted by recent news reports of an escalating oil crisis, are creating uncertainty and volatility in global markets. The EUR/CAD pair, for instance, is facing downward pressure due to the oil crisis, according to recent reports. This risk-off sentiment could indirectly impact ETHUSD as investors seek safe-haven assets. Additionally, upcoming economic data releases, such as the US PPI due to be released on Wednesday, could further influence market sentiment and ETHUSD price movements. Investors are awaiting the US PPI data due to be released on Wednesday. A higher-than-expected reading could strengthen the dollar and pressure ETHUSD.
ETHUSD: Scalper, Swing Trader, and Long-Term Investor Perspectives
Different types of traders will approach ETHUSD with varying strategies based on their time horizons and risk tolerance. Scalpers will focus on the smaller timeframes (1-hour and below), looking to capitalize on short-term price fluctuations within the sideways channel. They will pay close attention to the key support and resistance levels mentioned earlier, using them as potential entry and exit points. Swing traders, on the other hand, will focus on the 4-hour and daily charts, looking for a sustained breakout from the sideways channel. They will monitor the ADX and other trend-following indicators to confirm the strength of any potential breakout. Long-term investors will take a broader view, focusing on the fundamental drivers of ETHUSD and its potential for future growth. They will be less concerned with short-term price fluctuations and more interested in the overall trend and long-term potential.
Correlation Analysis: DXY, Bonds, Equities, and Oil
Understanding the correlations between ETHUSD and other asset classes is crucial for making informed trading decisions. A strengthening DXY (Dollar Index), which currently stands at 99.05, typically puts downward pressure on ETHUSD. Conversely, a weakening DXY tends to support ETHUSD. Bond yields also play a role, with rising yields potentially weighing on ETHUSD as investors shift towards fixed-income assets. Equity markets are another important factor to consider. A risk-off environment, characterized by falling equity prices, could lead to increased demand for safe-haven assets, potentially supporting ETHUSD. Oil prices, driven by geopolitical tensions, can also impact ETHUSD through their influence on inflation expectations. As WTI crude soars to $103.15, the pressure on inflation is increasing, adding further complexity to the ETHUSD analysis.
The Bearish Scenario: Breakdown Below Support
The bearish scenario hinges on a breakdown below the key support level of $1,968.04. If price fails to hold above this level, a sustained move lower could see ETHUSD test the $1,912.90 support on the 4-hour chart. A break below this level could open the door to further downside, with potential targets at $1,882.32 and $1,856.73. This scenario is more likely if the DXY continues to strengthen and risk-off sentiment dominates the market.
The Bullish Scenario: Breakout Above Resistance
The bullish scenario requires a sustained breakout above the immediate resistance level of $1,984.73. If price can break above this level, it could open the door to the $2,001.42 resistance level. A sustained move above this level could see ETHUSD test higher targets at $2,025.24 and beyond. This scenario is more likely if the DXY weakens and risk appetite returns to the market.
Trade Plan: ETHUSD Short-Term Bullish Opportunity
Based on the current technical picture, there is a short-term bullish opportunity in ETHUSD. The Stochastic indicator is showing a bullish signal, and the RSI is not yet in overbought territory. However, the ADX is relatively weak, indicating that the trend strength is not particularly strong. Therefore, a cautious approach is warranted.
If ETHUSD breaks above $1,984.73, look for a move towards $2,001.42. A sustained break above $2,001.42 could target $2,025.24. Monitor DXY strength; a weakening dollar supports this scenario.
If ETHUSD fails to hold above $1,968.04, expect a move towards $1,912.90. A sustained break below $1,912.90 could target $1,882.32. Watch for DXY strength; a strengthening dollar favors this scenario.
Risk Warning: Upcoming US PPI Data
Frequently Asked Questions: ETHUSD Analysis
Is ETHUSD a good buy right now?
ETHUSD at $2,006.62 presents a mixed picture. The short-term bullish signals suggest a potential buying opportunity, but the overall trend remains neutral. A break above $1,984.73 could signal a more sustained upward move.
What is the ETHUSD price forecast for this week?
The ETHUSD price forecast for this week depends on the outcome of the US PPI data release. A higher-than-expected reading could pressure ETHUSD, while a weaker-than-expected reading could support it. A realistic target range is $1,912.90 to $2,025.24.
What are the key support and resistance levels for ETHUSD?
Key support levels for ETHUSD are $1,968.04 and $1,912.90. Key resistance levels are $1,984.73 and $2,001.42. These levels represent potential turning points in the market.
Why is ETHUSD moving today?
ETHUSD is currently moving sideways, reflecting market indecision. The lack of a clear trend is likely due to a combination of factors, including geopolitical tensions and uncertainty surrounding upcoming economic data releases.
Technical Outlook Summary
| Indicator | Value | Signal |
|---|---|---|
| RSI (14) | 68.27 | Neutral |
| MACD Histogram | Positive | Bullish |
| Stochastic | K=78.43, D=66.64 | Bullish |
| ADX | 27.75 | Moderate |
| Bollinger | Upper Band | Watch |
Key Levels
Support Levels
Resistance Levels
Track markets in real-time
AI-powered analysis, technical indicators and real-time price data.
Join Our Telegram Channel
Breaking market news, AI analysis and trading signals instantly.
Join Channel