Having tracked GBPUSD through multiple economic cycles, the current bearish pressure at $1.337 amid the escalating oil crisis presents a critical juncture for traders. The confluence of factors-a strengthening dollar index and rising geopolitical tensions- demands a closer look at the macroeconomic factors influencing this pair.
- GBPUSD faces significant downside risk as the DXY index climbs to 98.97, increasing pressure on the pair.
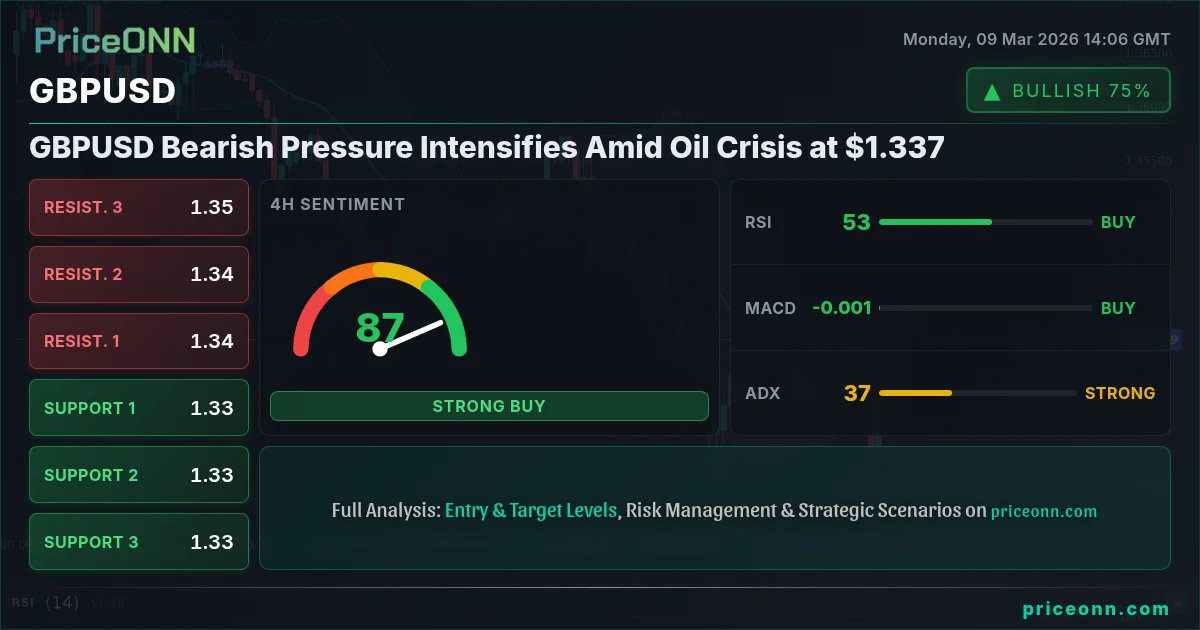
- Key support level to watch is 1.33356, a break below which could trigger further declines.
- MACD histogram indicates negative momentum, suggesting the bearish trend is likely to continue.
- Geopolitical tensions related to the oil crisis are exacerbating economic divergence, weighing on GBPUSD.
Oil Crisis and its Impact on GBPUSD
The escalating oil crisis, triggered by tensions in the Middle East, is sending shockwaves through forex markets. As Brent crude prices hover around $65.73, the impact on GBPUSD is notable. The rise in oil prices is exacerbating economic disparities, particularly affecting economies heavily reliant on energy imports. The recent news highlights the severity of the situation, with Oil Crisis Shakes Forex: EUR/CAD Plunges Amidst Dollar Strength. This is not just about energy prices; it's about the broader economic implications that translate into currency valuations.
Macroeconomic Factors and GBPUSD
GBPUSD macroeconomic factors in March 2026 are painting a bearish picture. The dollar index (DXY), currently at 98.97, is strengthening, putting downward pressure on GBPUSD. This is a classic inverse correlation: a stronger dollar typically weakens other major currencies. Furthermore, the UK's economic data has been mixed, adding to the uncertainty surrounding the pound. The anticipation of upcoming economic data releases, such as the UK GDP momentum, is creating additional volatility. The market is pricing in potential dovish bets on the Bank of England, signaling further downside potential for GBPUSD.
Technical Analysis: A Multi-Timeframe Perspective
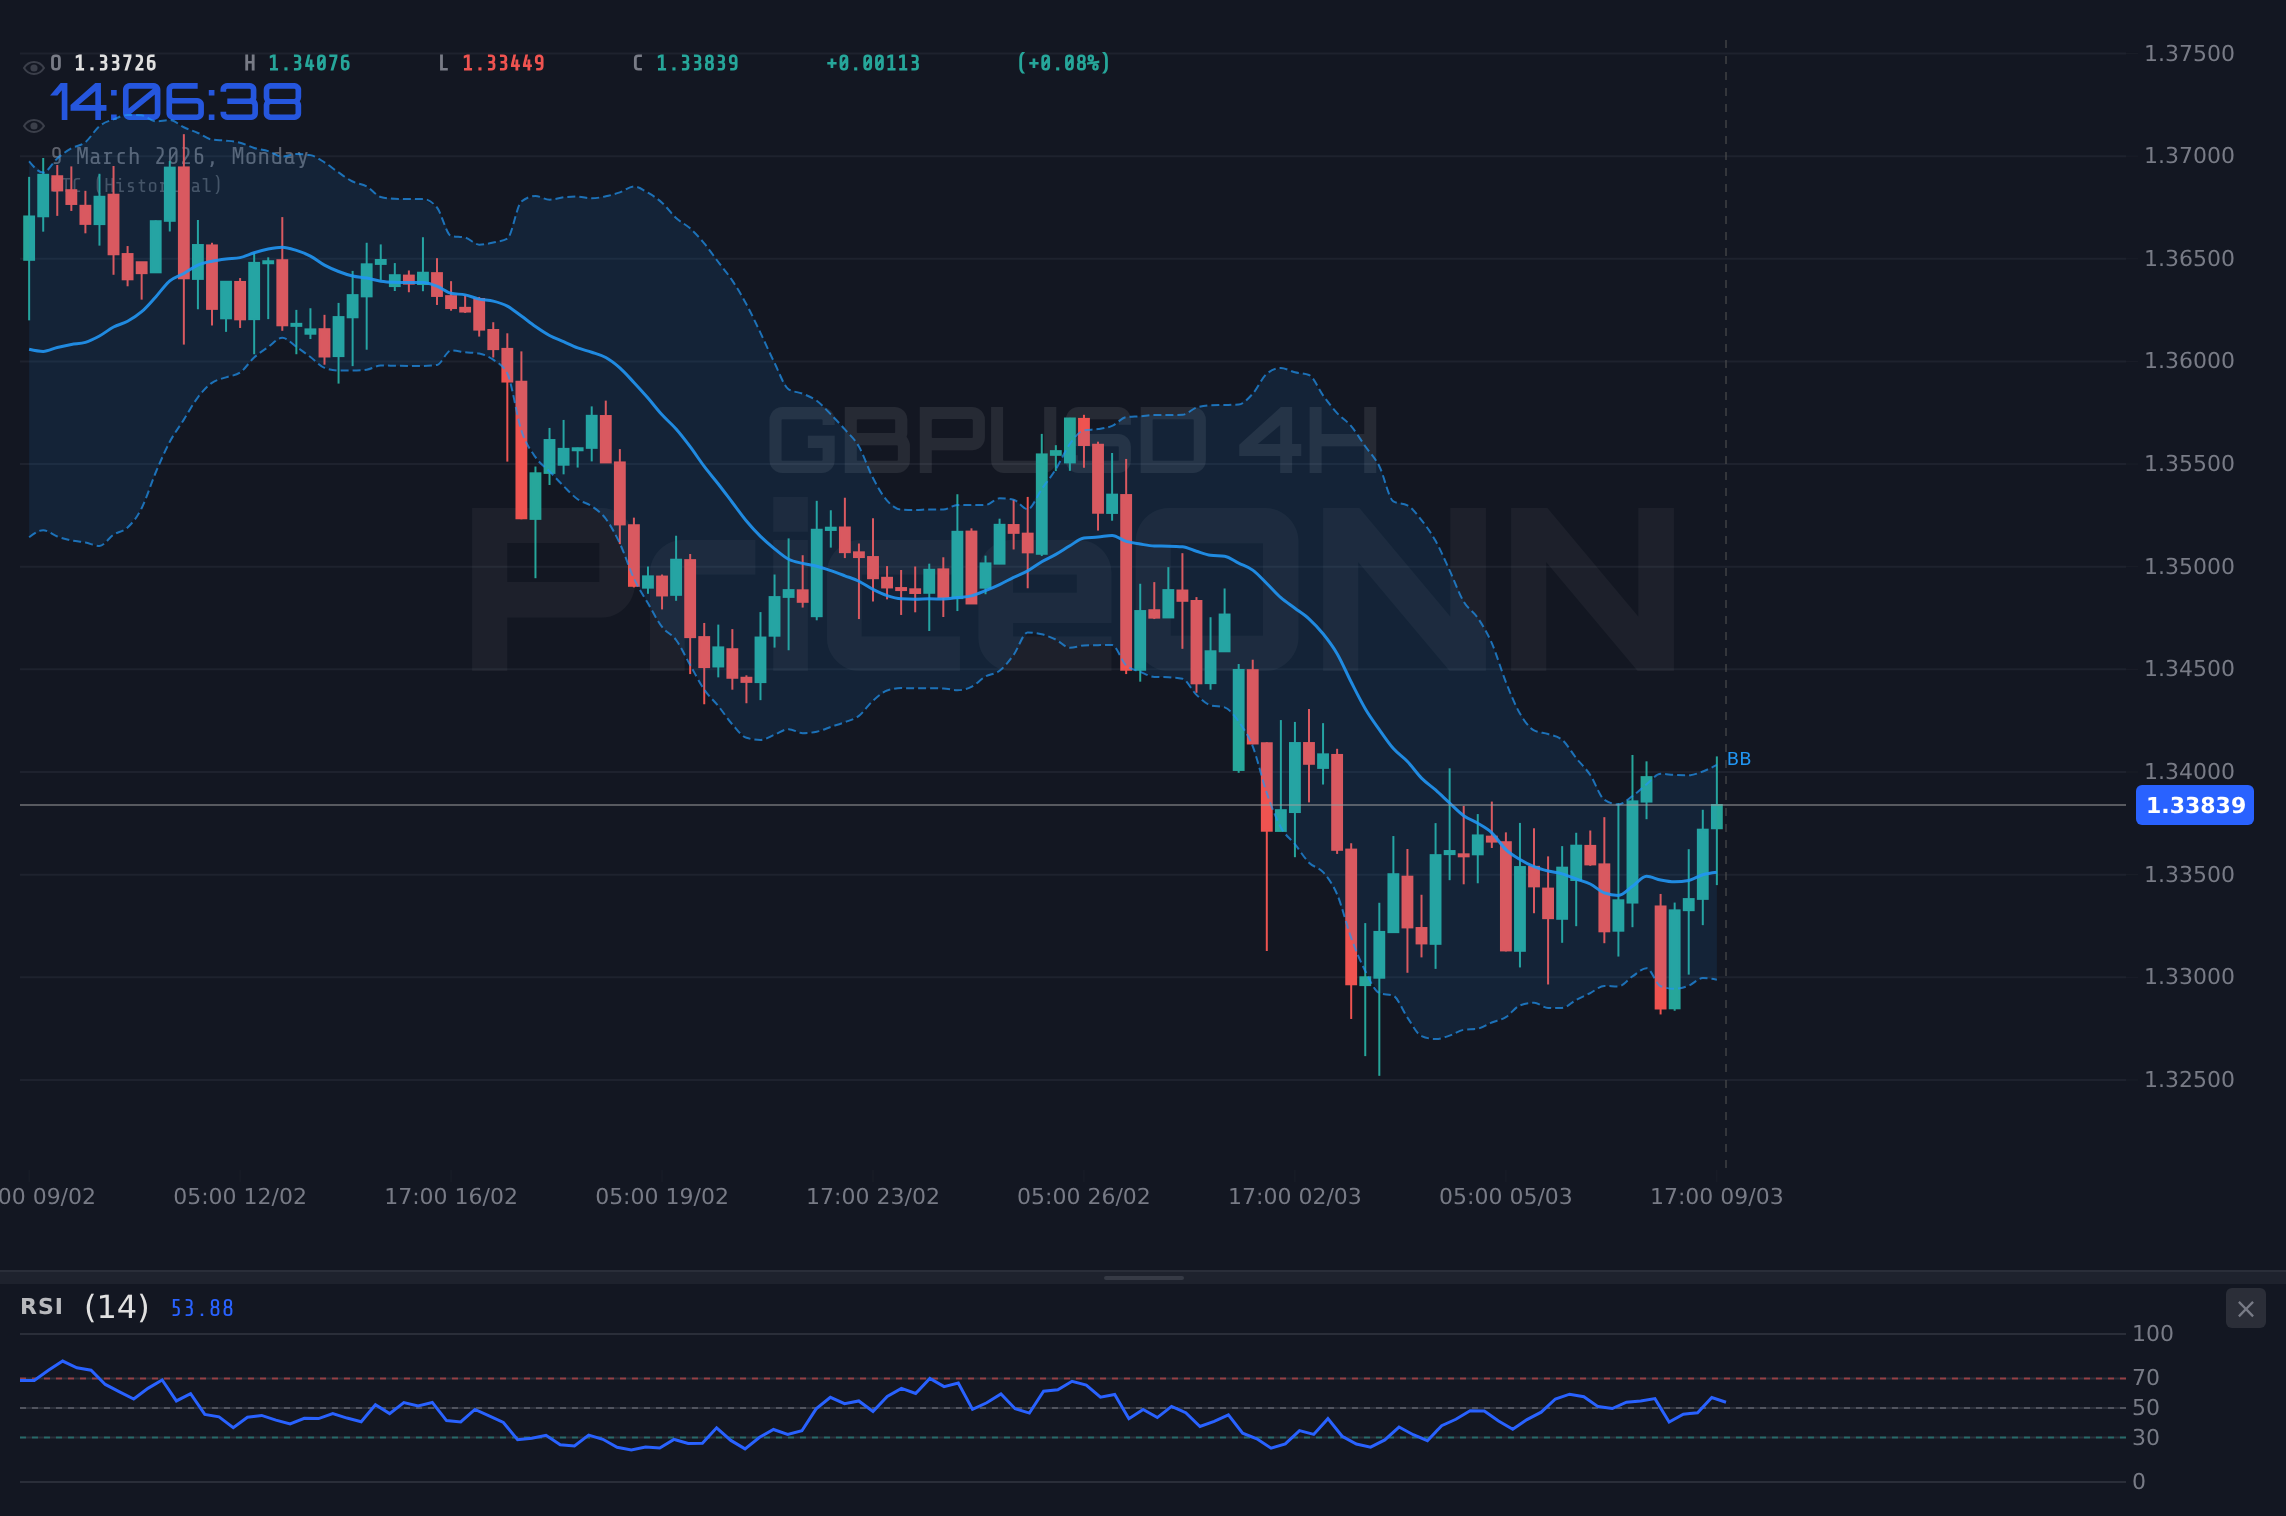
A multi-timeframe analysis of GBPUSD provides a clearer understanding of the current market dynamics. On the daily chart, the trend is bearish with 95% strength, as GBPUSD sits at 1.33696. The Relative Strength Index (RSI) at 35.34 indicates that the pair is not yet oversold, leaving room for further downside. On the 4-hour chart, the ADX is at 38.88, confirming that there is significant trend strength. The Stochastic oscillator shows a bearish signal as %K
Key Support and Resistance Levels
Identifying key support and resistance levels is crucial for traders navigating the GBPUSD landscape. Immediate support is at 1.33356, followed by 1.32738 and 1.32374. A break below 1.33356 could trigger a further decline towards the lower support levels. On the upside, resistance is at 1.34338, with subsequent resistance at 1.34702 and 1.3532. These levels serve as potential pivot points for price action.
GBPUSD Trend Analysis: What the Indicators Tell Us
Diving deeper into trend analysis, the indicators provide a mixed but ultimately bearish outlook. The hourly chart shows a neutral trend, with the RSI at 58.06, indicating that the pair is neither overbought nor oversold. However, the 4-hour chart shows a strong bearish trend with an ADX of 38.88. The daily chart confirms this bearish trend, with a strong ADX of 29.48. The MACD histogram is negative, further supporting the bearish momentum. The Stochastic oscillator shows %K
Why $1.333 is the Line in the Sand
The $1.333 level is pivotal. This area represents a confluence of technical support and psychological importance. A sustained break below this level would open the door for a test of the next major support around 1.32738. Conversely, a hold above this level could signal a period of consolidation or a potential bounce, but this scenario appears less likely given the current bearish sentiment and strengthening dollar.
Risk Sentiment and Correlation with DXY
Risk sentiment is playing a significant role in the GBPUSD's recent movements. The dollar index (DXY) at 98.97 is exerting considerable pressure on the pair. As risk aversion rises, the dollar tends to strengthen, weighing on other currencies. The SP500 is down -1.05%, indicating a decline in risk appetite, which typically favors the dollar. This correlation is critical to monitor as it provides insight into broader market dynamics influencing GBPUSD.
Trade Plan: Riding the Bearish Wave
Given the prevailing bearish sentiment and technical indicators, a short trade setup presents a compelling opportunity. The ADX at 38.88 confirms the strong downtrend, and the MACD histogram supports the negative momentum. However, caution is warranted due to the Stochastic oscillator in extreme territory, which could lead to a temporary pullback before the downtrend resumes.
GBPUSD recovers if it breaks above the 1.34338 resistance, targeting 1.34702 and potentially 1.3532. This would require a significant shift in market sentiment and a weakening of the dollar.
GBPUSD continues its decline, breaking below the 1.33356 support, targeting 1.32738 and potentially 1.32374. This aligns with the prevailing bearish trend and strengthening dollar.
Technical Outlook Summary
| Indicator | Value | Signal |
|---|---|---|
| RSI (14) | 35.34 | Bearish |
| MACD Histogram | Negative | Bearish |
| Stochastic | %K | Bearish |
| ADX | 29.48 | Strong Trend |
| Bollinger | Middle Band | Neutral |
Key Levels
Support Levels
Resistance Levels
Frequently Asked Questions: GBPUSD Analysis
Is GBPUSD a good buy right now?
Given the bearish trend and strengthening dollar, GBPUSD is not a good buy right now. The pair is trading at 1.33696, and a break below the immediate support at 1.33356 could trigger further declines.
What is the GBPUSD price forecast for this week?
The GBPUSD price forecast for this week is bearish, with a potential target of 1.32738 if the 1.33356 support is broken. The probability of reaching this target is estimated at 75%, given the prevailing market conditions.
What are the key support and resistance levels for GBPUSD?
Key support levels for GBPUSD are at 1.33356, 1.32738, and 1.32374. Resistance levels are at 1.34338, 1.34702, and 1.3532. These levels are crucial for identifying potential entry and exit points.
Why is GBPUSD moving today?
GBPUSD is moving lower today due to a combination of factors, including a strengthening dollar index (DXY) and geopolitical tensions related to the oil crisis. The DXY is currently at 98.97, exerting downward pressure on the pair.
Track markets in real-time
AI-powered analysis, technical indicators and real-time price data.
Join Our Telegram Channel
Breaking market news, AI analysis and trading signals instantly.
Join Channel