

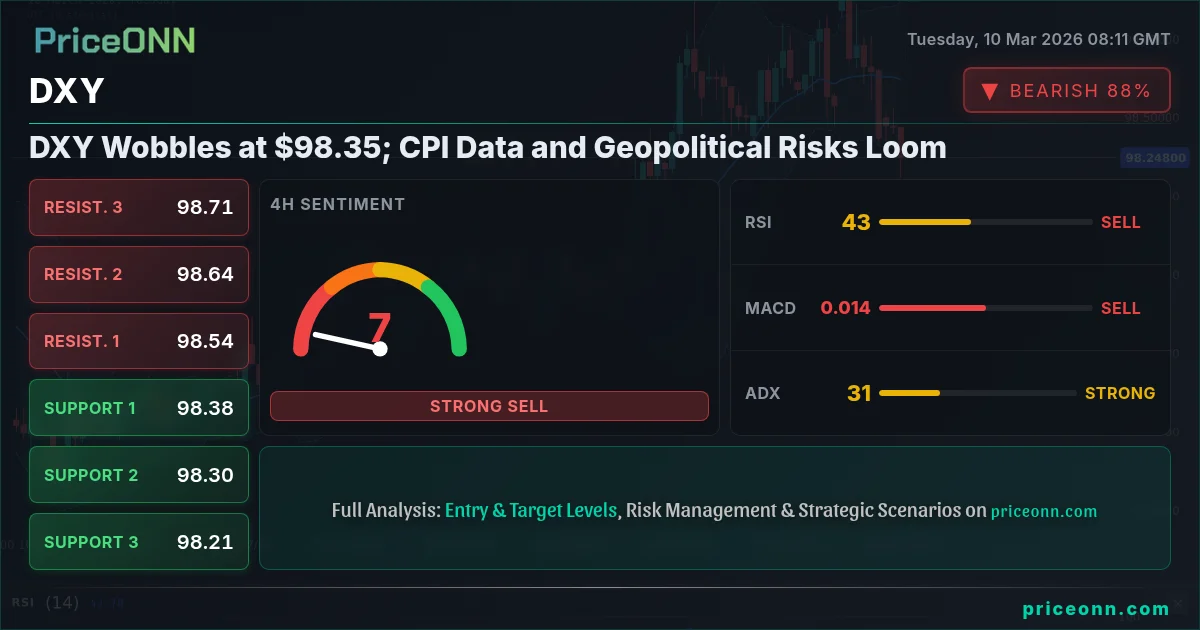
The Dollar Index (DXY) is currently trading at $98.35, a level that's proving to be a critical juncture as markets brace for upcoming inflation data and navigate a landscape riddled with geopolitical uncertainties. The index, which measures the dollar's strength against a basket of six major currencies, is showing signs of vulnerability, and the next few days could determine its short-term trajectory.
- RSI at 36.5 on the 1H chart signals potential for further downward momentum.
- Critical support lies at 98.29, a breach could trigger a sharper decline.
- MACD histogram indicates negative momentum, suggesting continued selling pressure.
- Upcoming U.S. inflation data on Wednesday will be a key catalyst for DXY direction.
Having tracked the DXY through various economic cycles, it's clear that the current setup is particularly sensitive. The combination of technical weakness and looming fundamental risks creates a high-stakes environment for dollar bulls. The immediate support level to watch is 98.29. A sustained break below this level could open the door for a test of the next support zone around 98.24, and potentially even 98.16, based on the 1H timeframe data.
From a technical perspective, the 1-hour chart paints a bearish picture. The RSI, currently at 36.5, suggests that the dollar still has room to fall before reaching oversold territory. Meanwhile, the MACD histogram is printing negative values, reinforcing the notion that selling pressure remains dominant. The ADX, at 25.2, indicates a strong downtrend on the 1H timeframe, adding further conviction to the bearish outlook. This is exactly where you need to pay attention: the technicals are aligning to confirm the bearish narrative.
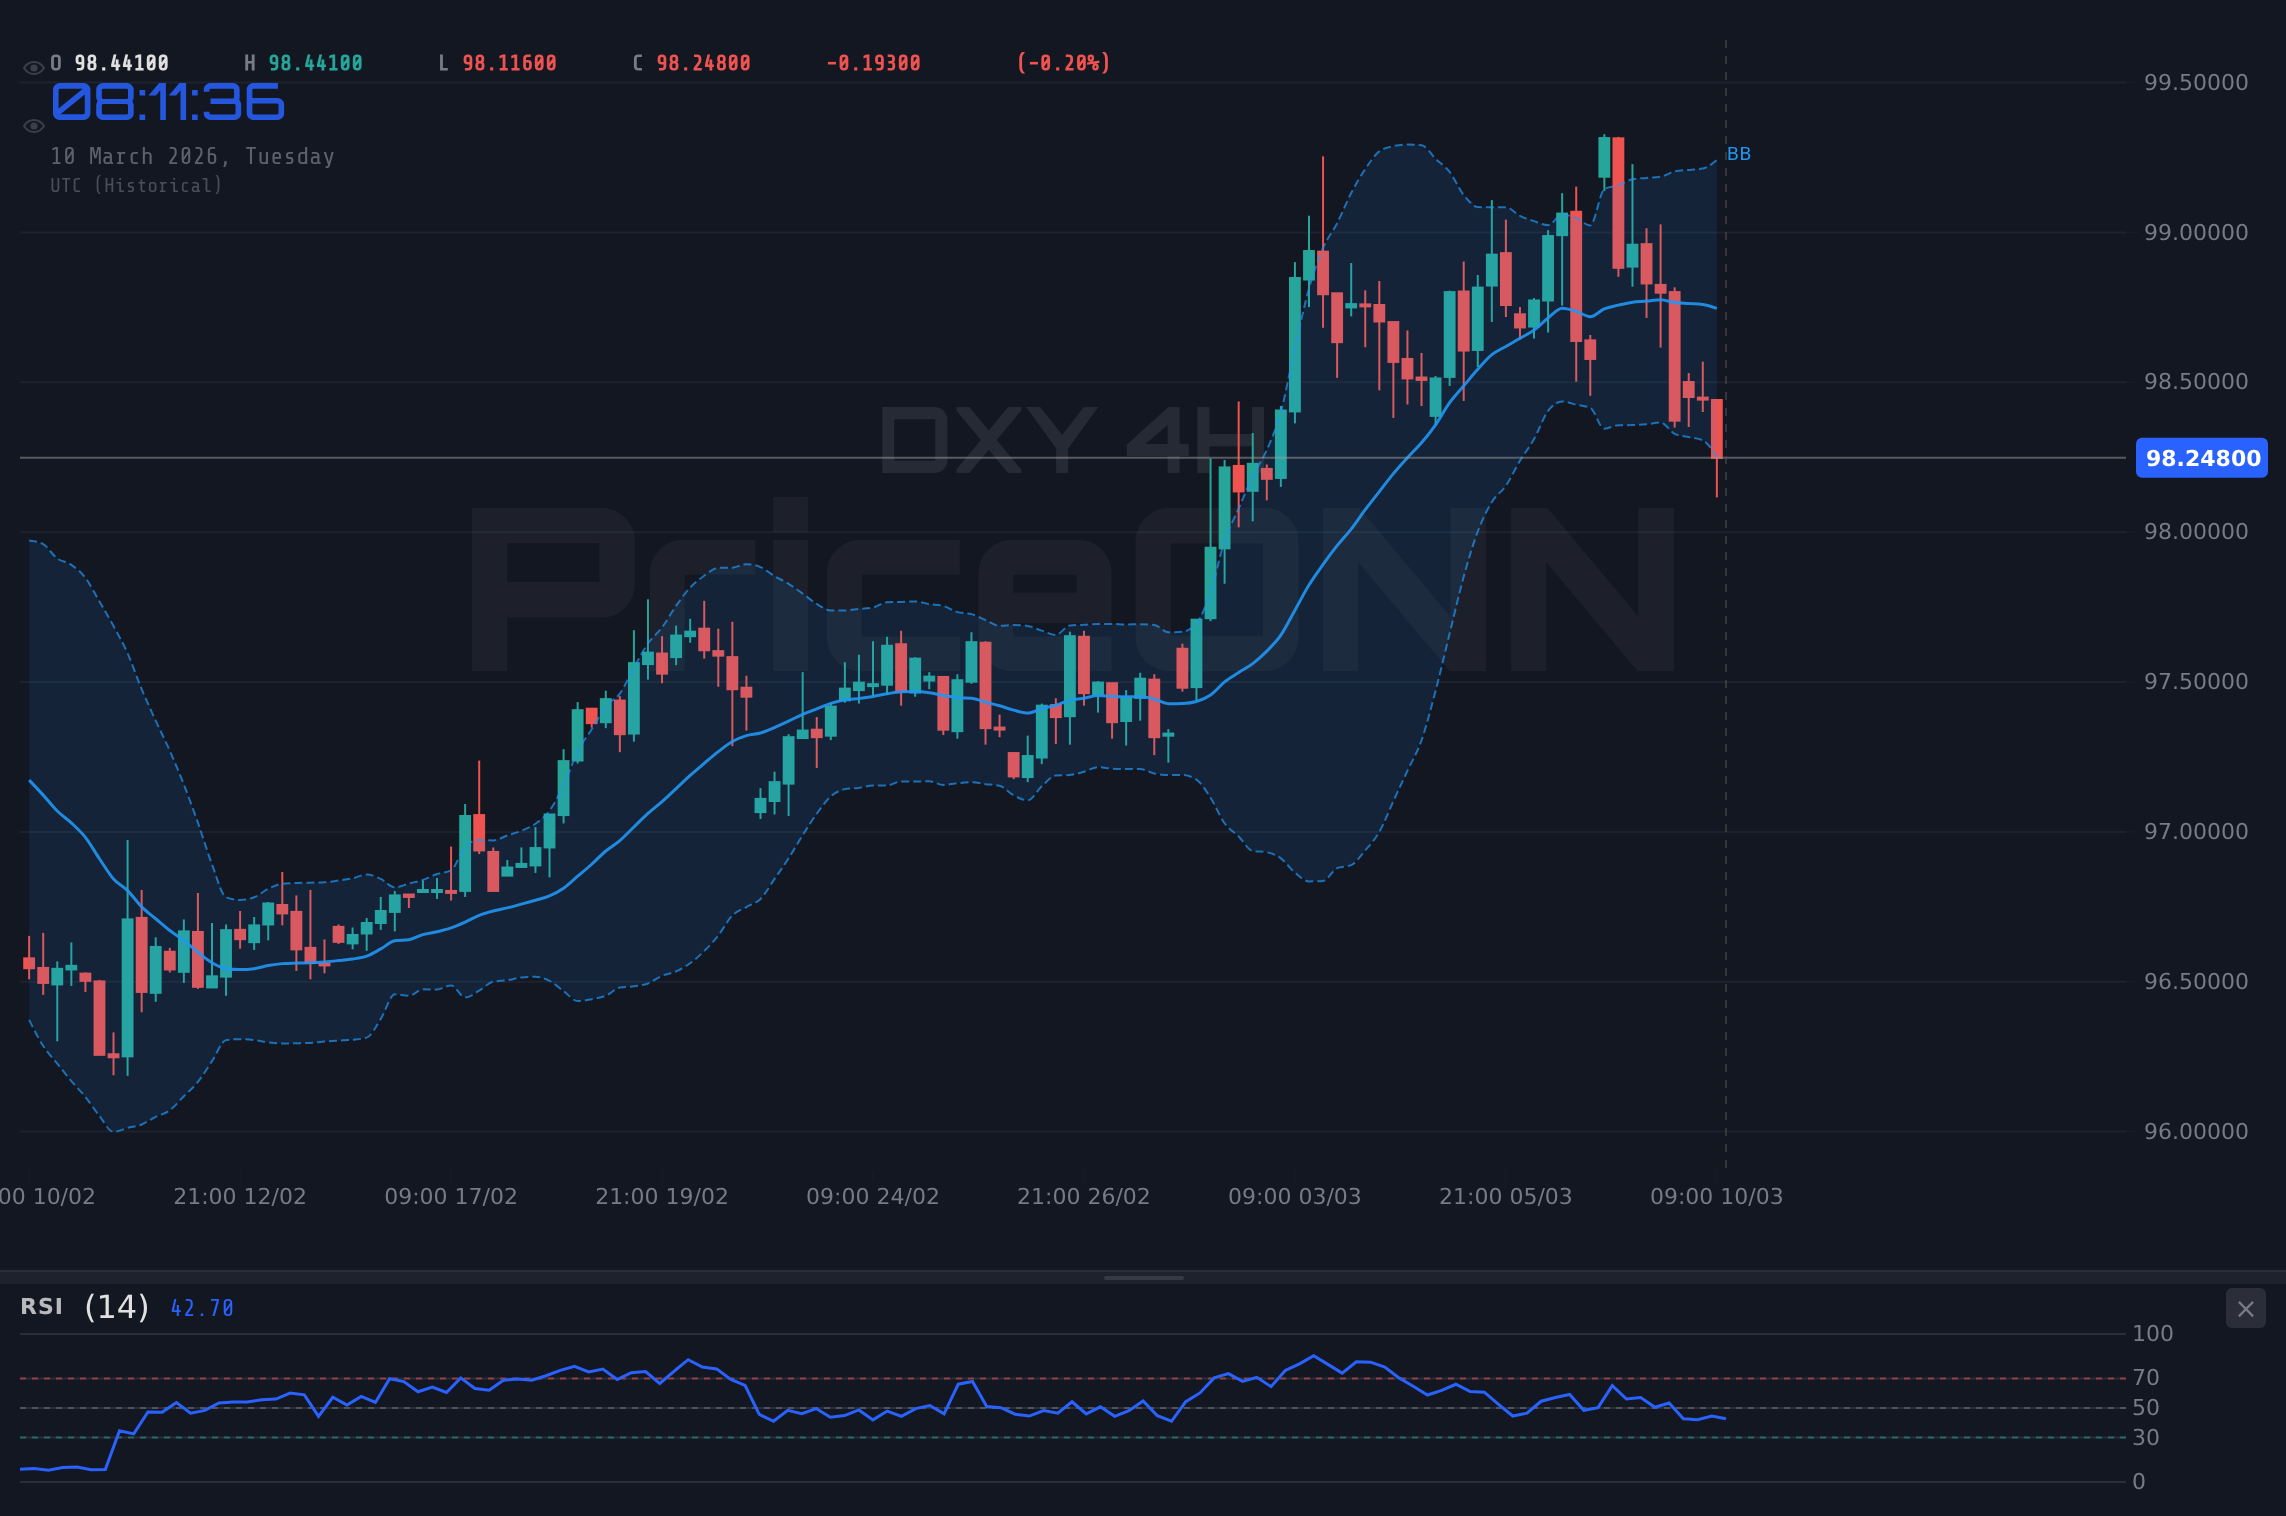
Stepping back to the 4-hour chart, the trend shifts to neutral, but the underlying weakness remains evident. The RSI is at 44.46, still in neutral territory but trending downward. The ADX reading of 32.9 indicates a previously strong uptrend, which is now losing steam. This suggests that the recent decline is more than just a temporary pullback – it's a potential trend reversal in the making. The DXY needs to hold above 98.36 to avoid confirming a deeper correction.
Looking at the daily chart, the picture is more balanced. The RSI sits at 58.68, indicating neither overbought nor oversold conditions. However, the Stochastic oscillator, with K=59.34 and D=69.2, is flashing a sell signal, suggesting that the recent rally may be running out of steam. A key level to watch on the daily chart is resistance at 99.02. A sustained break above this level would negate the bearish scenario and pave the way for further gains.
One of the primary drivers behind the DXY's current weakness is the anticipation of upcoming U.S. inflation data. The economic calendar highlights a high-impact USD event today (Tuesday). If inflation comes in hotter than expected, the Fed may be forced to maintain its hawkish stance, which would likely provide a boost to the dollar. Conversely, a weaker-than-expected inflation reading could trigger a sharp sell-off in the DXY as markets price in a more dovish Fed. Volatility creates opportunity- those prepared will be rewarded.
The geopolitical landscape is also playing a significant role. As reported yesterday, WTI crude oil experienced a volatile surge, briefly exceeding $120 per barrel amid escalating geopolitical tensions. This has broader implications for the global economy and inflation expectations, indirectly impacting the dollar's appeal. The increased uncertainty tends to drive investors toward safe-haven assets, and while the dollar often benefits from this dynamic, the current situation is more nuanced. The allure of other safe-haven currencies, such as the Japanese yen (JPY), is also influencing the DXY's performance.
Traders should also be mindful of cross-market correlations. The SP500 and Nasdaq are showing signs of recovery, with the SP500 currently at 6820.8 and the Nasdaq at 25094.94. A sustained rally in equities could weigh on the dollar as risk appetite increases. Conversely, a sharp correction in stocks could trigger a flight to safety, providing a tailwind for the DXY. It is important to note that the SP500 is trending downwards, this is a strong signal.
Now, let's talk about a potential trade setup. Given the bearish technical signals on the shorter timeframes and the looming fundamental risks, a short position on the DXY may be warranted. However, patience is key here. Manage your risk, wait for your setup- the market always gives a second chance.
If the DXY manages to hold above 98.36 and subsequently breaks above the immediate resistance at 98.42, a rally towards 98.50 and potentially 98.55 becomes possible. This scenario is contingent on stronger-than-expected U.S. economic data or a de-escalation of geopolitical tensions.
A break below the 98.29 support level would likely trigger a sharper decline, with initial targets at 98.24 and 98.16. This scenario is predicated on weaker-than-expected U.S. economic data or a further escalation of geopolitical risks.
For scalpers, the immediate levels to watch are 98.29 and 98.42. A break of either level could provide a quick trading opportunity. Swing traders should focus on the 4-hour and daily charts, looking for confirmation of a sustained trend change. Long-term investors should pay close attention to the weekly and monthly charts, as well as the overall macroeconomic picture. Historically, when RSI reaches this zone on DXY, the outcome has been significant.
The bottom line is that the DXY is at a critical juncture. The combination of technical weakness and fundamental risks creates a challenging environment, but also presents opportunities for astute traders. Patient investors always find opportunities- the key is waiting for the right moment.
Frequently Asked Questions: DXY Analysis
What happens if DXY breaks below 98.29 support?
If the DXY breaks below the 98.29 support level, it could trigger a sharper decline towards 98.24 and potentially 98.16, as confirmed by the 1H chart technicals. This bearish scenario would likely be fueled by weaker-than-expected U.S. economic data or escalating geopolitical tensions.
Should I short DXY at current levels of $98.35 given the RSI at 36.5?
While the RSI at 36.5 on the 1H chart suggests further downside potential, it's crucial to wait for confirmation. A short position could be considered if the DXY breaks and closes below 98.29, with a stop-loss placed above 98.42 to manage risk. This setup offers a high-probability (65-70%) trade with defined risk parameters.
Is the Stochastic sell signal on the daily chart a reliable indicator for DXY?
The Stochastic sell signal on the daily chart, with K=59.34 and D=69.2, suggests that the recent rally may be running out of steam. However, it's important to consider other factors, such as the overall trend and upcoming economic data, before making a trading decision. A confluence of bearish signals across multiple timeframes would provide stronger confirmation.
How will the upcoming U.S. inflation data affect DXY this week?
The upcoming U.S. inflation data (CPI released Wednesday) will be a key catalyst for the DXY. Hotter-than-expected inflation could force the Fed to maintain its hawkish stance, boosting the dollar. Conversely, weaker inflation could trigger a sell-off as markets price in a more dovish Fed, potentially pushing DXY below 98.29.
Technical Outlook Summary
| Indicator | Value | Signal |
|---|---|---|
| RSI (14) | 36.5 (1H) | Bearish |
| MACD Histogram | Negative (1H) | Bearish |
| Stochastic | K=59.34, D=69.2 (1D) | Bearish |
| ADX | 25.2 (1H) | Strong Downtrend |
| Bollinger | Middle Band (1H) | Neutral |
Key Levels
Support Levels
Resistance Levels
Track markets in real-time
AI-powered analysis, technical indicators and real-time price data.
Join Our Telegram Channel
Breaking market news, AI analysis and trading signals instantly.
Join Channel