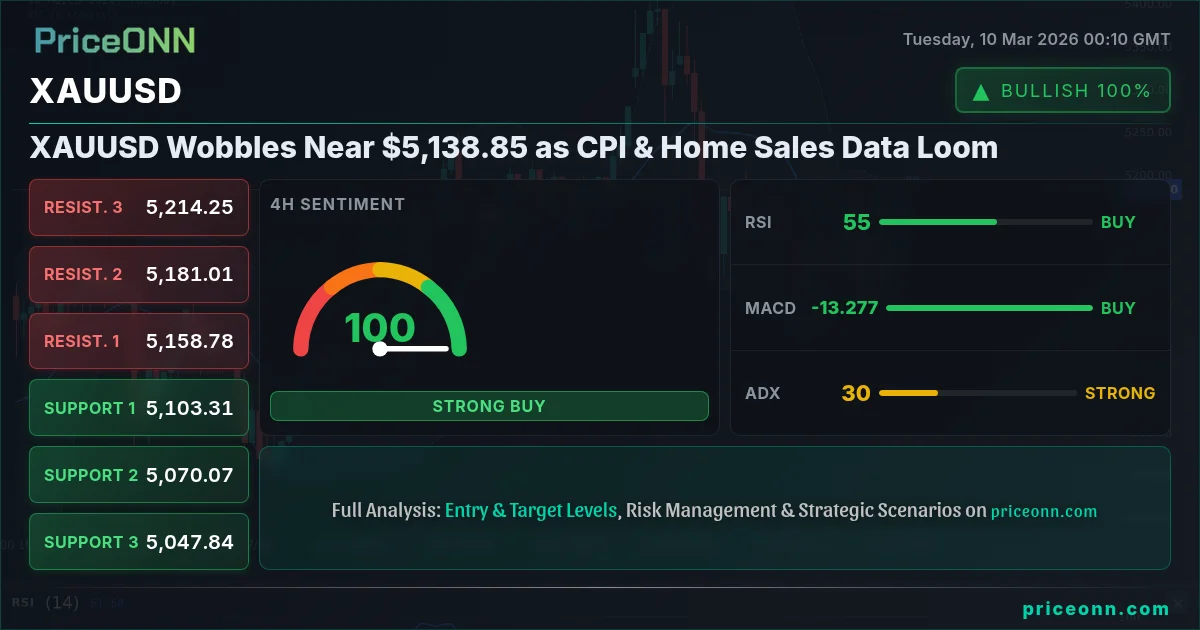
As geopolitical tensions continue to simmer, gold (XAUUSD) finds itself in a precarious position near $5,138.85. With inflation data and home sales figures on the horizon, the precious metal's next move hinges on factors beyond safe-haven demand.
- RSI at 57.23 on the 1H chart suggests neutral momentum, but a potential for upside.
- Critical support lies at $5,129.01, a level that must hold to avert further declines.
- MACD on the 1H chart shows positive momentum, potentially signaling a short-term bullish trend.
- DXY's current level of 98.65 is exerting pressure on gold, requiring careful monitoring of the inverse correlation.
The current market sentiment surrounding XAUUSD is a complex blend of risk aversion and economic realities. The recent surge in oil prices, briefly exceeding $120 per barrel, as reported earlier this week, has introduced an inflationary narrative that traditionally supports gold. However, a strengthening US Dollar, currently reflected in the DXY at 98.65, is acting as a counterweight, curbing gold's potential gains. All eyes remain on the conflict in the Middle East, as any escalation could trigger a flight to safety, bolstering gold's appeal.
Examining the technical landscape, the 1-hour chart presents a mixed bag of signals. The RSI, hovering at 57.23, suggests neither overbought nor oversold conditions, indicating that the market is awaiting a catalyst. The MACD histogram, however, shows positive momentum, hinting at a potential bullish bias in the short term. A critical level to watch is the immediate support at $5,129.01. A breach below this level could open the door for further declines towards $5,105.47 and $5,093.61. Conversely, a sustained move above the immediate resistance at $5,164.41 could pave the way for tests of $5,176.27 and $5,199.81.
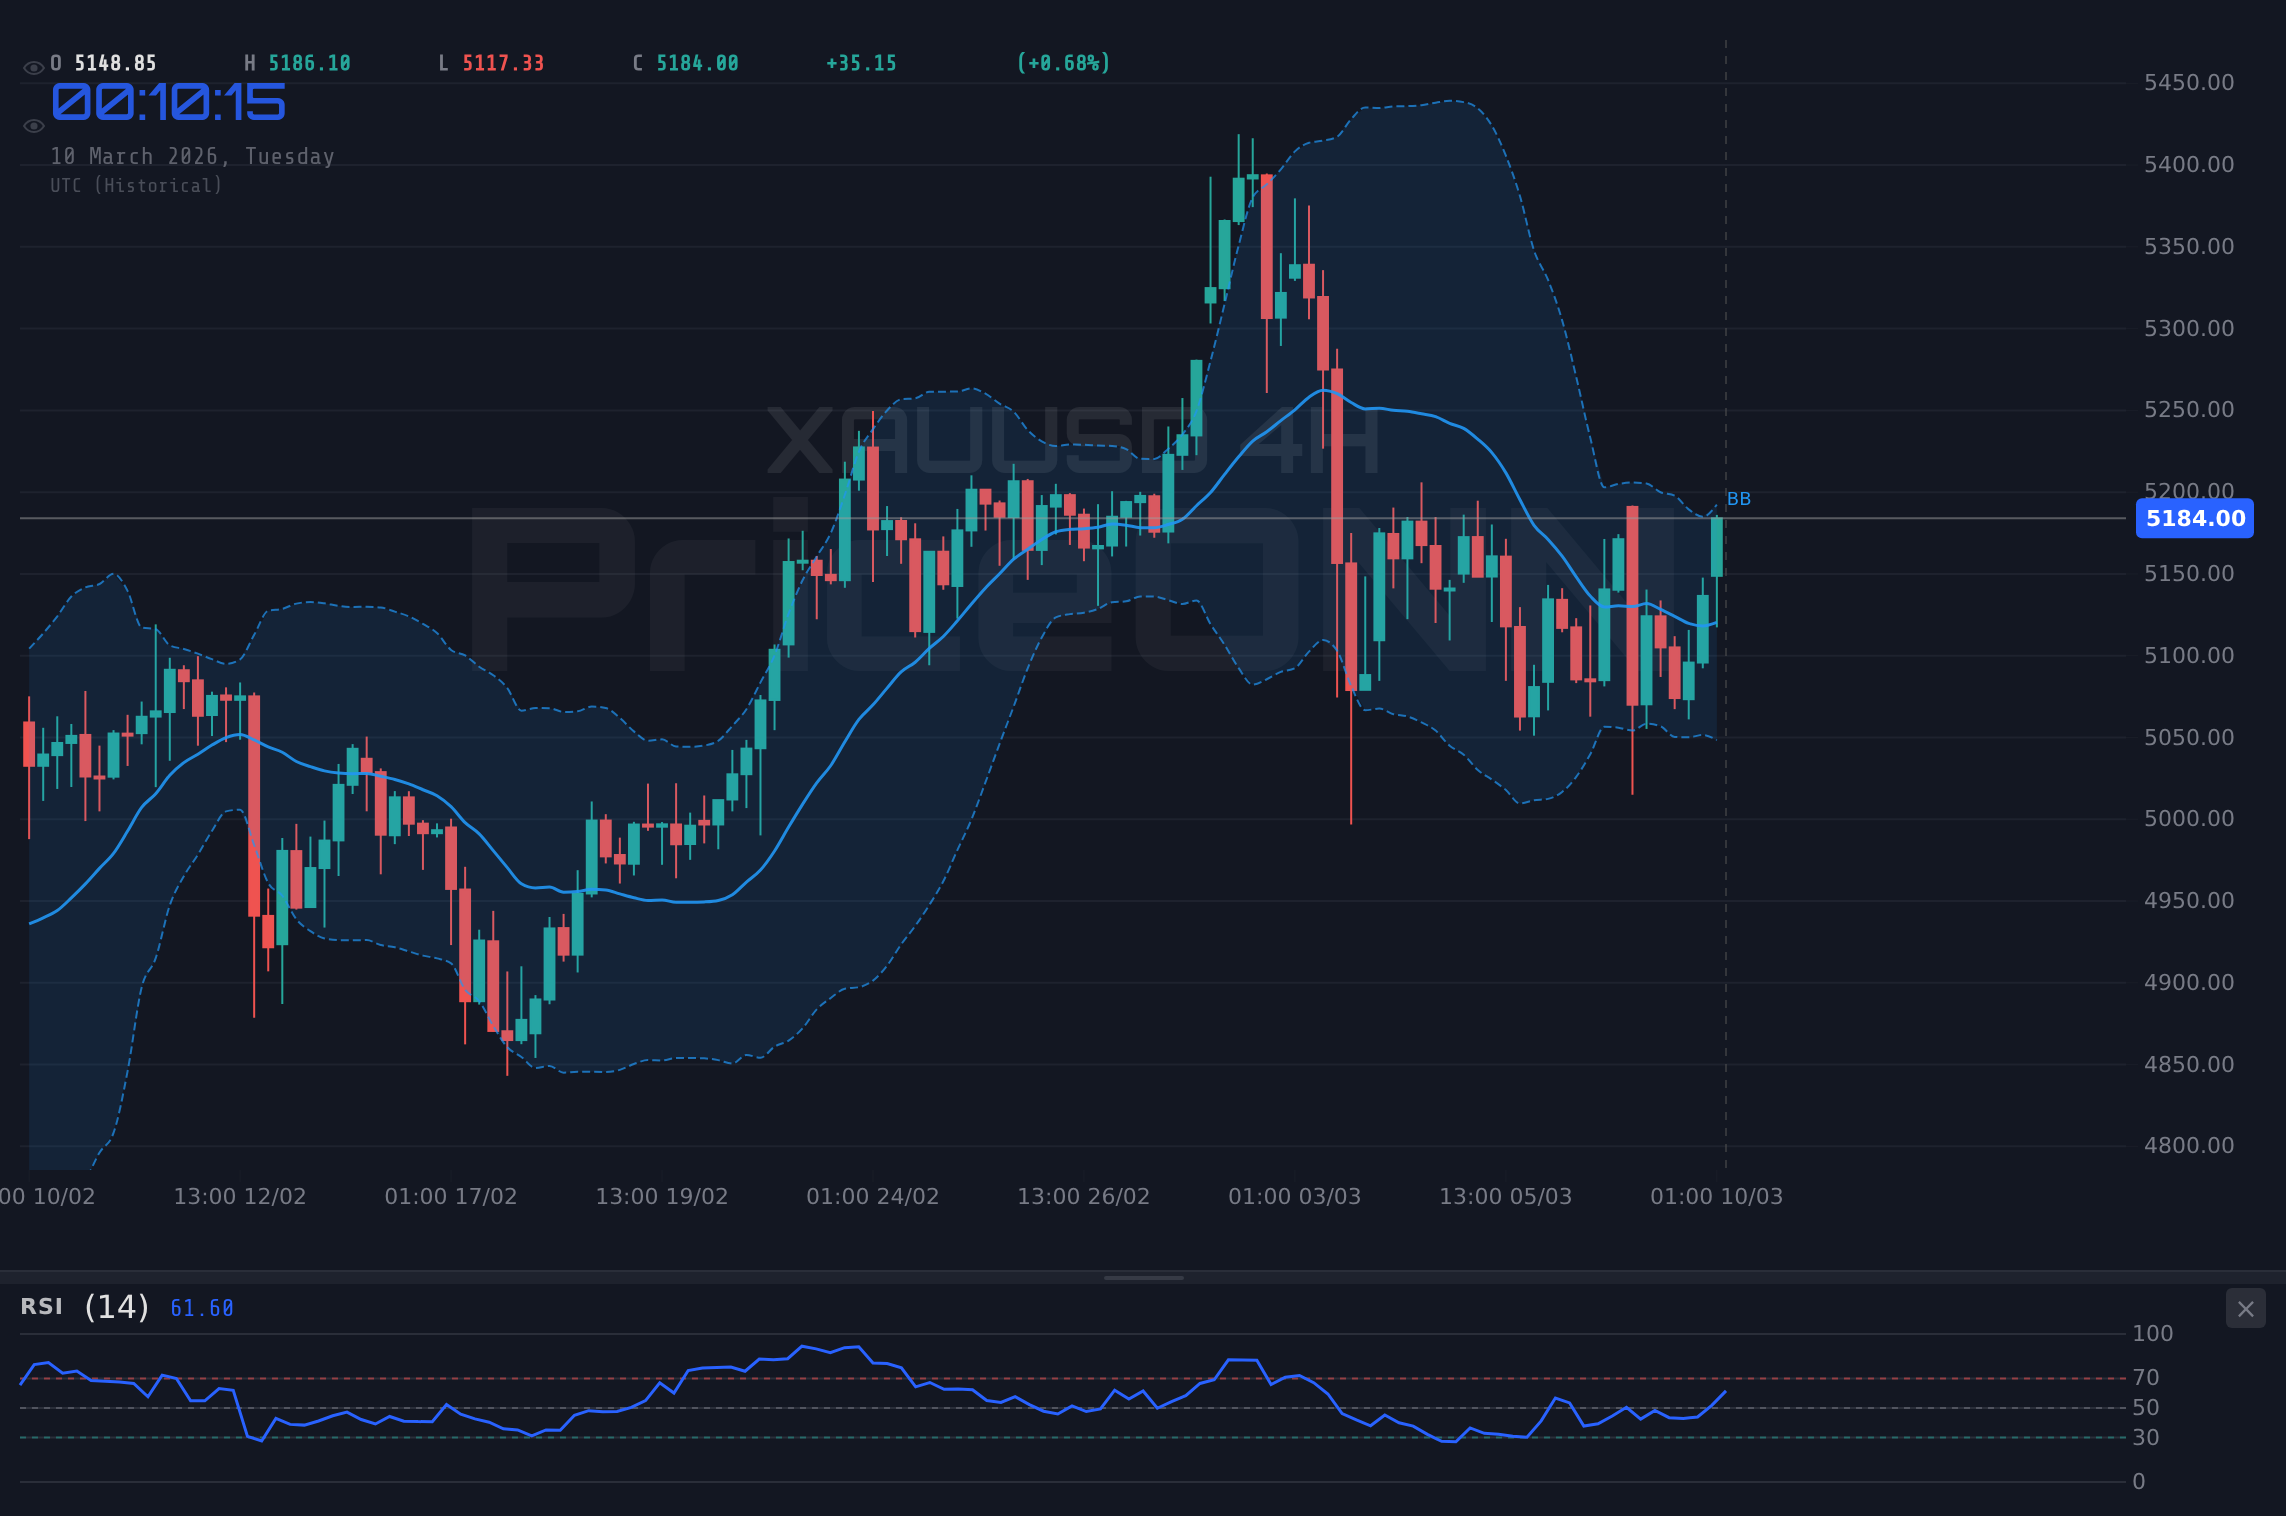
Stepping back to the 4-hour timeframe, the picture becomes slightly more nuanced. The RSI at 50.34 is neutral, mirroring the indecision seen on the 1-hour chart. However, the ADX reading of 30.52 points to a strong downtrend, a signal that cannot be ignored. Key support to monitor on this timeframe lies at $5,065.98, followed by $5,036.16 and $5,011.26. Resistance is observed at $5,120.7, $5,145.6, and $5,175.42. The stochastic oscillator shows K=49.72 and D=53.18, hinting at a potential bearish crossover.
Zooming out to the daily chart, the longer-term trend is less clear. The RSI sits at 53.79, within neutral territory. The ADX reading of 13.98 suggests a weak trend, further emphasizing the current market indecision. Support is identified at $5,097.86, $5,024.48, and $4,986.24, while resistance is found at $5,209.48, $5,247.72, and $5,321.1. The MACD shows negative momentum, indicating downward pressure. The stochastic oscillator shows K=31.62 and D=50.06, potentially signalling bearish continuation.
The upcoming economic data releases, particularly the CPI and home sales figures, are poised to inject volatility into the XAUUSD market. Any significant deviation from expectations could trigger sharp price swings. It's crucial to remember that gold's performance is often inversely correlated with the DXY. Therefore, a strengthening dollar, driven by hawkish Fed expectations or positive economic data, could weigh heavily on gold prices. Conversely, weaker-than-expected data could weaken the dollar and provide a tailwind for XAUUSD.
Comparing XAUUSD to its silver counterpart, XAGUSD, offers additional insights. Silver is currently trading at $87.45, exhibiting a daily change of 3.76%. While gold is down 0.63%, silver is up, indicating different market dynamics at play. Silver's industrial demand, as highlighted in recent analysis, makes it more sensitive to economic growth prospects than gold, which is primarily viewed as a safe-haven asset.
From a trading perspective, the mixed technical signals and the impending economic data releases call for a cautious approach. Scalpers may find opportunities in the short-term volatility, while swing traders might prefer to wait for a clearer trend to emerge. Long-term investors should focus on the broader macroeconomic picture, including inflation expectations, interest rate policies, and geopolitical risks. The ADX across multiple time frames does not provide a unified signal, further complicating the immediate outlook.
The key takeaway for traders lies in understanding that the current market environment is characterized by conflicting forces. The safe-haven appeal of gold is being challenged by a strengthening dollar, while inflationary pressures are providing some support. The upcoming economic data releases will likely serve as the tiebreaker, dictating the direction of XAUUSD in the near term.
If XAUUSD breaks above the resistance at $5,164.41 and sustains above $5,176.27, it could target $5,199.81. A sustained rally requires DXY weakness and dovish Fed signals.
If XAUUSD breaks below the support at $5,129.01 and closes below $5,105.47, it could decline towards $5,093.61. This requires DXY strength and hawkish Fed signals.
Frequently Asked Questions: XAUUSD Analysis
Is XAUUSD a good buy right now?
XAUUSD near $5,138.85 presents a mixed picture. A buy signal requires a DXY pullback and a break above the $5,164.41 resistance, otherwise, caution is warranted given the strong downtrend indicated by some ADX readings.
What is the XAUUSD price forecast for this week?
This week's XAUUSD forecast hinges on CPI and home sales data. A bullish scenario targets $5,199.81 with a 40% probability, while a bearish scenario aims for $5,093.61 with a 60% probability given the current market sentiment.
What are the key support and resistance levels for XAUUSD?
Key support levels for XAUUSD are $5,129.01, $5,105.47, and $5,093.61. Key resistance levels are $5,164.41, $5,176.27, and $5,199.81. These levels are critical for identifying potential breakout or breakdown points.
Why is XAUUSD moving today?
XAUUSD's movement today is influenced by rising oil prices, a strengthening US Dollar (DXY at 98.65), and anticipation of upcoming CPI and home sales data. Geopolitical tensions are also playing a role, creating a complex interplay of factors.
Track markets in real-time
AI-powered analysis, technical indicators and real-time price data.
Join Our Telegram Channel
Breaking market news, AI analysis and trading signals instantly.
Join Channel