

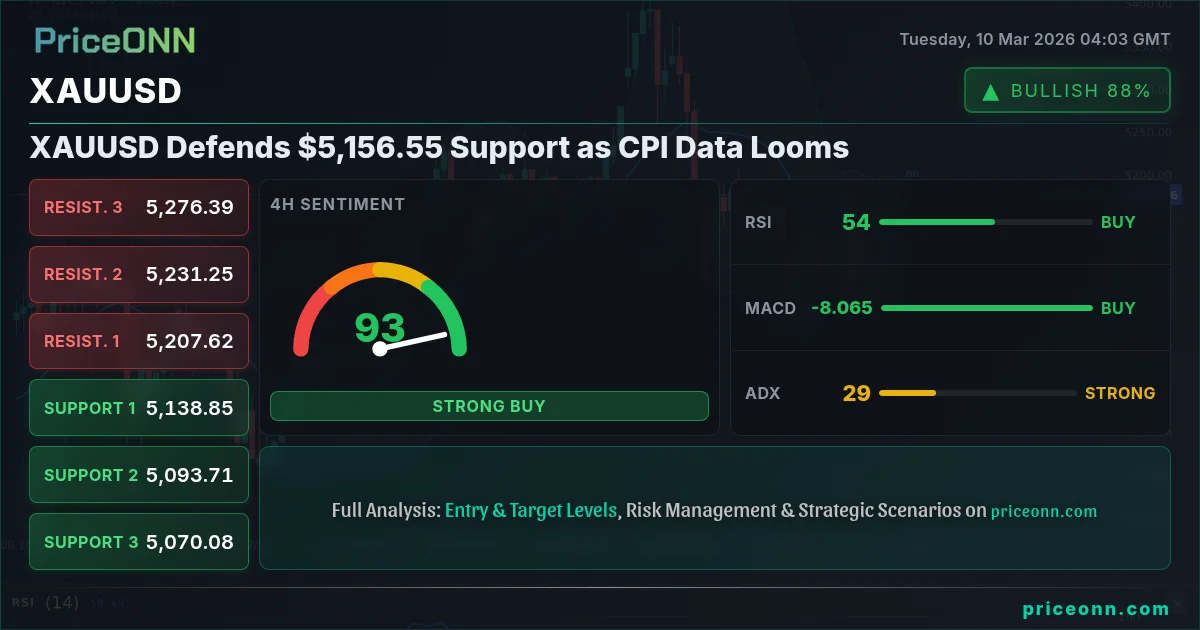
As traders brace for upcoming CPI data, XAUUSD is currently defending the $5,156.55 level. The strength of the dollar, as reflected in the DXY's recent gains, is weighing on gold, but underlying geopolitical tensions continue to provide a floor.
- RSI at 57.68 on the 1H chart suggests neutral momentum, but with a slight bullish bias.
- Immediate support is identified at $5,157.52, a level closely watched by intraday traders.
- A break above $5,180.22 resistance could signal a continuation of the upward trend.
- Dollar strength, with DXY at 98.67, is a significant headwind for XAUUSD.
Technical Overview: Bulls Defending Key Levels
The hourly chart shows XAUUSD in a precarious position. While the overall trend on the 1H timeframe is still bullish with a strength of 92%, the ADX reading of 13.22 suggests this trend is weak. The current price of $5,156.55 is just above the immediate support level of $5,157.52. The RSI, currently at 57.68, indicates neutral momentum, neither overbought nor oversold. A concerning signal for bulls comes from the Stochastic oscillator, with K=81.68 and D=85.59, reflecting overbought conditions which might lead to a short-term pullback. However, the MACD remains positive, suggesting underlying bullish momentum.
Zooming out to the 4-hour timeframe, the picture becomes less clear. The trend is neutral, and the ADX rises to 29.63 indicating a strong trend, but the direction is not clear. The RSI is at 52.2, further confirming the neutral stance. The Stochastic oscillator shows a bullish signal (K=64.82, D=52.92) but Bollinger Bands are suggesting that the price is near the upper band, so a pullback is possible. For the bulls to regain control, they need to push the price above the $5,158.78 resistance level.
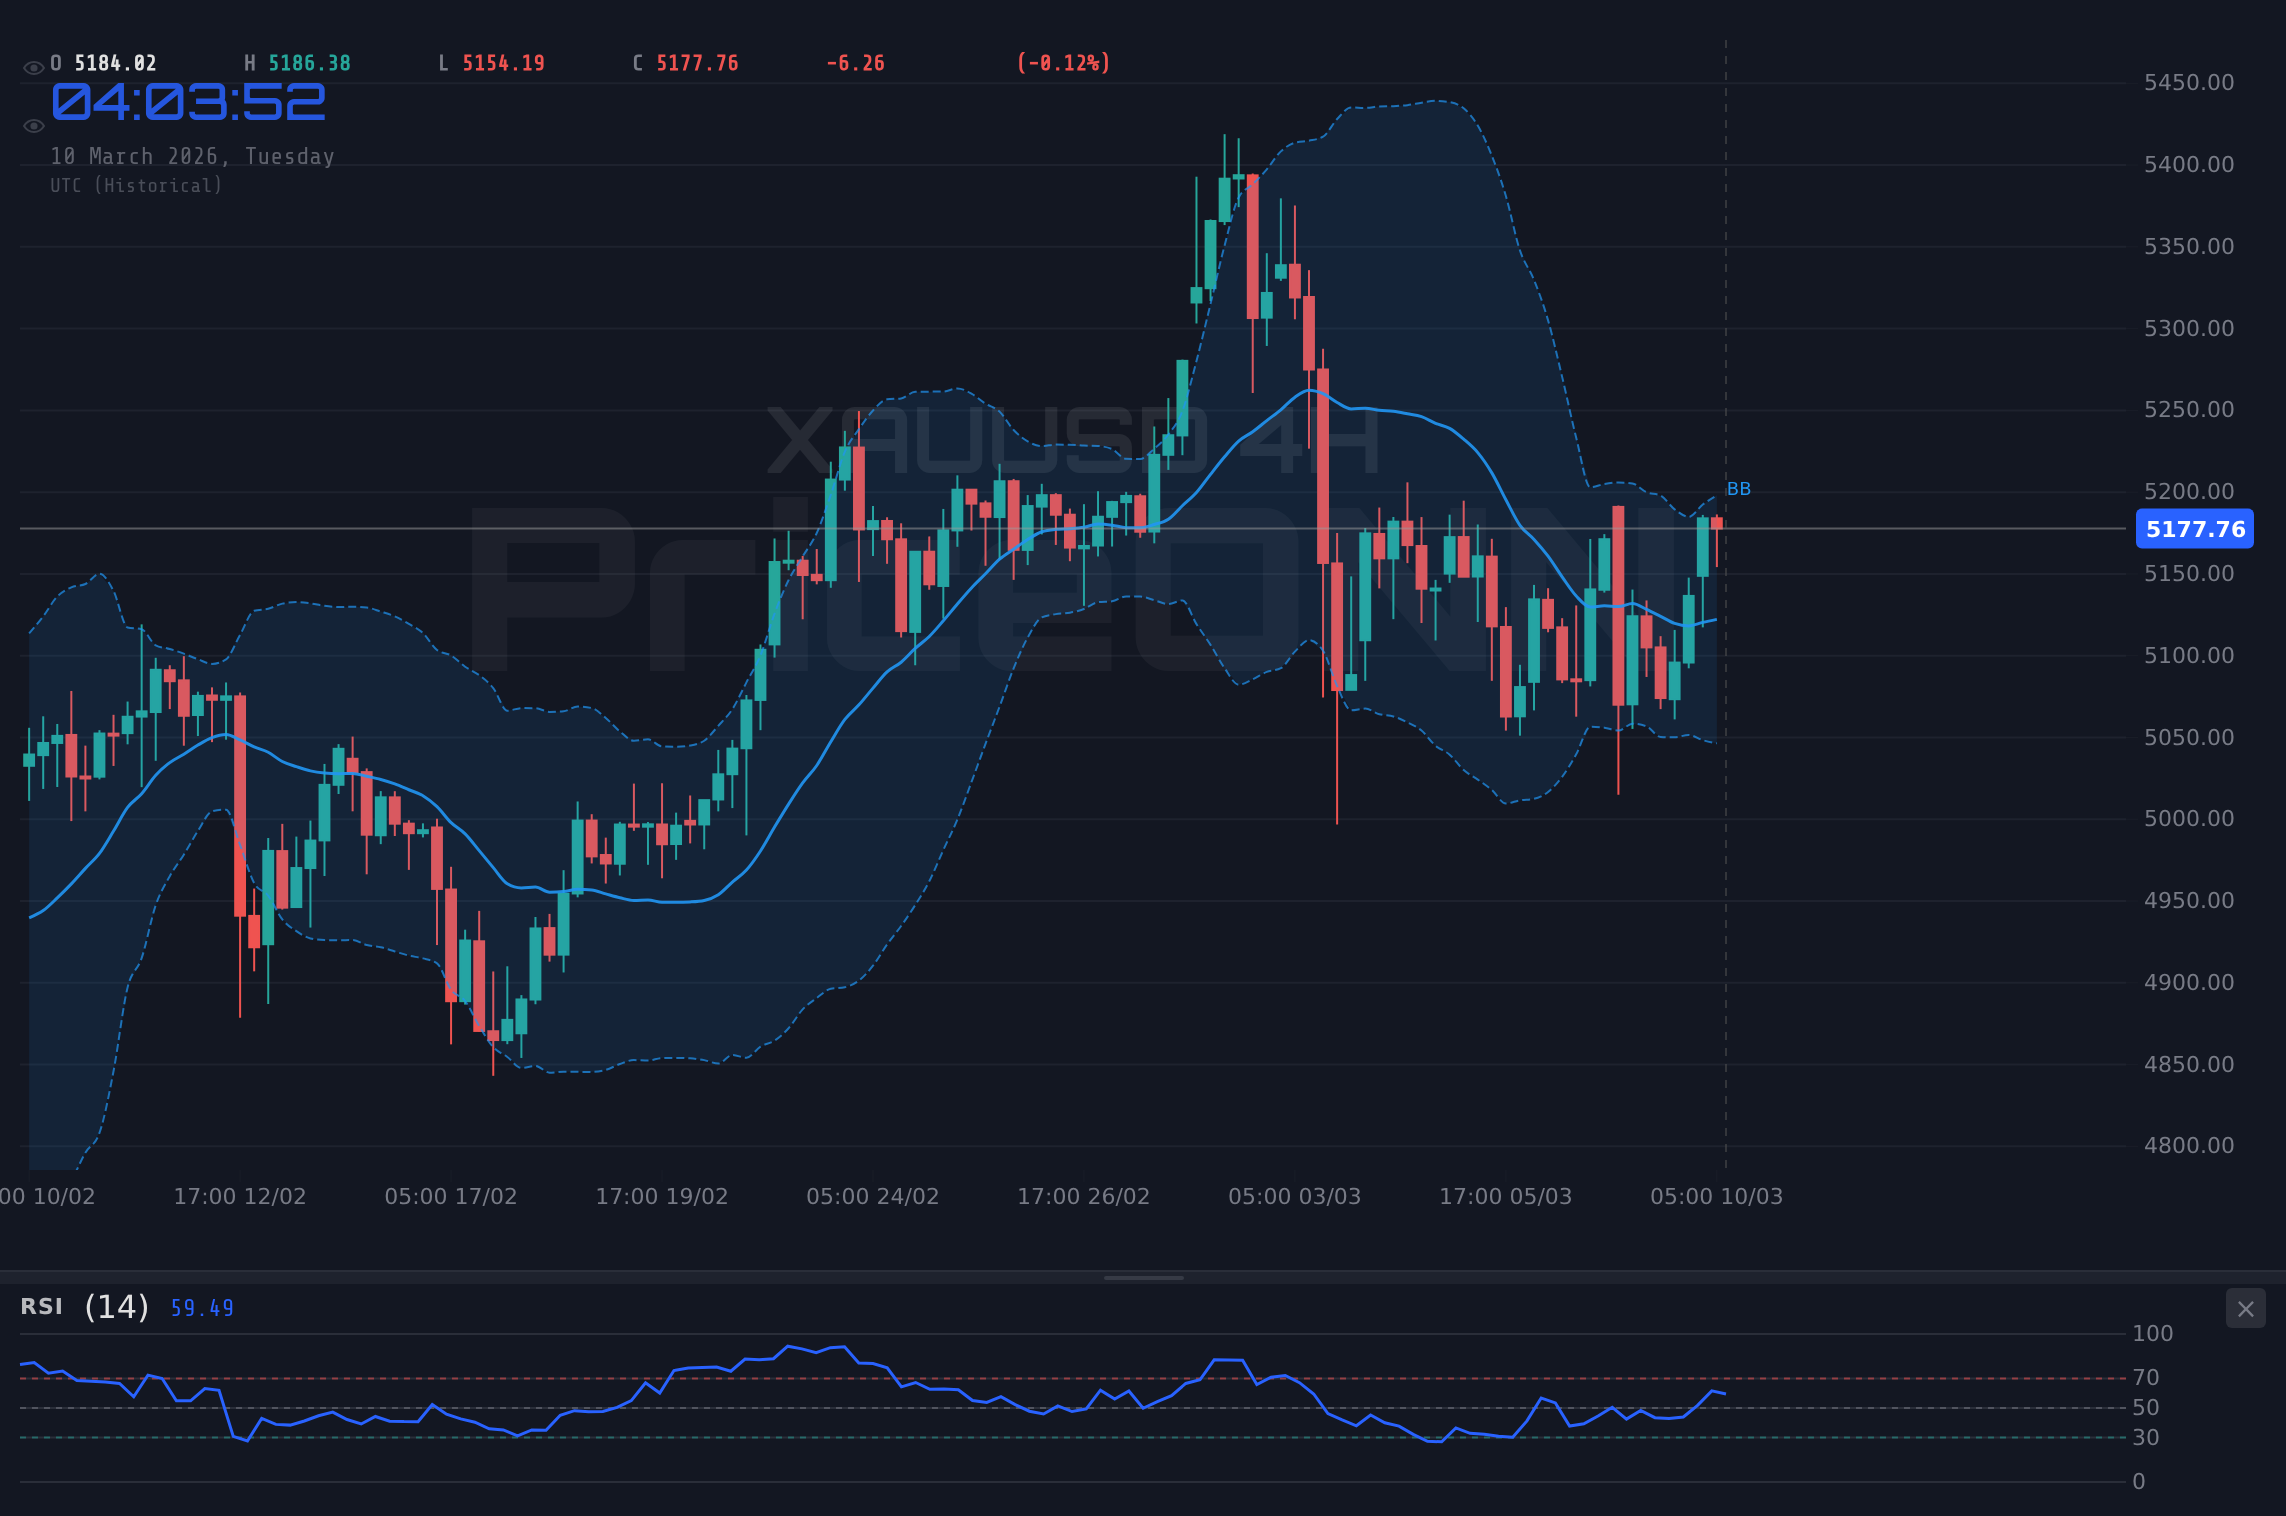
On the daily chart, XAUUSD is also showing a neutral trend. The price is trading above the middle Bollinger Band, generally a bullish sign. However, the Stochastic oscillator (K=37.42, D=41.44) is showing a bearish signal. The key resistance to watch on the daily is $5,213.97. A daily close above this level would confirm a strong bullish reversal. The daily ADX is weak at 13.36, which is not confirming the trend.
Dollar Strength vs. Geopolitical Risk: The Tug-of-War
The primary headwind for gold remains the strength of the US dollar. The DXY is currently at 98.67, a level that typically puts downward pressure on gold prices. As Reuters reported, Fed officials continue to emphasize the need to maintain a hawkish stance until inflation is clearly under control. This expectation of continued high interest rates supports the dollar, making gold less attractive as an investment. The US Dollar index's direction is a crucial element to monitor, particularly with the US Dollar index indicating a general buy signal across multiple timeframes. Monday saw Japan release some key figures; however, the main focus remains on the US Dollar as a driver of XAUUSD.
However, geopolitical risks continue to support gold's safe-haven appeal. Tensions in the Middle East remain elevated, and any escalation could trigger a flight to safety, benefiting gold. As noted by multiple sources, the conflict in the Middle East is keeping inflationary pressures elevated, further supporting gold's appeal as an inflation hedge.
The recent spike in oil prices, with WTI at $90.06, is also adding to inflationary concerns. Historically, gold has performed well during periods of high inflation, as investors seek to preserve their purchasing power.
Key Levels to Watch: Support and Resistance
Traders should closely monitor the following key levels for XAUUSD:
- Immediate Support: $5,157.52 (1H chart)
- Stronger Support: $5,103.31 (4H chart)
- Key Resistance: $5,180.22 (1H chart)
- Daily Resistance: $5,213.97 (1D chart)
A break below $5,157.52 could trigger a sell-off towards the $5,103.31 level. Conversely, a sustained move above $5,180.22 would likely open the door for a test of the $5,213.97 resistance on the daily chart.
Trade Plan: Cautious Optimism
Given the conflicting signals, a cautious approach is warranted. While the overall bias is slightly bullish, the dollar's strength and the overbought conditions on the short-term charts suggest a pullback is possible. Here's a potential trade plan:
If XAUUSD breaks above $5,180.22 (1H resistance), look for a continuation towards $5,194.65 and then $5,213.97. A sustained move above $5,213.97 could signal a larger rally.
If XAUUSD fails to hold $5,157.52 support, expect a move towards $5,103.31 (4H support) and potentially lower to $5,070.07. A daily close below $5,103.31 would invalidate the bullish thesis.
Entry Trigger: A confirmed break above $5,180.22 with increasing volume.
Target 1: $5,194.65
Target 2: $5,213.97
Stop/Invalidation: A close below $5,157.52 on the hourly chart.
Economic Calendar: CPI Data in Focus
The economic calendar is relatively light this week, with the major focus being Wednesday's CPI data release. As we approach Wednesday, the markets will be closely watching. The previous reading was 3.91.
Beyond the CPI data, traders should also keep an eye on any developments regarding geopolitical tensions. Any escalation in the Middle East could lead to a renewed surge in safe-haven demand, benefiting gold.
Frequently Asked Questions: XAUUSD Analysis
What happens if XAUUSD breaks above $5,180.22 resistance?
A break above $5,180.22 could trigger a rally towards $5,194.65 and potentially $5,213.97. A daily close above $5,213.97 would confirm a strong bullish reversal, opening the door for further gains.
Should I buy at current $5,156.55 levels given RSI at 57.68?
The RSI at 57.68 suggests neutral momentum, so buying at current levels is risky. A better strategy would be to wait for a confirmed break above $5,180.22 with increasing volume, which would signal stronger bullish momentum.
Is Stochastic K=81.68 a sell signal for XAUUSD right now?
A Stochastic K=81.68 reflects overbought conditions, suggesting a short-term pullback is possible. It's not a definitive sell signal, but it warrants caution and suggests waiting for a better entry point.
How will the Wednesday CPI data affect XAUUSD this week?
If CPI data comes in higher than expected, it could strengthen the dollar and put downward pressure on XAUUSD. Conversely, weaker-than-expected CPI data could weaken the dollar and support gold prices.
Technical Summary
Here’s a snapshot of XAUUSD's technical health across key indicators:
Technical Outlook Summary
| Indicator | Value | Signal |
|---|---|---|
| RSI (14) - 1H | 57.68 | Neutral |
| MACD Histogram - 1H | Positive | Bullish |
| Stochastic - 1H | K=81.68, D=85.59 | Overbought |
| ADX - 1H | 13.22 | Weak Trend |
| Bollinger - 1H | Middle Band | Watch |
Key Levels
Support Levels
Resistance Levels
Track markets in real-time
AI-powered analysis, technical indicators and real-time price data.
Join Our Telegram Channel
Breaking market news, AI analysis and trading signals instantly.
Join Channel