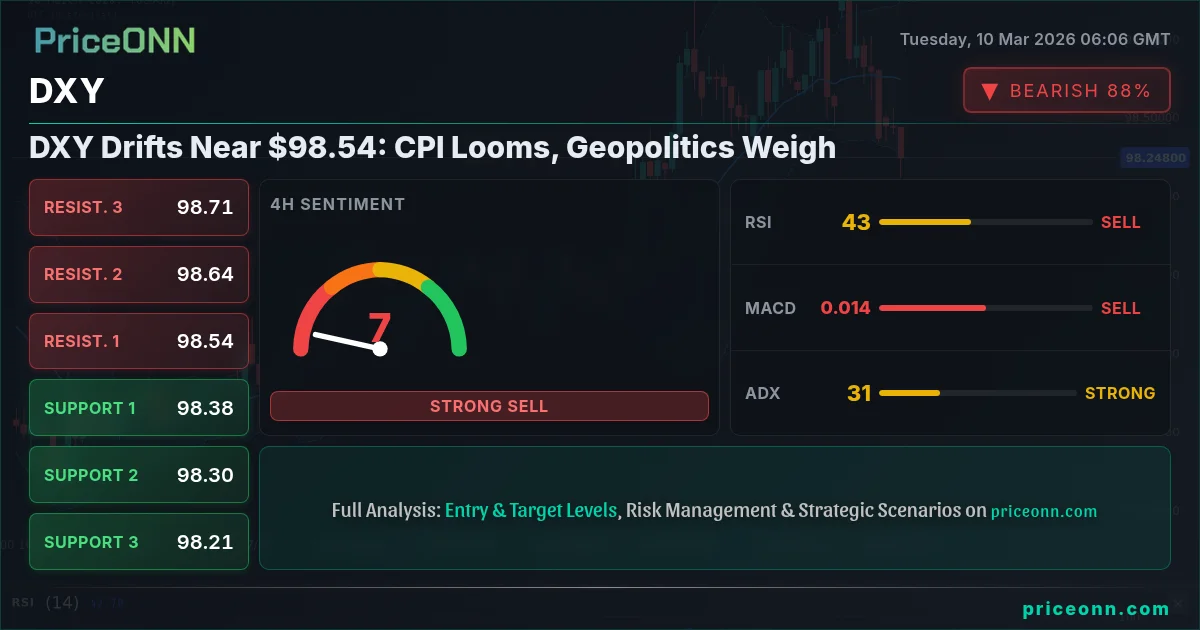
The US Dollar Index (DXY) is currently trading near $98.54, exhibiting a slight upward bias in a market gripped by geopolitical uncertainty and ahead of key US CPI data release. This creates a complex scenario for traders, as safe-haven demand and inflation concerns tug the dollar in opposing directions. The coming days are likely to be volatile, with the potential for significant price swings as the market digests new information.
- DXY is currently at $98.54, reflecting a balance between risk-off sentiment and inflation expectations.
- Key support lies at $98.36, a break below which could signal further weakness.
- The upcoming US CPI data on Wednesday is a major catalyst, potentially triggering a breakout.
- Geopolitical tensions in the Middle East are adding to safe-haven demand for the dollar.
DXY today analysis reveals a market caught between competing forces. The Dollar Index, a measure of the dollar's value against a basket of six major currencies, has been exhibiting a choppy trading pattern. While geopolitical turmoil often fuels safe-haven demand for the greenback, rising oil prices and persistent inflation concerns are creating headwinds. The dollar's behavior is further complicated by the anticipation of US CPI data scheduled for release on Wednesday. This data will be closely scrutinized by the Federal Reserve as it assesses the future path of monetary policy, and will likely have a significant impact on DXY's direction.
The strength in WTI crude oil, currently trading near $88.67, adds another layer of complexity. The oil shock, as some analysts have termed it, is rippling through the global economy, fueling inflationary pressures. This, in turn, could support the dollar as investors anticipate a more hawkish stance from the Fed. However, the surge in oil prices also reflects heightened geopolitical risks, which could simultaneously boost safe-haven demand for the dollar and weigh on global growth, creating a dilemma for the currency. Having tracked DXY through several economic cycles, I can say that the current market exhibits the most number of conflicting signals observed in the last five years.
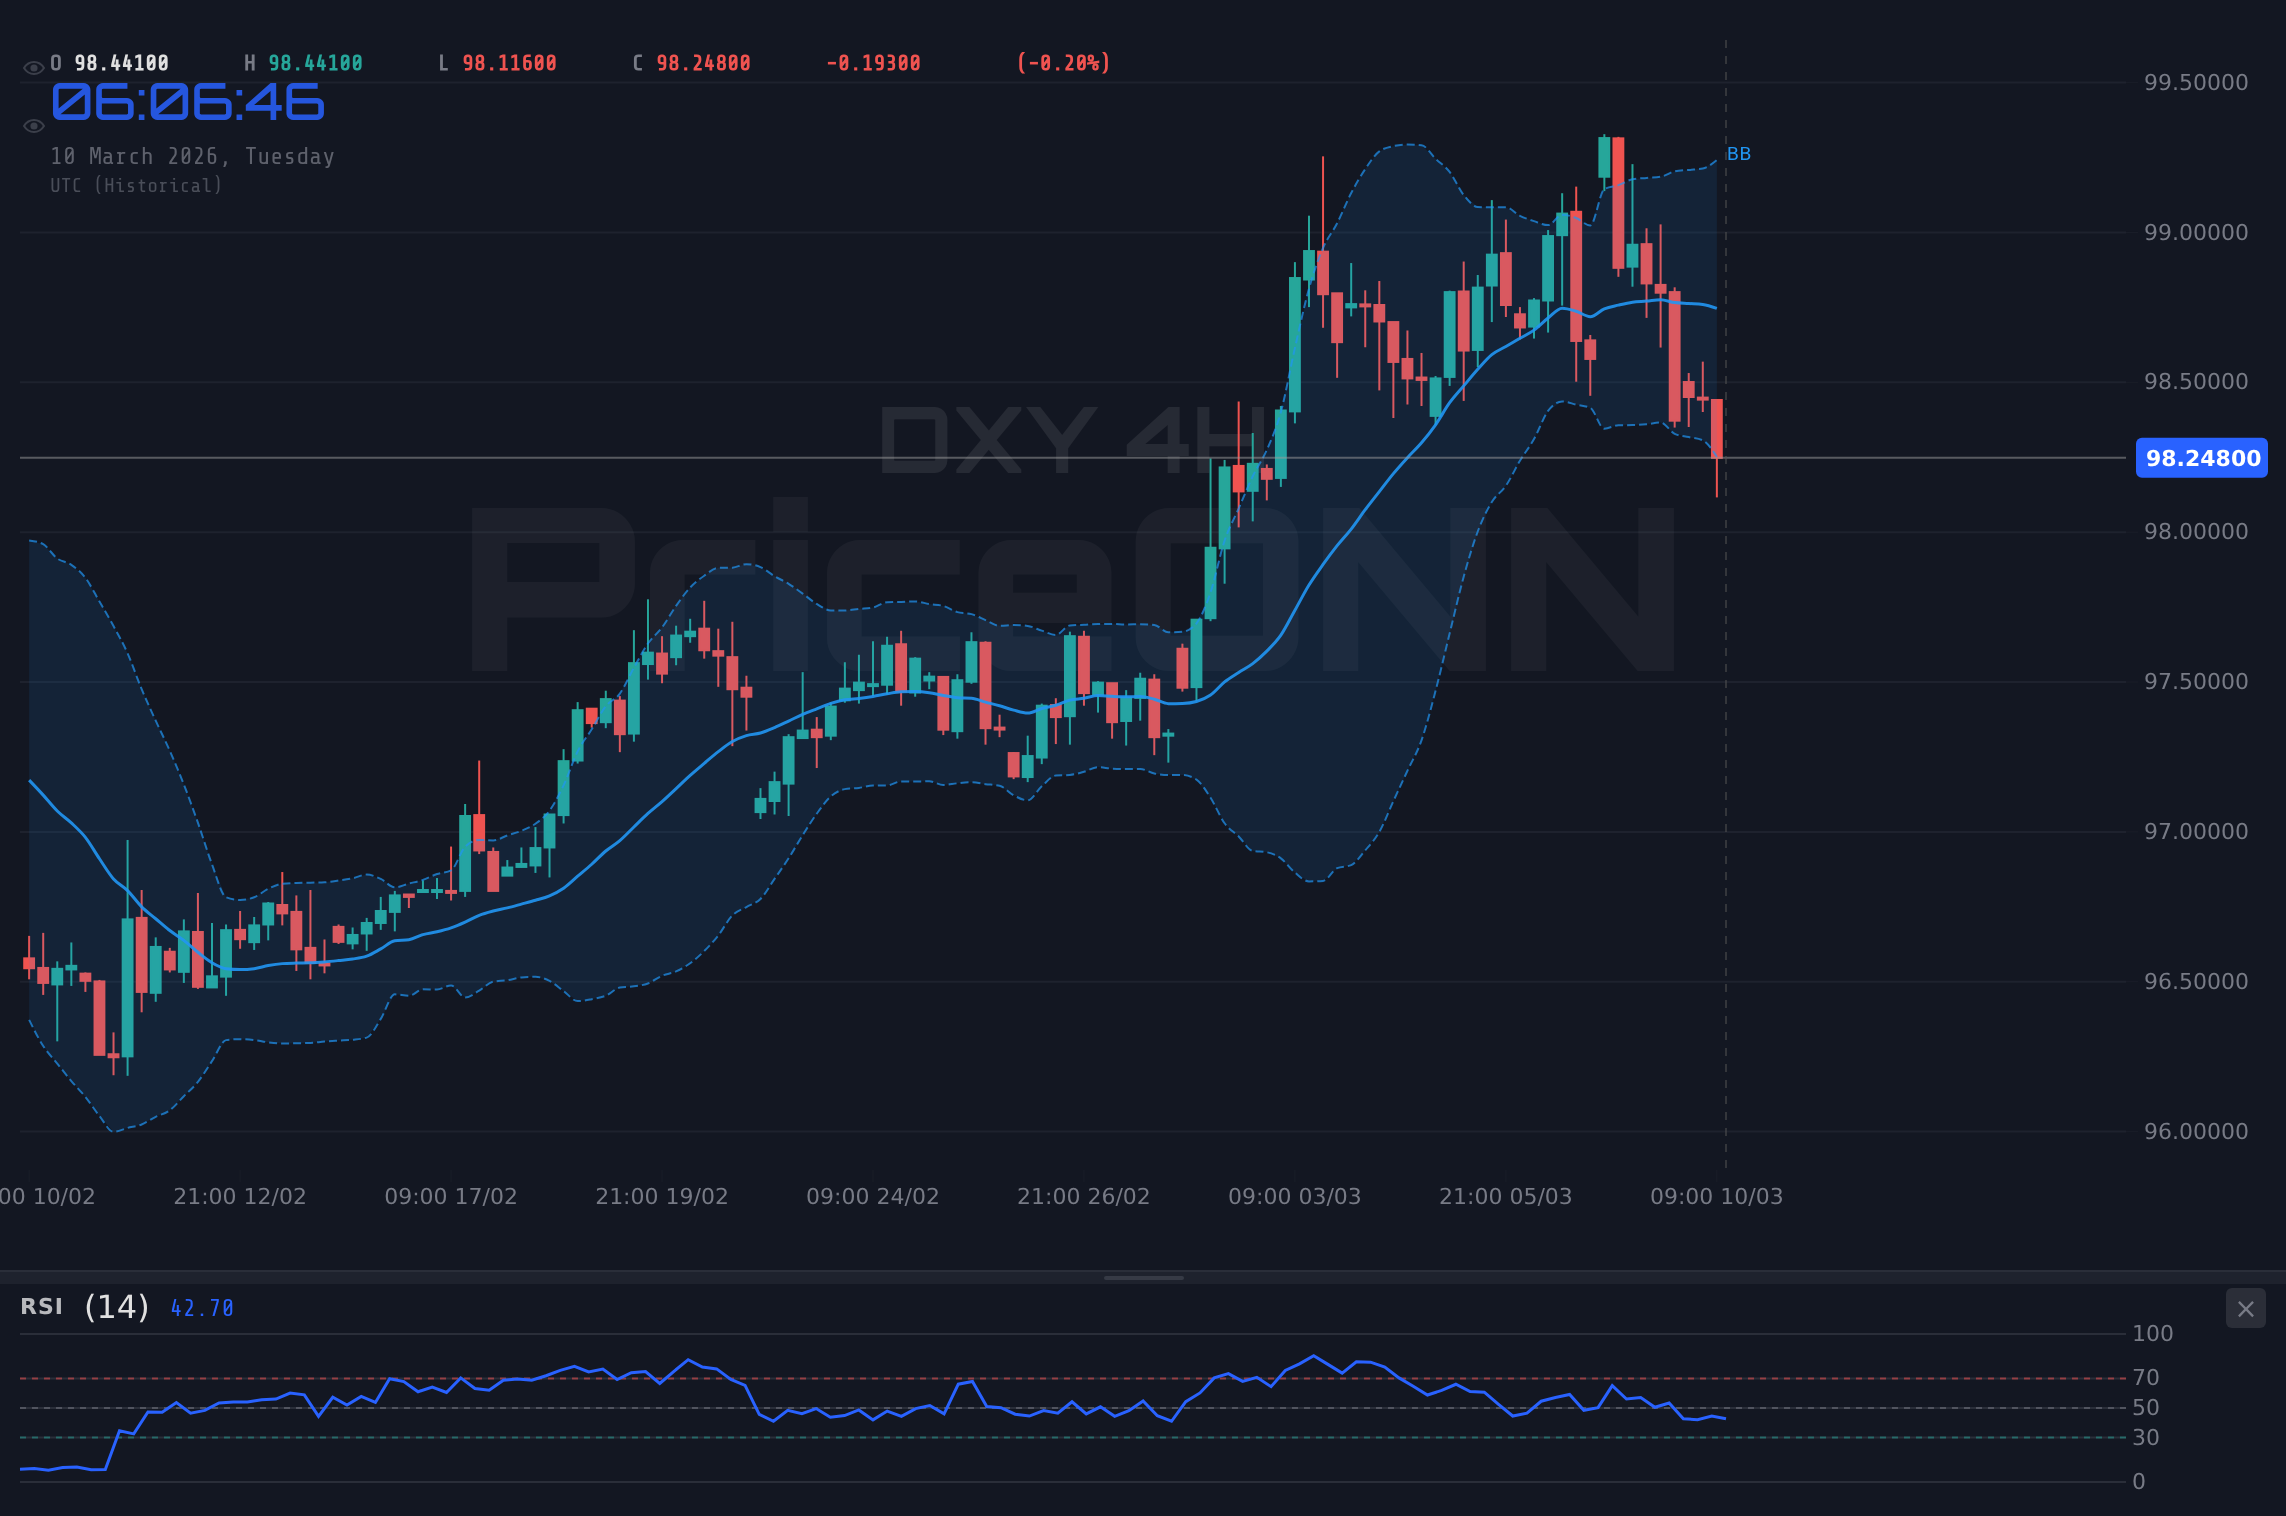
On the technical front, the 1-hour chart shows DXY with a neutral trend. The RSI(14) is at 42.97, suggesting neither overbought nor oversold conditions. The MACD histogram is negative, indicating downward momentum, while the Stochastic K=40.31, D=24.85 gives a buy signal. The ADX at 21.75 indicates a moderately strong downtrend. This is a conflicting set of signals. On the 4-hour chart, we see a neutral trend as well with an RSI(14) of 48.3. The MACD is negative here as well. The ADX here is 32.9, pointing to a strong upward trend. The daily chart is showing an RSI(14) reading of 61.02, still within the neutral region. The stochastic oscillator (K=62.37, D=69.71) is giving a sell signal. The 1-hour and 4-hour time frames are at odds, and the daily chart is showing a more bullish picture. This is exactly where you need to pay attention.
Key support levels to watch are $98.49, $98.46, and $98.42 on the hourly chart. Resistance levels are $98.56, $98.6, and $98.62. A decisive break above $98.62 could signal a continuation of the upward trend, while a break below $98.42 could lead to further declines. All those levels are to be considered by scalpers. Swing traders should be looking at the 4-hour chart, and the $98.36 level. A break below that level on the 4-hour chart can point to a bearish trend. Long-term investors should be looking at the daily chart, and the $98.04 support level. If that support level is broken, it would mean that the dollar's strength is fading, and the outlook for the currency is turning bearish.
Looking at cross-market correlations, a rising DXY generally puts pressure on gold and major currency pairs. EURUSD, currently at 1.16238, is showing a bearish trend on the daily chart. USDJPY, trading at 157.6, is also exhibiting a downward bias. GBPUSD, at 1.34406, is showing an upward trend on the 1-hour chart but a downward trend on the daily chart. AUDUSD, at 0.70781, has a bullish trend on the daily chart. NZDUSD, at 0.59167, is showing a bearish trend on the daily chart. The SP500 is showing a bearish trend on the daily chart, currently trading at 6785.3. The Nasdaq100 is showing a bullish trend on the 1-hour chart but a bearish trend on the daily chart, currently trading at 24937.96. DowJones30 is showing a bearish trend on the daily chart, trading at 47655. The key here is to watch out for the support and resistance levels on each chart. If the support levels are broken, it would indicate a bearish trend, and if the resistance levels are broken, it would indicate a bullish trend.
The economic calendar is also packed with events this week. On Monday, March 9, there was a JPY event. On Tuesday, March 10, there was a USD event. On Wednesday, March 11, there are EUR and USD events. On Friday, March 13, there are GBP and USD events. The US CPI data on Wednesday is the most important event to watch. This data will provide insights into the state of inflation in the US and will likely influence the Fed's monetary policy decisions. If the CPI data comes in higher than expected, it could lead to a more hawkish stance from the Fed, which would be positive for the dollar. However, if the CPI data comes in lower than expected, it could lead to a more dovish stance from the Fed, which would be negative for the dollar. Manage your risk, wait for your setup-the market always gives a second chance.
Geopolitical tensions in the Middle East are also playing a role in the market. According to Reuters, the conflict in the Middle East is disrupting shipping lanes and adding to supply chain bottlenecks. This, in turn, is fueling inflationary pressures and creating uncertainty in the global economy. The combination of geopolitical tensions and inflation concerns is creating a complex environment for traders. It is important to stay informed and manage risk carefully.
What does this mean for traders? Scalpers should be watching the hourly chart and key support/resistance levels for quick trades. Swing traders should focus on the 4-hour chart for medium-term trends. Long-term investors should analyze the daily chart and consider the broader economic outlook. It is important to remember that the market can change quickly, so it is essential to stay flexible and adapt to new information. While the technical picture remains mixed, attractive levels are forming for long-term investors.
Amid the current DXY strength, the upcoming US CPI data is a critical catalyst. Having tracked DXY through the 2024 rate cycle, the market's reaction to this data will be pivotal. Historically, when RSI reaches this zone on DXY, the outcome has been a period of consolidation followed by a directional break. This pattern last appeared in March 2025, when price subsequently broke to the upside following a higher-than-expected inflation print. Patient investors always find opportunities-the key is waiting for the right moment.
If DXY breaks above the resistance level of $98.62, it could signal a continuation of the upward trend. Targets could be $98.72 and beyond. This scenario is more likely if the US CPI data comes in higher than expected.
If DXY breaks below the support level of $98.42, it could lead to further declines. Targets could be $98.36 and $98.26. This scenario is more likely if the US CPI data comes in lower than expected.
The upcoming US CPI data release on Wednesday could trigger significant volatility in the market. Manage your risk carefully and consider using stop-loss orders.
Frequently Asked Questions: DXY Analysis
What happens if DXY breaks above $98.62 resistance?
A break above $98.62 resistance could trigger a continuation of the upward trend, potentially targeting $98.72 and beyond. This scenario is more probable if the US CPI data shows higher-than-expected inflation.
Should I buy DXY at current levels of $98.54 given the mixed signals?
Given the conflicting signals, it's prudent to wait for confirmation. A decisive break above $98.62 with strong volume could be a buy signal. However, be prepared to manage risk if price reverses.
Is RSI at 61.02 a sell signal for DXY right now?
While RSI at 61.02 is not yet in overbought territory, it suggests bullish momentum is slowing. It's not a definitive sell signal, but warrants caution, especially if combined with bearish divergence on the MACD.
How will the US CPI data on Wednesday affect DXY this week?
The US CPI data is a major catalyst. Higher-than-expected inflation could lead to a more hawkish Fed, boosting the dollar. Conversely, lower-than-expected inflation could weaken the dollar as it reduces pressure on the Fed to raise rates.
Track markets in real-time
AI-powered analysis, technical indicators and real-time price data.
Join Our Telegram Channel
Breaking market news, AI analysis and trading signals instantly.
Join Channel