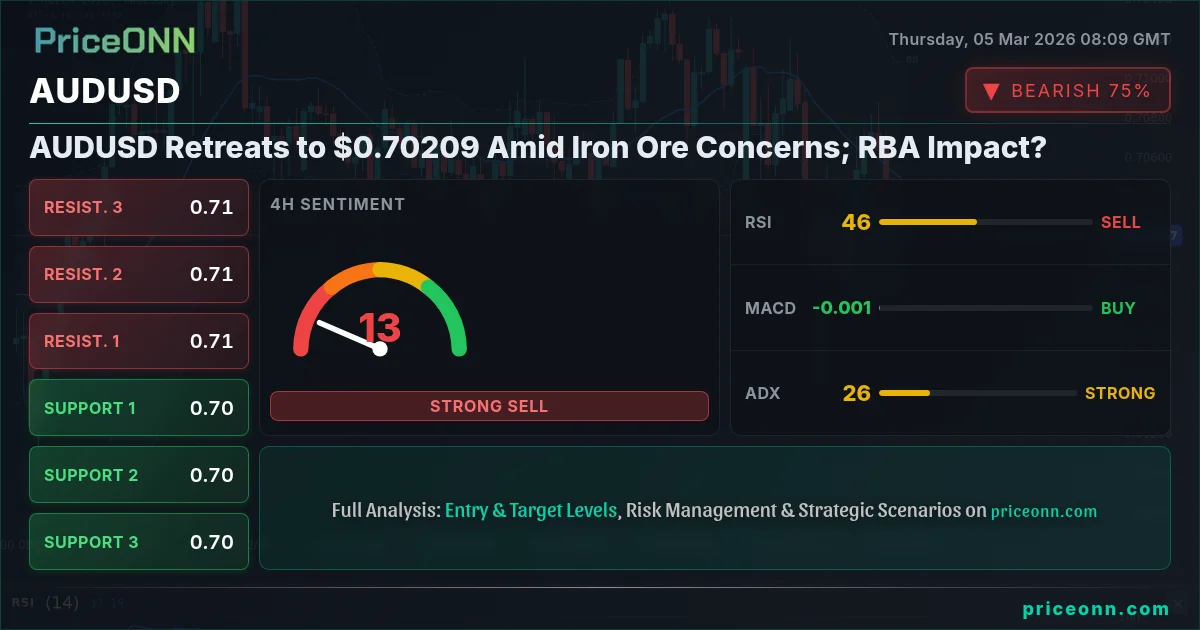
The Australian dollar is under pressure, with AUDUSD currently trading near $0.70209, a level that will be closely watched by traders. The key question is whether this pullback represents a buying opportunity or the start of a deeper correction, especially given concerns surrounding iron ore prices and China's growth outlook. Today's market narrative is a complex interplay of commodity prices, RBA policy expectations, and global risk sentiment.
- AUDUSD currently at $0.70209, testing key support levels amid iron ore concerns.
- RSI at 41.95 on the 1H chart signals potential for further downside momentum.
- Key support level at 0.70102 on the daily chart; a break below could trigger a sell-off.
- DXY strength at 98.83 is exerting downward pressure on AUDUSD, exacerbating commodity-related weakness.
Why AUDUSD's Struggle at $0.70209 Matters
The Aussie dollar's struggle near $0.70209 is more than just a technical level; it reflects deeper concerns about the Australian economy's reliance on commodity exports, particularly iron ore. China's recent growth target, while still robust, has tempered expectations, and fluctuating iron ore prices are adding to the uncertainty. This is happening while the DXY sits at 98.83, creating a double headwind for the pair. The 1H chart shows the pair in a neutral trend. The ADX at 15.34 confirms this, showing a weak trend, however, the RSI at 41.95 suggests that the pair has room to move lower. The pair's inability to sustain rallies above the 0.7100 level has further fueled bearish sentiment, reinforcing the importance of this current price zone.
Iron Ore Prices and the RBA Rate Decision Impact on AUD
The RBA's monetary policy decisions play a pivotal role in shaping the Australian dollar's trajectory. The market is keenly awaiting signals about the central bank's stance on inflation and future rate adjustments. Considering the recent economic data and global uncertainties, the RBA's approach will be crucial in determining whether the Aussie can regain its footing. According to recent news, China's slightly lowered growth target for 2026, coupled with fluctuating iron ore prices, creates a complex outlook for the Aussie.
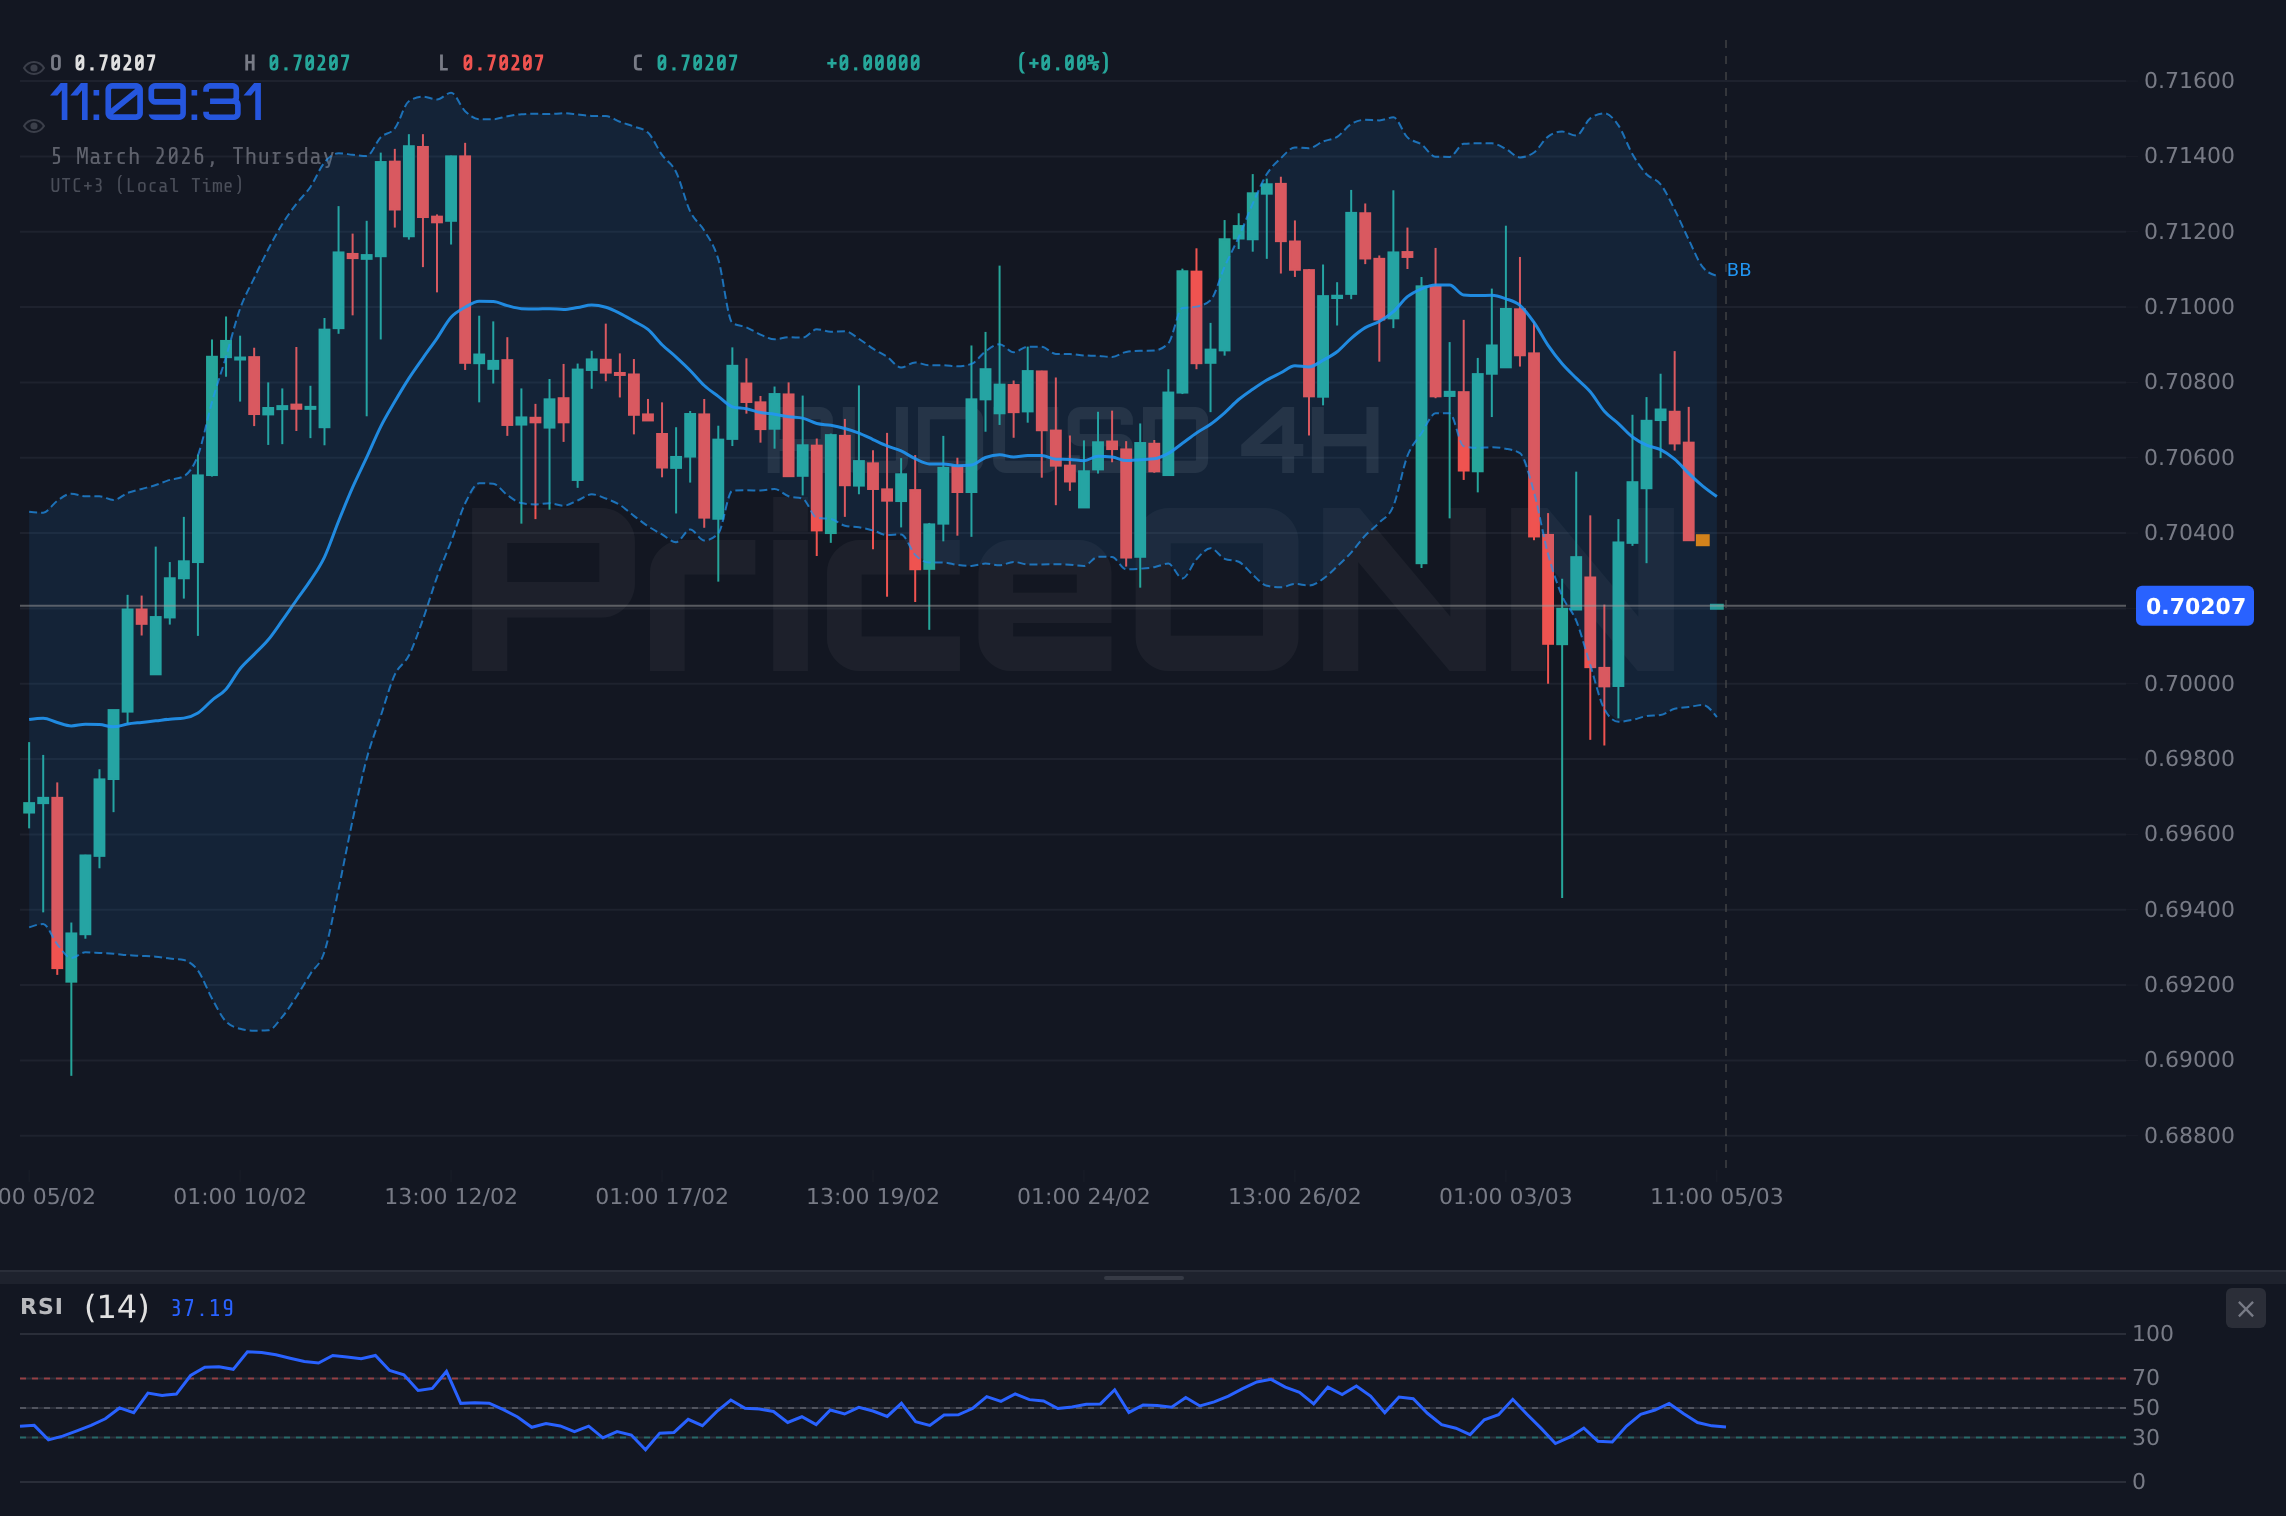
Looking at the daily chart, the MACD is showing negative momentum, a sign that the pair could be headed lower. The Stochastic reading of K=51.54 and D=66.36 further confirms this downward pressure. The key for bullish traders will be a break above the 0.71089 resistance level, whereas bearish traders will be looking for a break of the 0.70102 support level.
Multi-Timeframe Analysis: AUDUSD Key Levels
A multi-timeframe analysis provides a more comprehensive view of AUDUSD's technical landscape. On the 1-hour chart, immediate support can be found at 0.70183, with resistance at 0.70548. The 4-hour chart highlights support at 0.70449 and resistance at 0.70808. Zooming out to the daily chart, key support lies at 0.70102, while resistance is observed at 0.71089. As the dollar index strengthens by 0.32%, putting pressure on AUDUSD, understanding these levels is crucial for traders navigating the pair's near-term movements. With the SP500 down -0.44%, risk appetite is declining, which further supports the dollar.
Assessing Market Sentiment and Volatility Analysis
Market sentiment towards the Australian dollar is currently tilted towards caution. Heightened volatility, reflected in the daily range of 0.702 - 0.70883, suggests traders should be prepared for potential whipsaws. The ADX on the 1D timeframe is at 32.8, signalling a strong downward trend. This, coupled with the RSI at 50.11, indicates a potential for further downside movement. It's important to note that the 4H time frame shows a Stochastic reading of K=76.12 and D=66.48, indicating that the pair may be due for a pullback. While the overall trend may be down, this could present a short-term buying opportunity.
Bearish Pressures: DXY Strength and Commodity Weakness
The strength of the US dollar, as indicated by the DXY at 98.83, is exerting considerable downward pressure on AUDUSD. This is compounded by weakness in commodity prices, particularly iron ore, which is a crucial export for Australia. Furthermore, the overall market sentiment is leaning towards risk aversion, with the SP500 down -0.44%, further bolstering the dollar's appeal as a safe-haven asset. The combination of these factors creates a challenging environment for the Aussie, increasing the likelihood of a continued decline.
Upcoming US economic data releases could trigger significant volatility in AUDUSD. Traders should exercise caution and manage their risk accordingly.
AUDUSD Trade Plan: Navigating the Downtrend
Given the current technical and fundamental backdrop, a cautious approach to AUDUSD is warranted. The market is currently in a downtrend, the key will be to identify a good entry point to short the pair. Below is a potential trade plan.
Enter short if price breaks below 0.70102. Target 1 is 0.69475, and target 2 is 0.69115. This scenario hinges on continued DXY strength and persistent weakness in commodity prices.
A bullish reversal is less probable, but if price breaks above 0.71089, look for a move towards 0.71449, then 0.72076. This would require a significant shift in risk sentiment and a weakening of the US dollar.
The Bearish Momentum: A Deeper Dive
The bearish momentum in AUDUSD is supported by several technical indicators. The daily RSI at 50.11 indicates that there is still room for the pair to move lower before reaching oversold conditions. The MACD histogram is also showing negative momentum, which suggests that the selling pressure is likely to persist. Additionally, the Stochastic oscillator is nearing oversold territory, but has not reached it yet. This means that while a short-term bounce is possible, the overall trend remains bearish.
The Impact of US Economic Data on AUDUSD
US economic data releases have a significant impact on AUDUSD. Strong US data tends to support the US dollar, putting downward pressure on AUDUSD. Conversely, weak US data tends to weaken the US dollar, providing support for AUDUSD. On Wednesday, there was a slew of data released. Traders should be aware of the economic calendar and be prepared for potential volatility around these releases. The market is keenly awaiting signals about the central bank's stance on inflation and future rate adjustments.
AUDUSD and Intermarket Dynamics
The AUDUSD pair is closely tied to other markets, including commodities, equities, and bonds. As mentioned earlier, weakness in commodity prices tends to weigh on AUDUSD, as Australia is a major exporter of commodities. Additionally, risk aversion in equity markets also tends to support the US dollar, putting downward pressure on AUDUSD. Finally, movements in bond yields can also impact AUDUSD, as higher US yields tend to attract capital flows into the US, strengthening the US dollar.
RBA Rate Decision Impact on AUD
The RBA rate decision will have a significant impact on the direction of the AUDUSD pair. If the RBA decides to raise interest rates, this would likely provide support for the Australian dollar. Conversely, if the RBA decides to hold interest rates steady or even lower them, this would likely put downward pressure on the Australian dollar. The market is currently expecting the RBA to hold interest rates steady at its next meeting. This is because inflation in Australia is still relatively high, but the economy is also showing signs of slowing down. As a result, the RBA is likely to take a wait-and-see approach.
Frequently Asked Questions: AUDUSD Analysis
Is AUDUSD a good buy right now?
Given the current downtrend, AUDUSD is risky to buy. Look for a confirmed reversal pattern or a break above 0.71089 before considering long positions. The current price near $0.70209 suggests further downside.
What is the AUDUSD price forecast for this week?
The AUDUSD price forecast for this week is bearish. Expect a test of the 0.70102 support level. A break below could lead to further declines towards 0.69475. Upside potential is limited.
What are the key support and resistance levels for AUDUSD?
Key support for AUDUSD lies at 0.70102, 0.69475, and 0.69115. Resistance is at 0.71089, 0.71449, and 0.72076. These levels are derived from the daily chart and should be closely watched.
Why is AUDUSD moving today?
AUDUSD is moving lower today due to a combination of factors: DXY strength, weakness in commodity prices, and risk aversion in equity markets. The DXY strength is putting downward pressure on the pair.
Technical Outlook Summary
| Indicator | Value | Signal |
|---|---|---|
| RSI (14) | 41.95 | Bearish |
| MACD Histogram | Negative | Bearish |
| Stochastic | 14.08 | Bearish |
| ADX | 15.34 | Weak Trend |
| Bollinger | Middle Band | Bearish |
Key Levels
Support Levels
Resistance Levels
Track markets in real-time
AI-powered analysis, technical indicators and real-time price data.
Join Our Telegram Channel
Breaking market news, AI analysis and trading signals instantly.
Join Channel