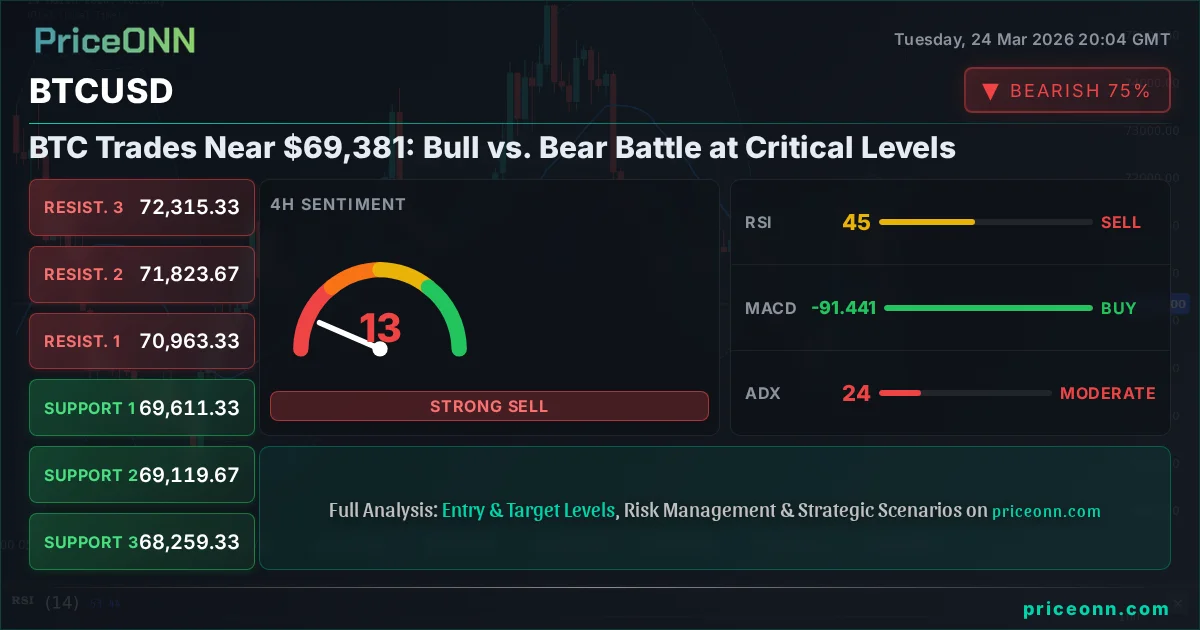
BTC Trades Near $69,381: Bull vs. Bear Battle at Critical Levels
Bitcoin hovers around $69,381 as bulls and bears clash. Technical indicators show mixed signals, with ADX at 24.11 suggesting a moderate trend. A clear break above key resistance is needed for upside.
Bitcoin today analysis reveals a tense standoff around the $69,381 mark, where bulls and bears are locked in a fierce debate. After a significant run-up, the cryptocurrency is consolidating, presenting a classic market scenario: is this a pause before further ascent, or a prelude to a sharper pullback? The current technical indicators paint a nuanced picture, with the Average Directional Index (ADX) at 24.11 suggesting a moderate trend, leaving room for interpretation. This price action demands a closer look at what needs to happen for either side to gain a decisive advantage.
- RSI at 38.95 on the 1H chart signals bearish momentum is building, while the 1D RSI at 47.42 suggests room for further downside.
- Critical support for BTCUSD sits at $68,263, a level tested multiple times and holding for now, but a break below could trigger a cascade.
- The MACD histogram on the 1H chart shows negative momentum, indicating selling pressure is currently dominant on shorter timeframes.
- The strong upward trend in DXY (99.19) continues to exert pressure on risk assets like Bitcoin, reflecting a risk-off sentiment in broader markets.
The Bull Case: Is $69,381 a Launchpad?
For the bulls, the current price action around $69,381 isn't a sign of weakness, but rather a necessary period of consolidation after a strong upward move. They point to the fact that Bitcoin has held above the crucial 1-hour support level of $69,156.67, indicating resilience. The 1-hour chart, in particular, shows a 'BUY' signal (6 Al, 2 Sat), which bulls interpret as short-term buying interest emerging. They might argue that the Stochastic indicator on the 1-hour chart, while showing a 'fall' signal (%K < %D), is coming from an oversold territory, hinting at a potential reversal. Furthermore, the MACD on the 1-hour chart, despite showing positive momentum, is still above the signal line, suggesting that upward pressure could reassert itself. The longer-term daily chart, while showing a neutral trend with 50% strength, has support levels at $68,263 and $65,673, which are seen as significant buying opportunities if tested. Bulls believe that the market is simply digesting recent gains, and any dip towards these support levels presents a risk/reward scenario favoring accumulation. They look for a decisive daily close above the immediate resistance of $70,304.67 to confirm their thesis and ignite a new leg higher towards the $72,628 daily resistance level.
The persistent strength in Bitcoin's price, even amidst broader market jitters, is often attributed to its unique market dynamics and the ongoing adoption narrative. While correlation with traditional risk assets like the SP500 (currently at 6558.95, showing a 1D bearish trend) and Nasdaq (24011.21, also bearish on 1D) can be observed, crypto often charts its own course, driven by specific catalysts like ETF inflows or halving cycles. Bulls might highlight that even with the DXY index at 99.19 showing a 1D bullish trend, Bitcoin has managed to maintain its value, suggesting a decoupling or a different set of driving forces. They see the current consolidation as a healthy step, allowing the Relative Strength Index (RSI) on the 1-hour chart, currently at 38.95, to reset from overbought conditions and prepare for another push higher. The argument is that the underlying demand, fueled by institutional interest and retail enthusiasm, remains robust, and any price dips are temporary before the next upward wave.
The Bear Case: Cracks Appearing in the Rally
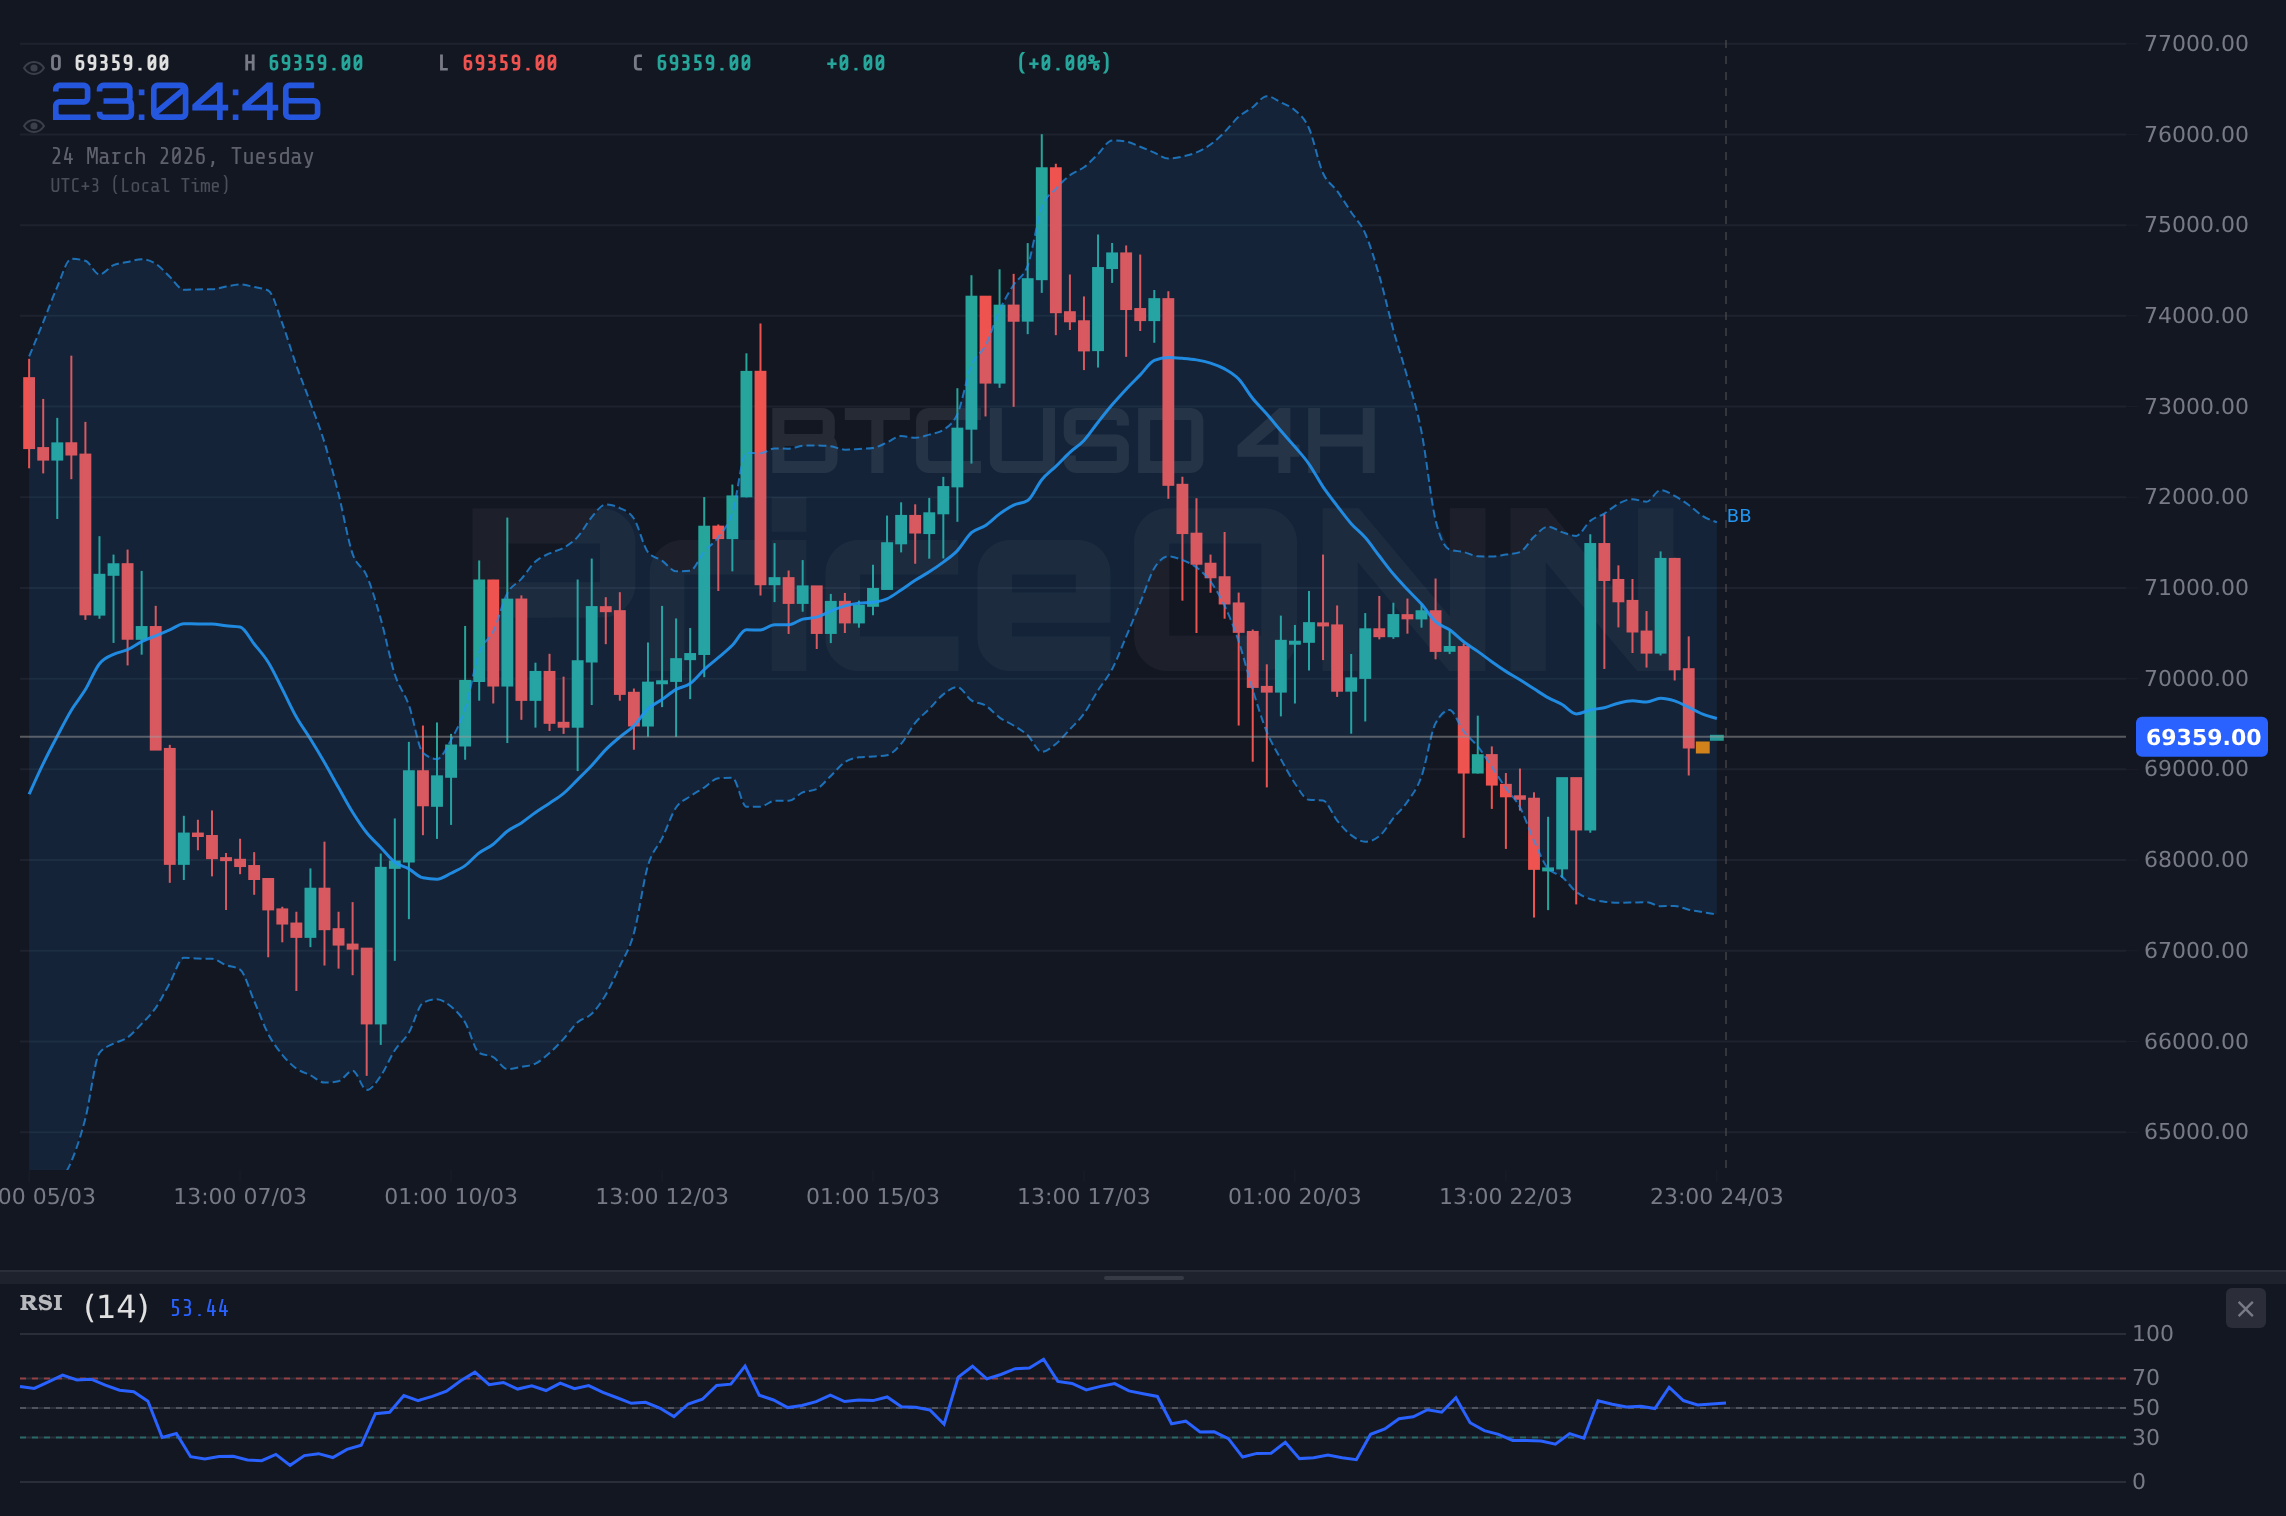
On the other side of the coin, the bears see the current price action around $69,381 as a warning sign. They point to the predominantly bearish signals across multiple timeframes. The 4-hour chart, a crucial timeframe for swing traders, shows a 'SELL' signal (2 Al, 6 Sat) with a strong 87% downward trend strength. The ADX at 24.11 on the 1-hour chart and 24.11 on the 4-hour chart, while moderate, does not negate the bearish conviction. Bears are particularly concerned by the daily chart's technical indicators. The RSI(14) at 47.42 suggests room for further decline, and the MACD is firmly in negative momentum territory, below its signal line. The Stochastic on the daily chart, with K=23.31 and D=27.23, is in oversold territory but shows a bearish crossover (%K < %D), indicating that downward momentum might continue before any significant bounce. The current price is also trading below the middle Bollinger Band on the 4-hour chart, a bearish sign.
Furthermore, the bears emphasize the broader market context. The DXY is showing a strong 1D bullish trend at 99.19, which typically puts downward pressure on risk assets like Bitcoin. The decline in major stock indices like the SP500 (6558.95, 1D bearish trend) and Nasdaq (24011.21, 1D bearish trend) further supports a risk-off environment where investors might flee to safer assets, pulling capital away from cryptocurrencies. They see the consolidation not as a healthy pause, but as a distribution phase where larger holders are exiting their positions. The fact that Bitcoin experienced a significant daily drop of -2.08% (-1472) to reach current levels around $69,381 is also concerning. Bears are watching the 1D support at $68,263 very closely. A confirmed break below this level, especially with strong volume, could open the floodgates for a much deeper correction, potentially towards the $65,673 support level. They believe the market is overdue for a more significant pullback after a prolonged period of gains.
The Technical Showdown: Indicators in Conflict
The technical indicators present a fascinating conflict, highlighting why the current price action around $69,381 is so pivotal. On the 1-hour chart, there's a confluence of 'BUY' signals (6 Al, 2 Sat), suggesting short-term traders might be anticipating a bounce. The MACD is positive, and the RSI is trending upwards, albeit from neutral levels. However, this optimistic short-term view is immediately challenged by the 4-hour timeframe. Here, the overall signal flips to 'SELL' (2 Al, 6 Sat), with a strong ADX of 24.11 indicating a moderate trend is in play, and the RSI is trending downwards from neutral territory (46.14). The Stochastic shows a bearish crossover (%K < %D).
The daily chart adds another layer of complexity. While the overall trend is neutral (50% strength), the RSI at 47.42 is below 50, and the MACD is showing negative momentum. The Stochastic is oversold, but the bearish crossover suggests selling pressure might persist. The ADX on the daily chart at 18.75 indicates a weak trend, meaning the market lacks strong conviction in either direction on this longer timeframe. This mixed bag of signals is precisely why the $69,381 level is so critical. Bulls need to see a sustained move above the immediate 1H resistance of $70,304.67, ideally confirmed by a daily close above it, to invalidate the bearish leanings on the higher timeframes. Bears, conversely, are looking for a decisive break below the 1H support at $69,156.67, followed by a close below the more significant 1D support at $68,263, to confirm their downside thesis.
The conflict between the short-term 'BUY' signals and the medium-to-long-term 'SELL' signals creates a 'WATCH_ZONE' scenario. The ADX reading of 24.11 on the 1-hour chart is particularly telling; it suggests that while there's some directional movement, it's not yet a strong, committed trend. This means the market is susceptible to sharp reversals or volatile consolidations. For instance, the Stochastic indicators are flashing conflicting signals across timeframes: bullish on 1H and 4H, bearish on 1D. This divergence means that traders cannot rely on a single indicator for a clear direction. Confirmation is key. Bulls need to see the price decisively break through resistance levels, perhaps with increasing volume, to overcome the bearish undertones. Bears need to see support levels crumble, signaling capitulation and a potential rush for the exits.
The Bull vs. Bear Verdict: A Waiting Game
Given the conflicting signals and the current 'WATCH_ZONE' classification (Score: 2/8), the most prudent approach for traders is to wait for a clearer setup. The market is currently at an inflection point around $69,381, and forcing a trade here carries significant risk. The bulls' case relies on holding the immediate 1-hour support at $69,156.67 and then pushing decisively above the 1-hour resistance at $70,304.67. A daily close above this level would be a strong bullish confirmation, potentially opening the door for a move towards the daily resistance at $72,628. This scenario would likely be supported by a shift in broader market sentiment, a weakening DXY, or positive news specific to the crypto market, such as increased ETF inflows or favorable regulatory developments.
Conversely, the bears' scenario gains traction on a break below the 1-hour support at $69,156.67. The real confirmation, however, would be a sustained close below the daily support level of $68,263. Such a move would signal the invalidation of the recent upward momentum and could trigger a sell-off towards the next significant support at $65,673. This bearish outcome would likely be exacerbated by continued strength in the US Dollar, falling equity markets, or negative geopolitical events that dampen overall risk appetite. Until one of these levels is decisively breached and confirmed on a higher timeframe, the market is likely to remain in a state of flux, characterized by choppy price action and a lack of clear direction.
The current ADX value of 24.11 on the 1-hour chart is a critical piece of evidence. It suggests that the trend, whichever way it ultimately breaks, is not yet strongly established. This means that any move higher or lower could be met with significant counter-trend trading. For instance, a breakout above $70,304.67 could still face selling pressure as it approaches higher resistance levels, and a drop below $68,263 might not immediately lead to a freefall if buyers step in at subsequent support levels. Therefore, patience is paramount. Traders should be looking for confirmation – a clear break of a key level on a daily chart, accompanied by a shift in momentum indicators and ideally, a favorable macroeconomic backdrop – before committing significant capital. The market is offering a clear 'watch zone' rather than a high-conviction trade setup at this moment.
The Path Forward: What Needs to Happen for a Clear Signal
For the bulls to regain full control and push Bitcoin towards new all-time highs, several conditions need to be met. Firstly, the immediate resistance at $70,304.67 must be decisively broken on a daily closing basis. This would not only represent a technical breakout but also signal a shift in sentiment from consolidation to renewed buying pressure. Secondly, the broader market environment needs to align. A sustained weakening of the US Dollar Index (DXY), currently at 99.19 with a strong 1D trend, would be a significant tailwind. Similarly, a stabilization or recovery in major equity indices like the SP500 (currently 6558.95, 1D bearish) and Nasdaq (24011.21, 1D bearish) would indicate a return of risk appetite, benefiting assets like Bitcoin. On the crypto-specific front, continued positive inflows into Bitcoin ETFs or significant developments in blockchain technology adoption could provide the necessary fundamental catalyst.
From a technical perspective, bulls would want to see the RSI move back above 50 on the daily chart, ideally climbing towards overbought levels (above 70) to confirm strong upward momentum. The MACD should ideally show a bullish crossover on the daily chart, with the histogram turning positive and moving away from the zero line. The ADX, currently at 18.75 on the daily chart, would need to rise above 25 to confirm a strengthening trend. Confirmation would also come from the Stochastic indicator showing a bullish crossover and moving out of oversold territory. The holding of the 1D support at $68,263 is paramount; any failure here would significantly dampen the bullish outlook and invalidate this path forward.
Conversely, for the bears to seize control, the key level to watch is the daily support at $68,263. A clear breach and sustained close below this level would be the primary trigger for a bearish scenario. This would likely be accompanied by a bearish divergence on the RSI, indicating weakening upward momentum, and a negative crossover on the daily MACD, confirming selling pressure. The DXY strengthening further, potentially breaking above 100.34 resistance, would add fuel to the bearish fire, as would a continued sell-off in global equities. On-chain data showing increased selling pressure from long-term holders or a significant drop in Bitcoin ETF inflows would further solidify the bearish thesis. The immediate 1H support at $69,156.67 would act as a precursor; a break here would signal increased selling pressure, making the $68,263 level a prime target for bears to test.
Bearish Scenario: Downside Acceleration
65% ProbabilityNeutral Scenario: Range-Bound Consolidation
25% ProbabilityBullish Scenario: Breakout to New Highs
10% ProbabilityFrequently Asked Questions: BTCUSD Analysis
What happens if BTCUSD breaks below the $68,263 support level?
A daily close below $68,263 would invalidate the current consolidation and likely trigger a sell-off. Bears would target the next significant support at $65,673, driven by increasing selling pressure and potentially a risk-off shift in broader markets.
Should I buy BTCUSD at current levels around $69,381 given the mixed signals?
Caution is advised. With the ADX at 24.11 and conflicting signals across timeframes, it's not a high-conviction setup. Waiting for a clear break above $70,304.67 resistance or a confirmed bounce from $68,263 support would offer a better risk/reward ratio.
Is the 1H RSI at 38.95 a sell signal for BTCUSD right now?
While the 1H RSI at 38.95 indicates bearish momentum on the shorter timeframe, it's not an automatic sell signal in isolation. The daily RSI at 47.42 also suggests further downside potential. Confirmation from price action breaking key support levels would be needed to validate a sell-off.
How will the strong DXY trend affect BTCUSD this week?
The DXY's 1D bullish trend at 99.19 generally exerts downward pressure on risk assets like Bitcoin. If the dollar continues to strengthen, it could exacerbate any bearish move in BTCUSD, making it harder for bulls to break through resistance levels.
Technical Outlook Summary
| Indicator | Value | Signal | Interpretation |
|---|---|---|---|
| RSI (14) | 38.95 | Bearish | Momentum fading on 1H, room for downside on 1D. |
| MACD Histogram | -ve | Bearish | Negative momentum on 1H suggests selling pressure. |
| Stochastic | K:23.31, D:27.23 | Bearish | Bearish crossover in oversold territory on 1D. |
| ADX | 24.11 | Moderate Trend | Indicates trend is not yet strongly committed. |
| Bollinger Bands | Price below Mid Band (4H) | Bearish | Suggests downward pressure on 4H chart. |
Volatility creates opportunity - those prepared will be rewarded. While the current technical picture for BTCUSD remains mixed, with conflicting signals across timeframes, the levels discussed provide a clear roadmap. Patient traders who wait for confirmation of a decisive break above resistance or a confirmed bounce from support, while diligently managing risk, will be best positioned to capitalize on the next significant market move.
Track markets in real-time
AI-powered analysis, technical indicators and real-time price data.
Join Our Telegram Channel
Breaking market news, AI analysis and trading signals instantly.
Join Channel