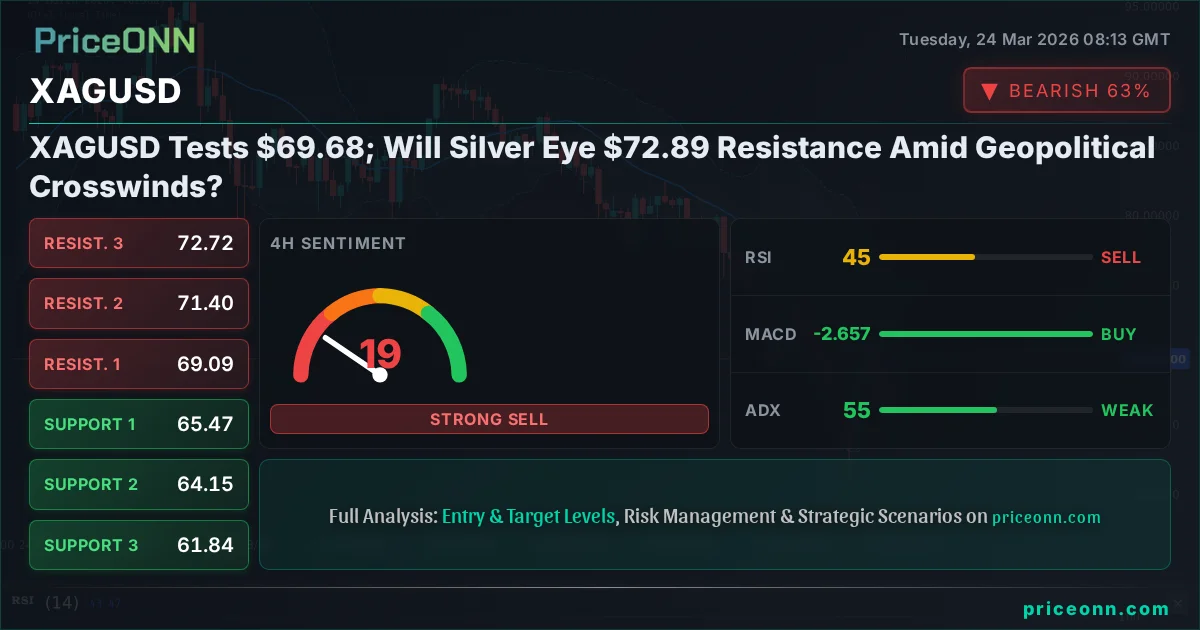
XAGUSD Tests $69.68; Will Silver Eye $72.89 Resistance Amid Geopolitical Crosswinds?
Silver hovers around $69.68 as geopolitical tensions and Fed policy expectations create a tug-of-war. Technicals show mixed signals across timeframes, demanding careful navigation.
The Battleground at $69.68: Silver's Next Move Hinges on Global Tensions
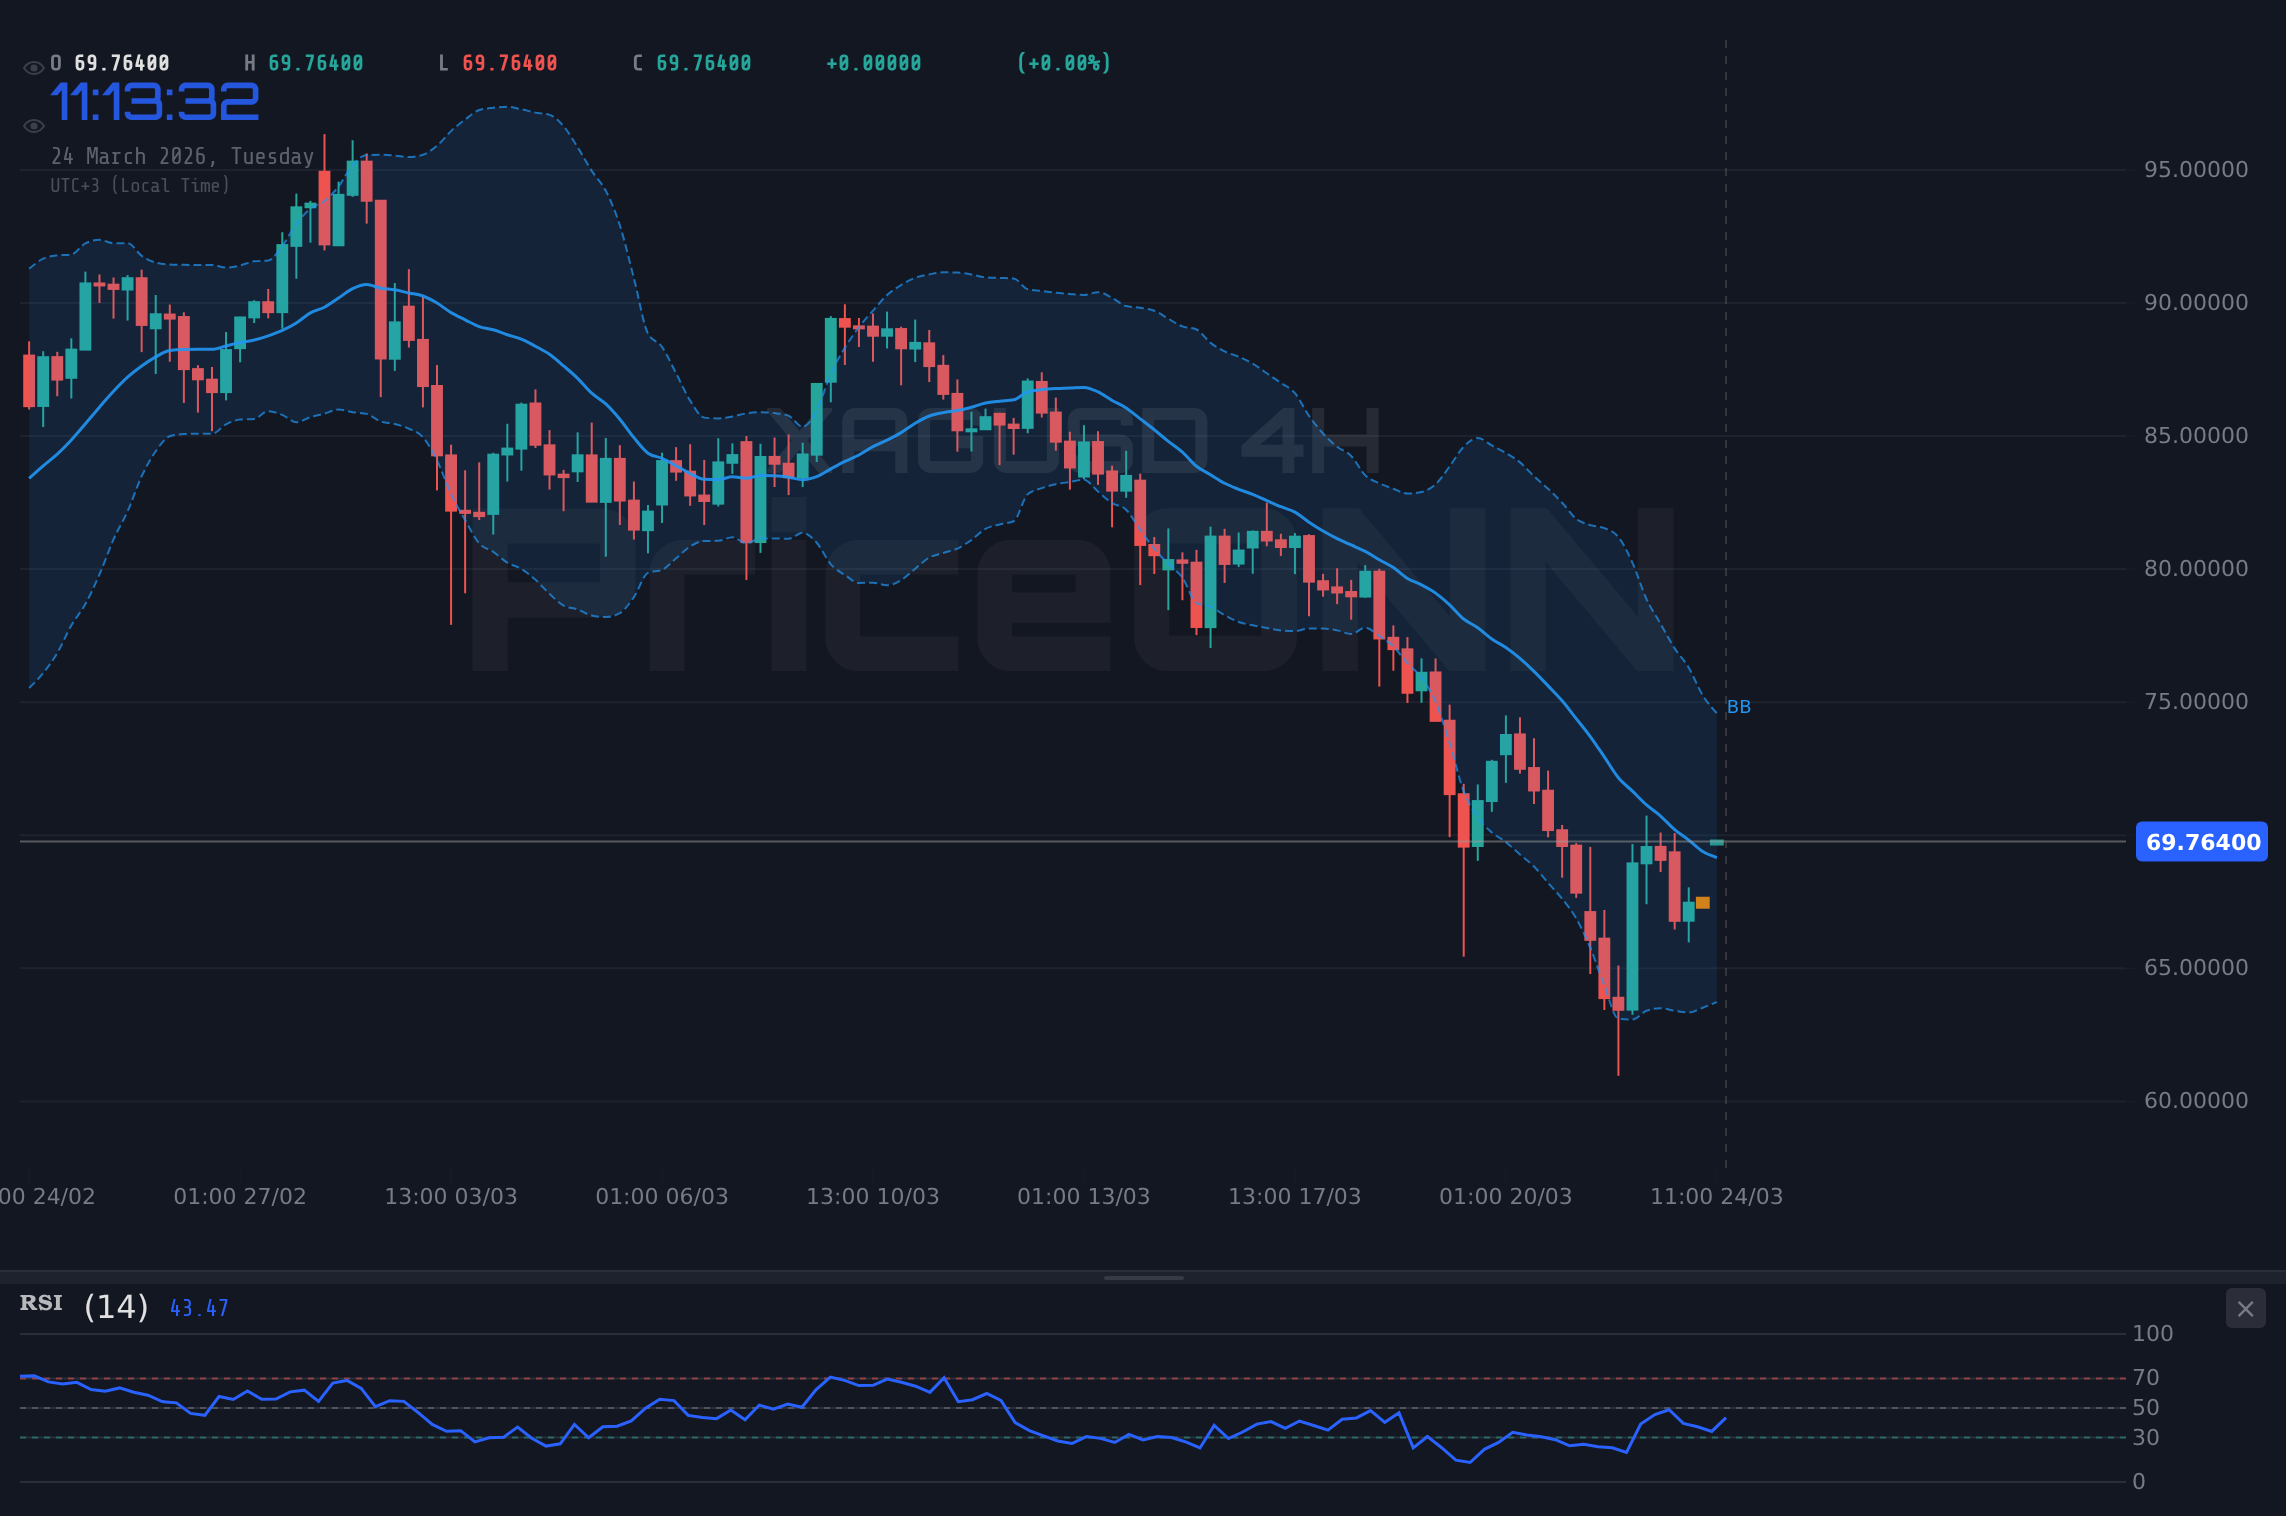
The price of silver, currently trading at $69.68, finds itself at a critical juncture. We're witnessing a fascinating tug-of-war between bullish forces seeking to push the precious metal higher and bearish pressures attempting to cap its gains. This tension is amplified by a complex global backdrop, where geopolitical uncertainties and shifting central bank expectations create a volatile environment. Understanding the interplay between these factors is crucial for any trader navigating the XAGUSD market today. The 1-hour chart shows a neutral trend with a slight bullish lean, but the 4-hour and daily timeframes present a more challenging picture, leaning towards a bearish trend. This divergence across timeframes is precisely what creates the current market indecision, making $69.68 a pivotal level to watch.
- RSI at 56.84 on the 1-hour chart signals upward momentum, but the daily RSI at 27.92 indicates deep oversold conditions, suggesting a potential reversal or continued decline.
- Critical support for XAGUSD sits at $67.90 (1H) and $65.47 (4H), levels tested this week that could dictate the next major price move.
- The ADX indicator shows a stark contrast: 18.14 on the 1H suggests a weak trend, while 60.67 on the 4H signals a very strong downtrend, highlighting conflicting market signals.
- DXY's current level near 98.98 is a key driver, with its upward momentum potentially pressuring silver prices lower, especially if it moves towards the 99.56 resistance.
The Bull Case: Why Silver Could Climb Above $70
The Investment Demand Argument
The persistent narrative around strong investment demand for silver continues to underpin its value. Despite short-term fluctuations, the long-term appeal of silver as a store of value and a hedge against inflation remains potent. In an environment where geopolitical risks are elevated, as seen with recent tensions in the Middle East, safe-haven assets typically attract capital. While gold often takes the spotlight, silver's dual role as both a precious metal and an industrial commodity gives it unique characteristics. If global economic uncertainty persists, we could see a renewed flight to tangible assets, benefiting XAGUSD. The 1-hour Stochastic indicator, with K at 66.24 and D at 30.6, is flashing a bullish signal, suggesting that momentum could be building for an upward move. Furthermore, the MACD on the 1H chart shows positive momentum, indicating that buyers are currently in control on this shorter timeframe. This aligns with the overall upward direction seen in the daily price change of +0.87%.
Industrial Demand and Supply Dynamics
Beyond its safe-haven appeal, silver's industrial applications are expanding, particularly in sectors like renewable energy and electronics. As the world transitions towards greener technologies, the demand for silver in solar panels and electric vehicles is expected to grow. This fundamental demand provides a solid floor for prices. While current data doesn't detail supply-side constraints, any disruption or shortfall could quickly push prices higher. The 1-hour chart's RSI at 56.84, while in neutral territory, shows an upward inclination, hinting that buyers are gradually gaining traction. If this momentum carries through, we could see silver challenge its immediate 1-hour resistance at $69.87. A decisive break above this level, supported by increasing volume, would be a strong signal for further upside potential, possibly targeting the $70.59 mark.
Technical Confluence on Shorter Timeframes
Looking at the 1-hour technicals, there's a case to be made for a short-term bullish outlook. The MACD is positive, and the Stochastic oscillator (%K > %D) is signaling an upward move. The price is trading above the middle Bollinger Band, indicating a bullish bias on this timeframe. The ADX at 18.14, however, suggests a weak trend, which means any upward move might lack strong conviction and could be prone to reversals. Nonetheless, the confluence of buy signals on the 1-hour chart, coupled with the overall positive daily change, presents an argument for bulls to push towards the $70.59 resistance. Traders focused on shorter timeframes might find this setup attractive, especially if they see confirmation from price action near the $69.87 level.
The Case for a Daily RSI Reversal Play
One of the most compelling arguments for a bullish turn comes from the daily RSI reading of 27.92. This level is deep within the oversold territory, historically a zone where significant price reversals can occur. While oversold conditions can persist, especially in strong downtrends, the sheer depth of this reading suggests that sellers may be exhausted. If XAGUSD can find a footing and begin to move higher, the RSI has considerable room to run before reaching overbought territory. This presents a classic contrarian opportunity: buying into weakness with the expectation of a mean reversion. The daily chart also shows the Stochastic oscillator with K at 19.61 and D at 13.13, also deeply oversold and showing a bullish crossover signal (%K > %D). This dual oversold indicator setup on the daily chart is a powerful signal that cannot be ignored by those looking for potential long-term buying opportunities, even if the short-to-medium term trend remains challenging.
The Bear Case: Why Silver Could Retreat from $69.68
Dominant Downtrend on Longer Timeframes
While the 1-hour chart might offer some solace to the bulls, the longer-term technical picture paints a decidedly bearish scenario for XAGUSD. The 4-hour chart shows a very strong downtrend, with an ADX reading of 60.67. This indicates that the market is strongly trending downwards, and any counter-trend moves are likely to be met with significant selling pressure. The RSI on the 4-hour chart is at 36.98, below the 50 level and trending downwards, reinforcing the bearish sentiment. MACD is also showing negative momentum, and the price is trading below the middle Bollinger Band, all pointing towards further downside. The 4-hour support levels at $67.90 and $65.47 become key areas to watch if the selling pressure intensifies. A break below $67.90 would confirm the bearish bias on this timeframe and could accelerate declines.
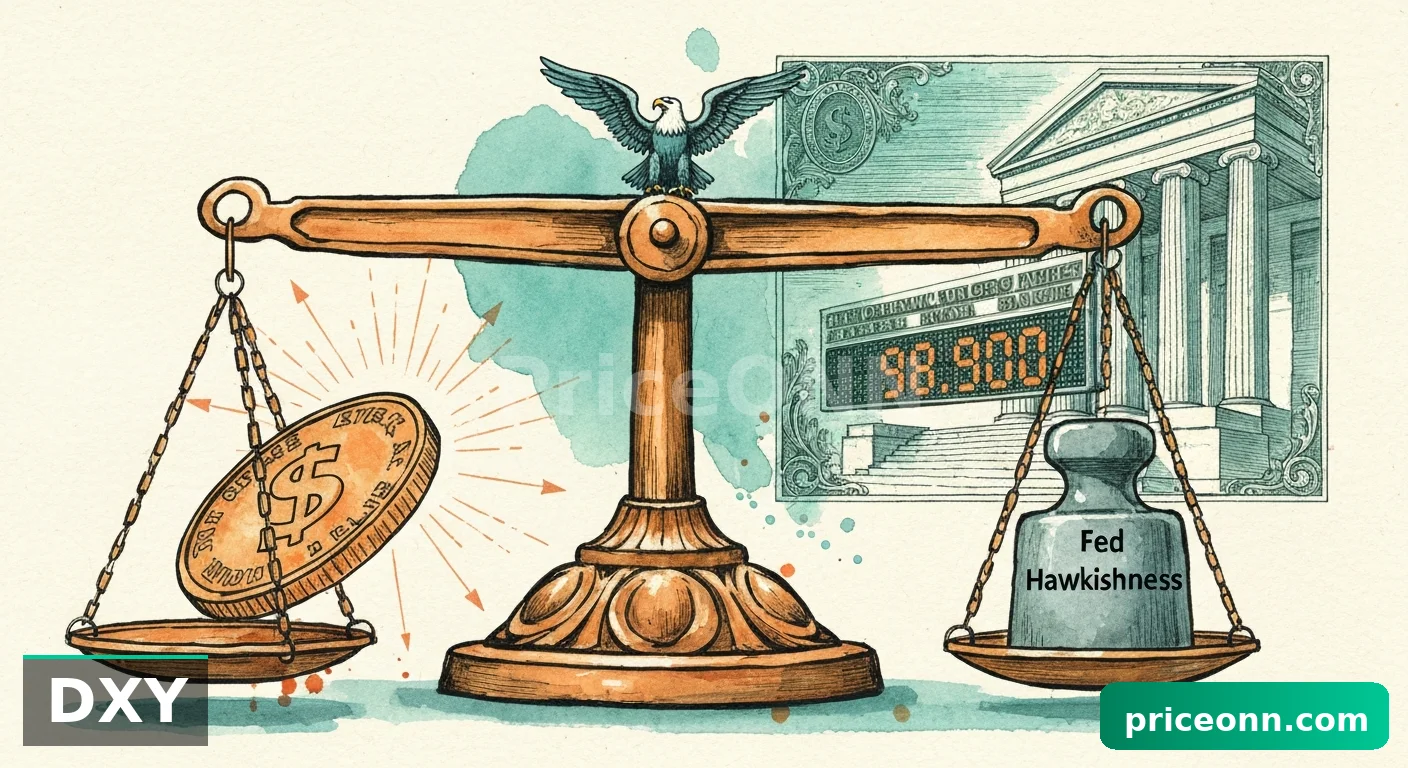
The Dollar's Strength and Fed Uncertainty
The US Dollar Index (DXY) is currently trading at 98.98 and showing a strong upward trend on the daily timeframe (ADX 32.74). A strengthening dollar typically exerts downward pressure on commodities priced in USD, such as silver. The DXY's current level is still below its key resistance at 99.56, but its upward trajectory suggests that dollar strength could be a significant headwind for XAGUSD in the near term. Adding to this complexity is the uncertainty surrounding Federal Reserve policy. While recent economic data might suggest a pause in rate hikes, geopolitical events could complicate the Fed's decision-making. If the Fed maintains a hawkish stance or signals further tightening due to inflation concerns (partly fueled by rising oil prices), it would likely support the dollar and weigh on silver. The recent news that San Francisco Fed President Mary Daly indicated uncertainty about the next monetary move due to geopolitical factors directly feeds into this narrative, suggesting the DXY could remain supported.
Geopolitical Factors Creating Crosscurrents
Recent geopolitical events, particularly those in the Middle East, have added layers of complexity. While such events often boost safe-haven demand for precious metals, the market's reaction can be nuanced. For instance, the report detailing an oil price plunge of 12% as Iran diplomacy surfaced suggests that immediate de-escalation fears can quickly override traditional safe-haven flows. Similarly, news about potential Iran truces influencing EUR/USD suggests that diplomatic developments can dramatically shift market sentiment. If these geopolitical tensions ease, even temporarily, the demand for silver as a safe haven might diminish, leading to price corrections. The market is sensitive to headlines, and any sign of de-escalation could trigger profit-taking in silver, pushing it back towards its support levels. The Forex market reactions, like AUD/JPY tumbling amid Tehran strikes, show how quickly sentiment can pivot based on geopolitical news.
Weak Trend Signals on Longer Timeframes
The ADX indicator is a crucial tool for assessing trend strength. On the 1-hour chart, the ADX at 18.14 suggests a weak trend, which could imply that the current price action is more range-bound or consolidating. However, when we look at the 4-hour chart, the ADX spikes to 60.67, indicating a very strong downtrend. This stark contrast is concerning for bulls. It suggests that the underlying momentum on the medium-term timeframe is strongly bearish, and the short-term bullish signals might be mere fluctuations within a larger downward move. Similarly, the daily ADX at 25.72 indicates a strong downtrend. This suggests that while there might be short-term bounces, the dominant force on longer timeframes is bearish. Traders who prioritize trend following would likely be wary of entering long positions until these longer-term indicators show signs of shifting.
The Verdict: Navigating the Crosscurrents
A Confluence of Conflicting Signals
The technical indicators present a mixed bag for XAGUSD. On the 1-hour chart, we see bullish signals from the Stochastic and MACD, with RSI showing upward momentum. This supports the idea of a potential move towards the $69.87 and $70.59 resistance levels. However, the longer-term charts tell a different story. The 4-hour ADX at 60.67 screams a strong downtrend, and the daily RSI at 27.92, while oversold, could still extend lower in a strong trend. The daily ADX also confirms a strong downtrend. This conflict is the essence of the current trading dilemma. The $69.68 price point is where these opposing forces are clashing.
The Role of Macro Factors
The broader macro environment, particularly the strength of the US Dollar (DXY at 98.98) and the Federal Reserve's policy outlook, will be critical. If the DXY continues its upward trend towards 99.56, it will likely cap any bullish aspirations for silver. Geopolitical developments also play a crucial role; any easing of tensions could reduce safe-haven demand for precious metals. Conversely, escalating conflicts could provide a floor for XAGUSD. The market is reacting to these crosscurrents, as evidenced by the volatile oil price movements and their potential inflationary impact, which then feeds back into Fed expectations.
Strategic Approach: Patience and Risk Management
Given the conflicting signals, a patient and risk-managed approach is paramount. The 4-hour chart's strong bearish trend (ADX 60.67) suggests that the path of least resistance is still downwards. However, the deeply oversold daily RSI (27.92) and Stochastic present a potential contrarian opportunity. A decisive break above the 1-hour resistance at $69.87, and more importantly, above the 4-hour resistance at $71.40, would be needed to signal a more robust bullish reversal. On the downside, a break below the 1-hour support at $67.90, followed by a break of the 4-hour support at $65.47, would confirm the bearish trend continuation. The current price of $69.68 sits precariously between these conflicting technical pictures and macro drivers.
The Trading Decision: Favoring Caution
While the short-term indicators offer a glimmer of hope for the bulls, the overwhelming strength of the downtrend on the 4-hour chart (ADX 60.67) and the concerning DXY momentum suggest that caution is the more prudent strategy. The oversold condition on the daily chart is significant, but it does not guarantee an immediate reversal, especially in a strong downtrend. Therefore, the primary bias leans towards the downside until stronger bullish confirmation emerges. A break above the key 4-hour resistance at $71.40 would be required to invalidate the bearish outlook and shift the focus higher. Until then, traders should be wary of chasing short-term rallies and prioritize risk management.
Technical Outlook Summary
| Indicator | Value | Signal | Interpretation |
|---|---|---|---|
| RSI (14) | 56.84 (1H) / 36.98 (4H) / 27.92 (1D) | Neutral (1H) / Bearish (4H) / Oversold (1D) | Mixed signals; potential reversal from daily oversold, but 4H trend is down. |
| MACD | Positive (1H) / Negative (4H) / Negative (1D) | Bullish (1H) / Bearish (4H, 1D) | Short-term momentum is up, but medium and long-term momentum is negative. |
| Stochastic | K=66.24, D=30.60 (1H) / K=73.15, D=48.77 (4H) / K=19.61, D=13.13 (1D) | Bullish (1H, 4H) / Bullish Crossover (1D) | Showing upward signals on shorter timeframes, including a bullish crossover in the oversold zone on the daily. |
| ADX | 18.14 (1H) / 60.67 (4H) / 25.72 (1D) | Weak Trend (1H) / Very Strong Downtrend (4H) / Strong Downtrend (1D) | Confirms weak trend on 1H, but very strong bearish trend on 4H and 1D. |
| Bollinger Bands | Above Mid (1H) / Below Mid (4H) / Below Lower Band (1D) | Bullish Bias (1H) / Bearish Bias (4H) / Oversold (1D) | Price action is mixed across timeframes, indicating potential consolidation or trend exhaustion. |
Bearish Scenario: Trend Continuation
65% ProbabilityNeutral Scenario: Range-Bound Consolidation
25% ProbabilityBullish Scenario: Reversal Play
10% ProbabilityFrequently Asked Questions: XAGUSD Analysis
What happens if XAGUSD breaks below the 4H support at $65.47 amid rising DXY?
A break below $65.47 would strongly invalidate any bullish reversal hopes and confirm the bearish trend. This could accelerate declines towards the $63.11 level, especially if the DXY continues its ascent towards 99.56, indicating dollar strength is dominating commodity prices.
Should I consider buying XAGUSD at current levels of $69.68 given the daily RSI at 27.92?
Buying solely based on the daily oversold RSI at 27.92 carries significant risk due to the strong 4H downtrend (ADX 60.67). While it's a potential contrarian play, confirmation signals like a sustained break above $69.87 and subsequent resistance levels are crucial before committing to a long position.
Is the ADX at 60.67 on the 4H chart a sell signal for XAGUSD right now?
An ADX of 60.67 signifies a very strong existing trend, which in this case is confirmed as bearish. While not a direct sell signal itself, it strongly suggests that the prevailing downward momentum is dominant and that short positions are favored, or that any bullish moves are likely temporary corrections within this trend.
How will the recent geopolitical pause and potential easing of tensions affect XAGUSD this week?
If geopolitical tensions ease significantly, the safe-haven demand for silver could diminish, potentially leading to profit-taking and a move lower for XAGUSD. This could negate the bullish arguments based on risk aversion and pressure prices towards support levels like $67.90, especially if coupled with dollar strength.
Track markets in real-time
AI-powered analysis, technical indicators and real-time price data.
Join Our Telegram Channel
Breaking market news, AI analysis and trading signals instantly.
Join Channel