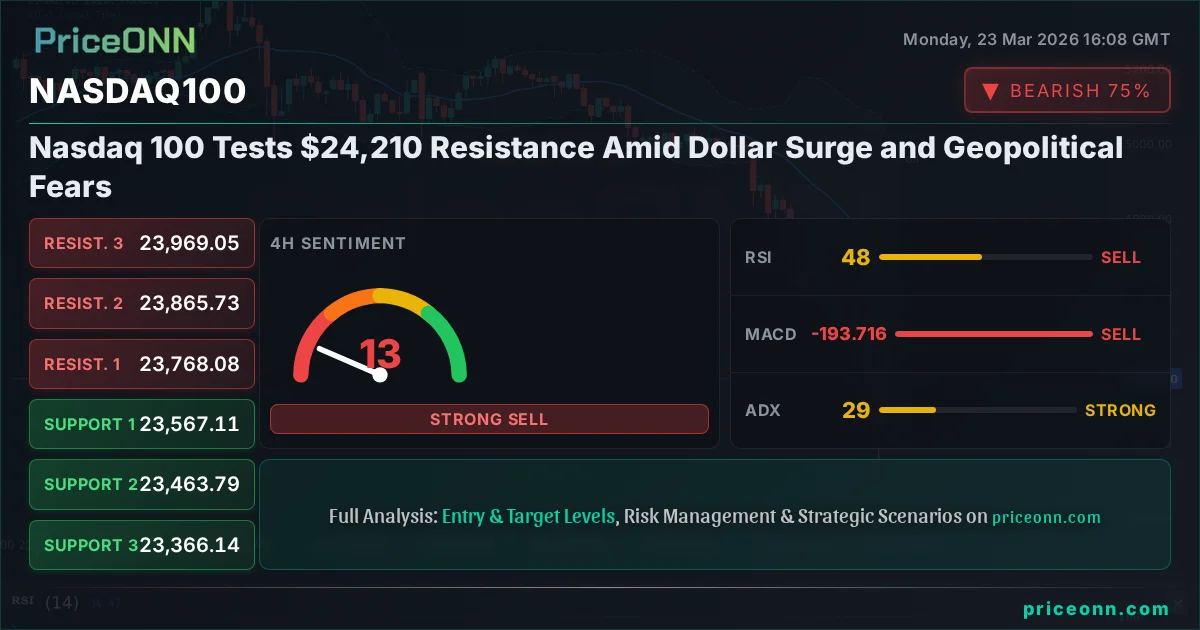
Nasdaq 100 Tests $24,210 Resistance Amid Dollar Surge and Geopolitical Fears
Nasdaq 100 at $24,210.04 faces critical resistance as the DXY strengthens on escalating Middle East tensions. Analysis points to potential volatility.
The Nasdaq 100 is currently hovering around the $24,210.04 mark, a level that represents a significant point of contention against prevailing upward momentum. This strategic juncture comes as the US Dollar Index (DXY) experiences a notable surge, driven by escalating geopolitical tensions in the Middle East and a palpable shift towards safe-haven assets. This confluence of factors creates a complex trading environment, demanding a nuanced approach from investors and traders alike.
- Nasdaq 100 is trading at $24,210.04, testing key resistance levels with an RSI of 57.56 indicating room for further upside but caution warranted.
- The US Dollar Index (DXY) is at 99.09, showing strength that typically pressures risk assets like the Nasdaq 100.
- Geopolitical fears are driving demand for the dollar, creating a risk-off sentiment that contrasts with the Nasdaq 100's upward trend.
- Key support for the Nasdaq 100 is identified at $24,157.41, while resistance looms around $24,476.45.
The current market narrative is heavily influenced by the escalating Middle East tensions, which have invariably bolstered demand for the US Dollar. As geopolitical fears mount, the DXY’s upward trajectory, currently consolidating above 99.50 and trading at $99.09, often correlates inversely with riskier assets such as the Nasdaq 100. This dynamic suggests that while the tech-heavy index has shown resilience, the strengthening dollar acts as a significant headwind, potentially capping further immediate gains and increasing the probability of a price correction or consolidation.
Navigating the Dollar's Strength
The US Dollar Index (DXY) has demonstrated remarkable strength, trading at $99.09. This appreciation is primarily fueled by its traditional role as a safe-haven asset during times of global uncertainty. Escalating Middle East tensions, as reported by Reuters, have intensified this demand, creating a challenging environment for riskier assets. For the Nasdaq 100, a stronger dollar typically translates to higher costs for international investors and can dampen the earnings potential of US multinational corporations, thereby putting downward pressure on the index. The current ADX reading of 24.79 on the 1-hour timeframe for DXY indicates a medium-strength downward trend, but its overall upward momentum on the 4-hour chart (ADX 16.03) and daily chart (ADX 34.7) suggests underlying strength that cannot be ignored.
The implications for EUR/USD and GBP/USD are significant. With the dollar strengthening, these pairs often face selling pressure. EUR/USD, currently at 1.1588, shows a mixed picture with a daily trend classified as bearish (94% strength), despite some short-term bullish signals. GBP/USD, trading at 1.33896, also shows a bearish daily trend (90% strength), indicating that the broader trend favors dollar strength against these major currencies, even if intraday movements suggest otherwise.
Nasdaq 100: Technical Picture Under Scrutiny
On the Nasdaq 100's 1-hour chart, the picture is one of cautious optimism, with a neutral trend and a strong upward signal from the Stochastic oscillator (K=78.14, D=64.41). The RSI at 57.56 is comfortably in neutral territory, suggesting room for further upside before becoming overbought. However, the MACD indicator showing positive momentum and the ADX at 45.92 signaling a strong upward trend indicate that bulls are trying to assert control. Key support levels are identified at $24,157.41, $23,969.05, and $23,768.08, providing potential floors for the index.
Conversely, the 4-hour and daily charts present a more cautionary outlook. The 4-hour trend is decidedly bearish with 100% strength, and the daily trend is also classified as bearish, with an ADX of 46.22 indicating a strong downward trend. This divergence between the short-term and longer-term timeframes highlights a critical battleground. While the 1-hour chart might suggest immediate buying opportunities, the longer-term technicals warn of underlying weakness. The RSI on the daily chart at 38.1, while not oversold, indicates a bearish leaning. The Stochastic on the daily (K=24.64, D=26.19) also suggests a bearish signal. This suggests that any upward movement might be met with significant selling pressure as longer-term traders react to the prevailing downtrend.
The conflict in signals between timeframes underscores the importance of risk management. The current price of $24,210.04 is a critical pivot point. A sustained break above the immediate resistance at $24,316.93 on the 1-hour chart could signal a short-term bullish continuation, targeting $24,476.45. However, failure to hold the support at $24,157.41 could trigger a sharper decline, potentially revisiting the $23,969.05 level and below, aligning with the bearish sentiment on the longer timeframes.
Intermarket Correlations: Gold and Oil in Focus
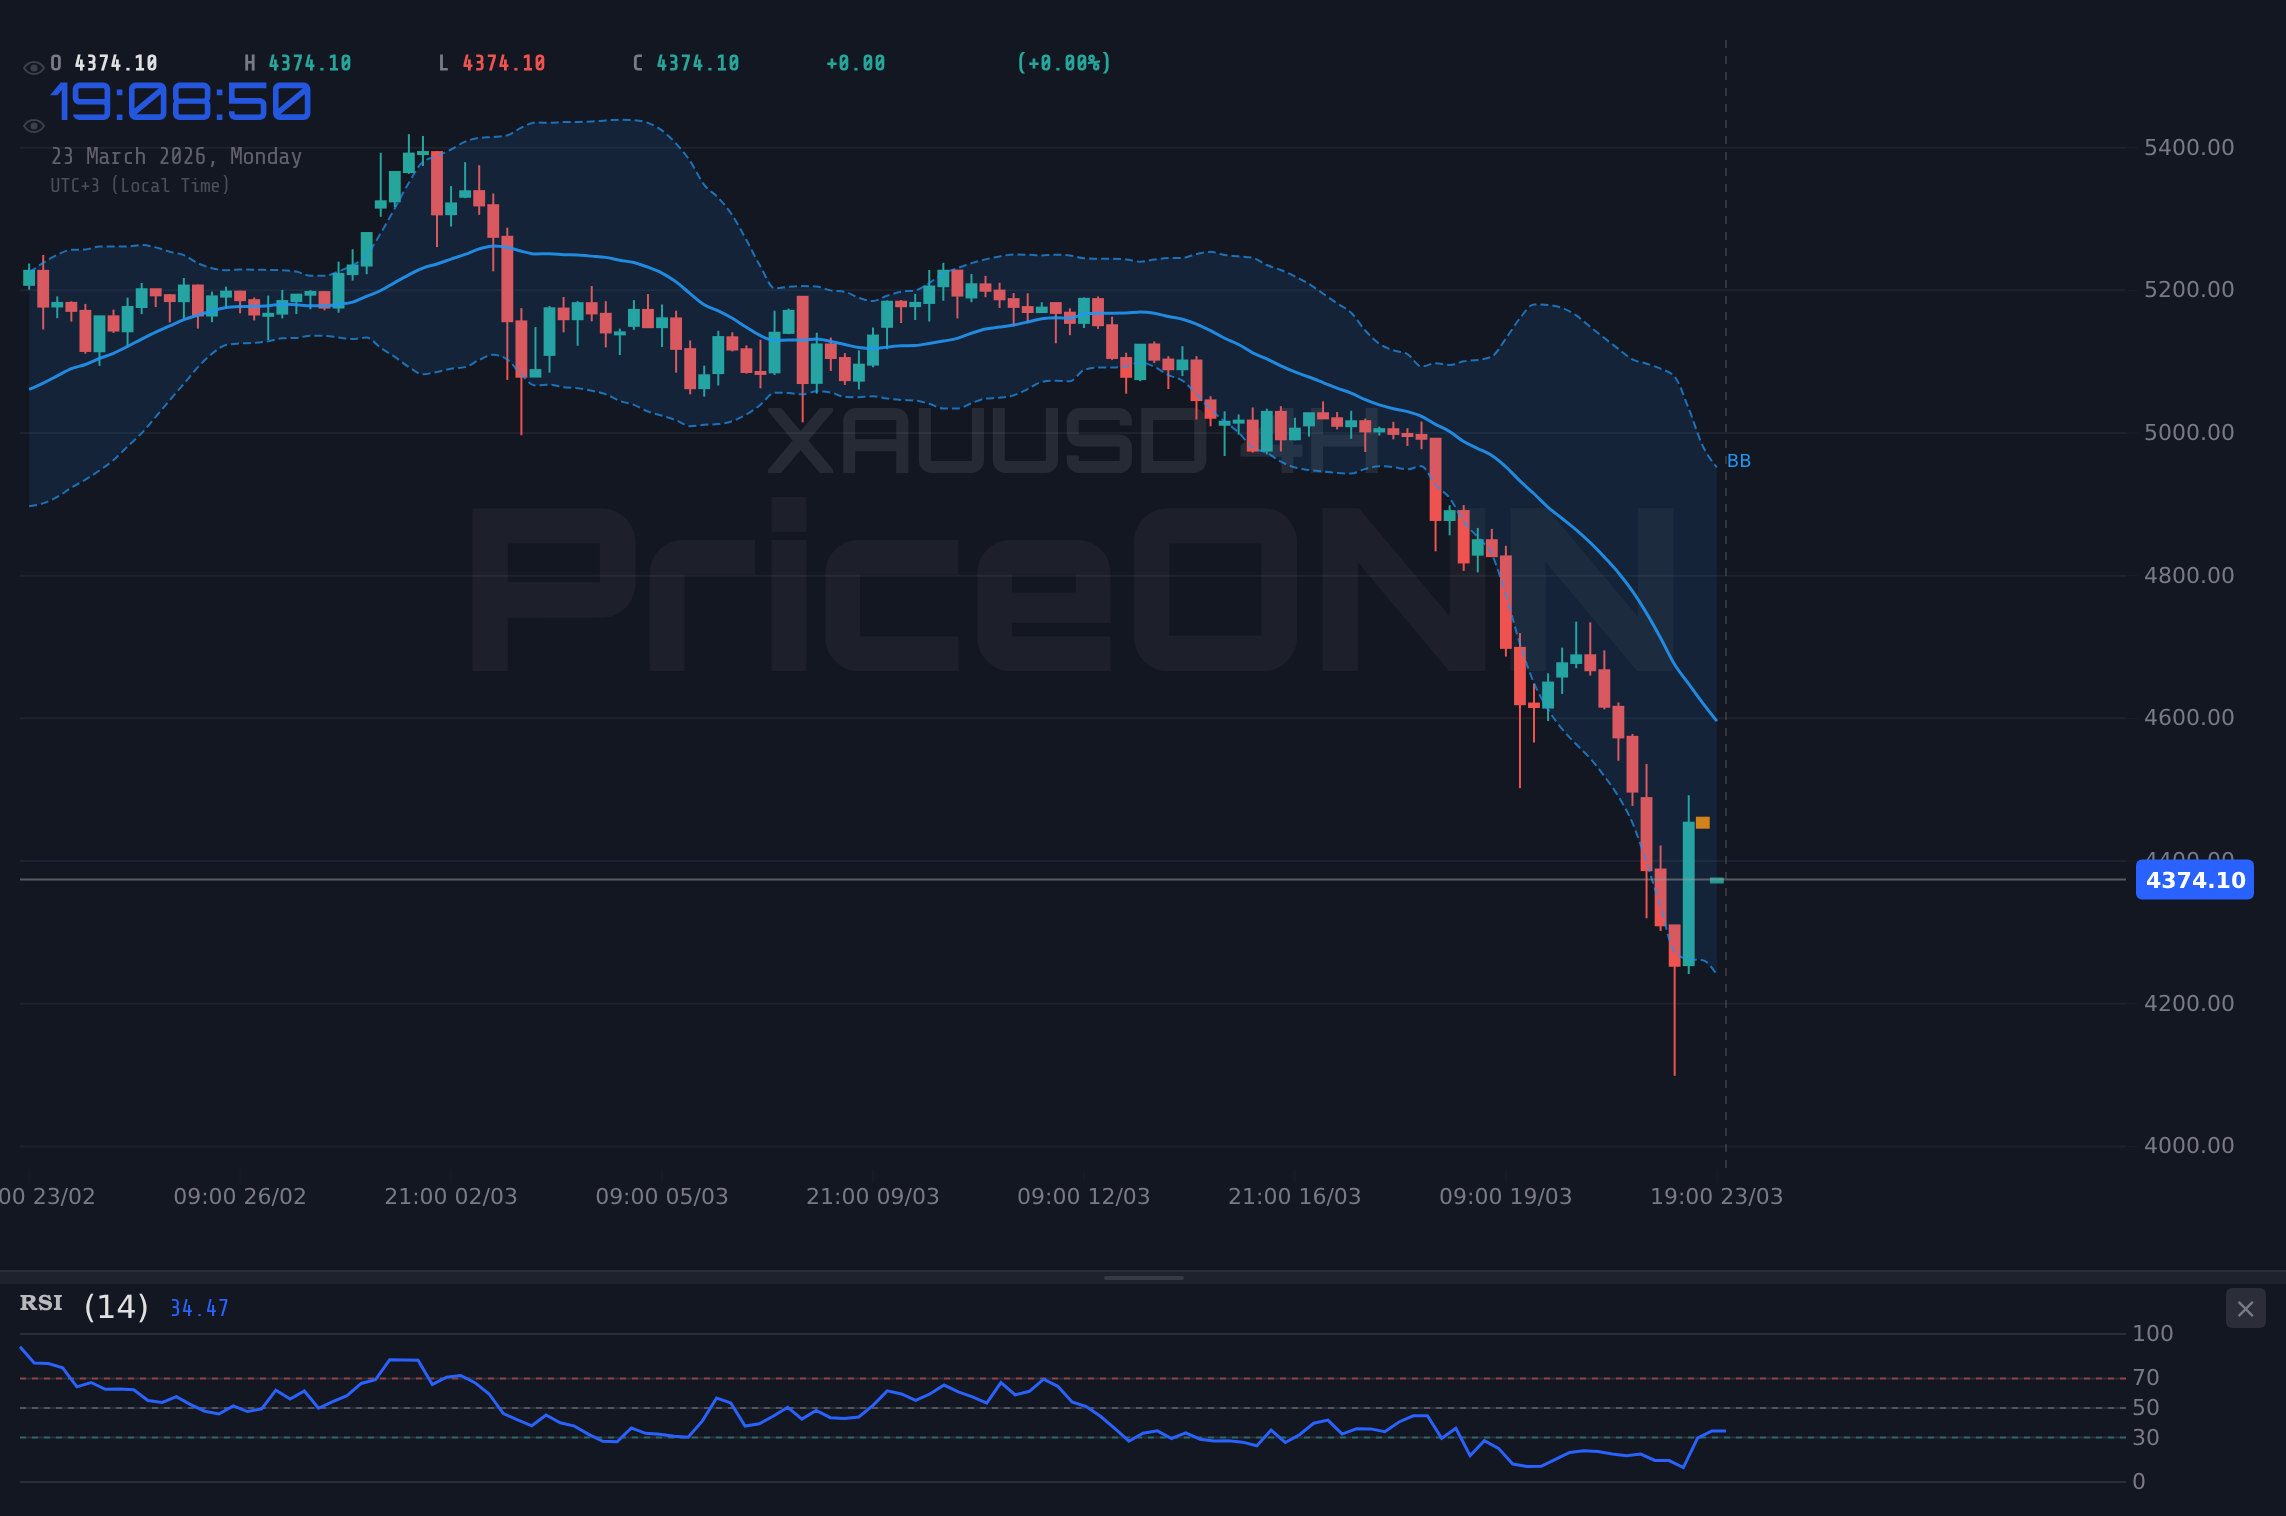
The current market environment, marked by geopolitical instability, naturally brings commodities like gold (XAUUSD) and oil (WTI, Brent) into sharp focus. Gold is currently trading at $4,373.49, showing a significant daily decline of -2.75%. This price action, despite the escalating Middle East tensions, suggests that the strengthening dollar is currently the dominant force, overshadowing traditional safe-haven demand for gold. The daily RSI of 26.75 indicates extreme oversold conditions, hinting at a potential bounce, but the strong bearish signals on the 4-hour and daily charts (ADX 65.39 and 22.26 respectively) suggest that the downward pressure might persist until the dollar eases or geopolitical fears significantly escalate further.
Oil prices are also experiencing volatility. Brent crude is trading at $102.81, down 8.72% on the day, while WTI is at $90.86, down 7.6%. This sharp decline, despite the supply fears stemming from the Middle East, is perplexing. The IEA's signal of readiness to release more crude from strategic reserves, coupled with potential demand slowdown fears due to a strong dollar and rising inflation, might be contributing to this price drop. The strong bullish trend on the daily chart for both Brent (ADX 66.19) and WTI (ADX 60.18) suggests that the recent pullback might be a temporary correction within a larger uptrend, especially if geopolitical risks re-emerge strongly.
The correlation here is crucial. A sustained rise in the dollar and a potential slowdown in global growth, hinted at by the commodity price action, could indirectly impact the Nasdaq 100 by increasing the cost of capital and dampening corporate earnings. Conversely, a sudden escalation of Middle East tensions could reverse the trend in oil and gold, potentially creating a flight to safety that benefits the dollar but hurts equities.
Economic Calendar and Fed Watch
Looking ahead, market participants will be closely monitoring upcoming economic data releases, particularly those that could influence Federal Reserve policy. While specific upcoming events are not detailed in the provided data, the general sentiment surrounding inflation and growth remains critical. Elevated oil prices, if sustained, could embed inflationary pressures, potentially keeping the Fed on a hawkish stance or delaying anticipated rate cuts. Conversely, signs of slowing growth could prompt a more dovish approach. Traders are pricing in various scenarios, and any deviation from expectations could trigger significant market movements across all asset classes, including the Nasdaq 100.
The dynamic between the dollar's strength, commodity price action, and the Nasdaq 100's technicals creates a complex trading landscape. While short-term technicals might offer trading opportunities, the overarching macroeconomic and geopolitical factors demand a cautious and risk-managed approach. The $24,210.04 level for the Nasdaq 100 represents a critical battleground where short-term bullish momentum clashes with longer-term bearish trends and the powerful influence of a strengthening dollar.
Bearish Scenario: Dollar Dominance and Tech Sell-off
65% ProbabilityConsolidation Scenario: Waiting for Clarity
25% ProbabilityBullish Scenario: Short-Term Momentum Prevails
10% Probability| Indicator | Value | Signal | Interpretation |
|---|---|---|---|
| RSI (14) | 57.56 | Neutral | Room for upside, but watch for overbought conditions |
| MACD Histogram | Positive | Bullish | Positive momentum observed |
| Stochastic | K=78.14, D=64.41 | Bullish | Bullish crossover, nearing overbought territory |
| ADX (1H) | 45.92 | Strong Uptrend | Indicates strong short-term upward momentum |
| ADX (1D) | 46.22 | Strong Downtrend | Confirms longer-term bearish pressure |
| Bollinger Bands (1H) | Above Middle Band | Bullish | Short-term upward bias |
| Bollinger Bands (1D) | Below Middle Band | Bearish | Longer-term downward pressure |
Frequently Asked Questions: Nasdaq100 Analysis
What happens if the Nasdaq 100 breaks below the $24,157.41 support level?
A break below $24,157.41 would invalidate the short-term bullish signals and align with the longer-term bearish trend observed on the daily charts. This could trigger a move towards the next support at $23,969.05, as traders react to the strengthening dollar and potential risk-off sentiment.
Should I buy Nasdaq 100 at current levels around $24,210.04 given the mixed signals?
Buying at current levels requires careful risk management due to conflicting signals between short-term bullish momentum and longer-term bearish trends. A high-probability setup would involve waiting for a confirmed break above $24,316.93 resistance or a clear bounce from $24,157.41 support, with a tight stop-loss in place.
Is the RSI at 57.56 a sell signal for Nasdaq 100 right now?
An RSI of 57.56 is not typically considered a sell signal as it sits in neutral territory, indicating room for further upside. However, it does suggest that the upward momentum is steady rather than explosive, and traders should watch for it to approach overbought levels (above 70) for more definitive signs of exhaustion.
How will the escalating Middle East tensions affect the Nasdaq 100 this week?
Escalating tensions typically drive demand for safe-haven assets like the US Dollar (currently at 99.09), which can pressure risk assets like the Nasdaq 100. If tensions worsen significantly, we could see increased volatility and a potential move lower in the index as investors reduce risk exposure.
Time Horizon: This analysis focuses on short-to-medium term trading opportunities, considering intraday and daily chart dynamics.
The Nasdaq 100 is at a critical juncture, trading at $24,210.04, caught between short-term bullish signals and longer-term bearish pressures amplified by dollar strength and geopolitical uncertainty. While the 1-hour chart shows potential for an upward move towards $24,476.45, the daily chart suggests caution is warranted. A decisive break below $24,157.41 could trigger further declines, aligning with the dominant trend. Traders should remain vigilant, manage risk diligently, and await clearer directional conviction before committing significant capital.
Track markets in real-time
AI-powered analysis, technical indicators and real-time price data.
Join Our Telegram Channel
Breaking market news, AI analysis and trading signals instantly.
Join Channel